OATAO is an open access repository that collects the work of Toulouse
researchers and makes it freely available over the web where possible
Any correspondence concerning this service should be sent
to the repository administrator:
[email protected]
This is an author’s version published in:
https://oatao.univ-toulouse.fr/26116
To cite this version:
Quintero Rincón, Antonio and Flugelman, Máximo and Prendes,
Jorge and D'Giano, Carlos Study on epileptic seizure detection in
EEG signals using largest Lyapunov exponents and logistic
regression. (2019) Revista Argentina de Bioingeniería, 23 (2).
17-24. ISSN 0329-5257
Study on epileptic seizure detection in EEG signals
using largest Lyapunov exponents and
logistic regression
Antonio Quintero-Rinc´on
1, M´aximo Flugelman
2, Jorge Prendes
3and Carlos D’giano
11Fundaci´on contra las Enfermedades Neurol´ogicas Infantiles (FLENI), Buenos Aires, Argentina. 2Deparment of Bioengineering, Instituto Tecnol´ogico de Buenos Aires, Argentina.
3University of Toulouse, IRIT-INP-ENSEEIHT, Toulouse, France.
Abstract— Seizure detection plays a central role in most aspects of epilepsy care. Understanding the complex epileptic signals system is a typical problem in electroencephalographic (EEG) signal processing. This problem requires different analysis to reveal the underlying behavior of EEG signals. An example of this is the non-linear dynamic: mathematical tools applied to biomedical problems with the purpose of extracting features or quantifying EEG data. In this work, we studied epileptic seizure detection independently in each brain rhythms from a multilevel 1D wavelet decomposition followed by the independent component analysis (ICA) representation of multivariate EEG signals. Next, the largest Lyapunov exponents (LLE) and their scaling given by its ± standard deviation are estimated in order to obtain the vectors to be used during the training and classification stage. With this information, a logistic regression classification is proposed with the aim of discriminating between seizure and non-seizure. Preliminary experiments with 99 epileptic events suggest that the proposed methodology is a powerful tool for detecting seizures in epileptic signals in terms of classification accuracy, sensitivity and specificity.
Keywords— Largest Lyapunov exponents, Logistic Regression, ICA, Filter Banks, Wavelets, Epilepsy, EEG.
Resumen— La detecci´on de convulsiones juega un rol muy importante en el tratamiento de la epilepsia. Entender el sistema complejo de las se ˜nales epil´epticas es un problema t´ıpico en procesamiento de se ˜nales electroencefalogr´aficas (EEG). Este problema requiere diferentes tipos de an´alisis para poder determinar el comportamiento subyacente de las se ˜nales EEG. Un ejemplo de esto es la din´amica no lineal: herramientas matem´aticas aplicadas a problemas biom´edicos con el prop´osito de extraer caracter´ısticas o cuantificar datos del EEG. En este trabajo, estudiamos la detecci´on de crisis epil´epticas de forma independiente en cada ritmo cerebral a partir de una descomposici´on wavelet multinivel 1D seguida de un an´alisis de componentes independientes (ICA) de se ˜nales de EEG multivariadas. A continuaci´on, se estiman los mayores exponentes de Lyapunov (LLE) y su escalamiento dado por su ± desviaci´on est´andar para obtener los vectores que se utilizar´an durante la etapa de entrenamiento y clasificaci´on. Con esta informaci´on, se propone una clasificaci´on usando la regresi´on log´ıstica con el objetivo de discriminar entre convulsi´on y no-convulsi´on. Experimentos preliminares con 99 eventos epil´epticos, sugieren que la metodolog´ıa propuesta es una poderosa herramienta para detectar ataques convulsivos en se ˜nales epil´epticas en t´erminos de precisi´on, sensibilidad y especificidad del clasificador.
Palabras clave— M´aximo Exponente Lyapunov, Regresi´on Log´ıstica, ICA, Banco de Filtros, Wavelets, Epilepsia, EEG.
I. INTRODUCTION
E
lectroencephalography (EEG) is the predominant mo-dality to study abnormal cerebral activity, showing the generalized activity of the cerebral cortex. The resulting signal is composed of a range of electrical or independent brain rhythms that closely correlate with a particular behavior or pathology states. These rhythms help diagnose certain neu-rological conditions such as epileptic seizures. The Interna-tional League Against Epilepsy (ILAE) [1] defines ”epileptic seizure” as a transient occurrence of signs and/or symptoms due to abnormal excessive or synchronous neuronal activity in Contact: Antonio Quintero-Rinc´on, Centro Integral de Epilepsia y Unidad de Monitoreo de Videoelectroencefalograf´ıa, Fundaci´on contra las Enfermedades Neurol´ogicas Infantiles (FLENI), Phone +541157773200, Buenos Aires, Ar-gentina, [email protected]the brain. According the World Health Organization [2], there are more than 50 million people worldwide that suffer from some form of epilepsy, nearly 80% of them are in developing regions, where it is believed that 3 out of 4 people with this conditions do not get appropriate diagnostic and treatment.
Brain rhythms (namely the delta (δ), theta (θ), alpha (α), beta (β) and gamma (γ) bands) play an important role in spike timing and brain communication. Each brain region produces distinctly different brain rhythm frequencies that are thought to reflect unique brain activities, which is important for the localization, parceling, and routing of information within and between regions [3]. A recent study that compares the spectral power in the different brain rhythms across 10 mental health disorders such as depression, bipolar disorder, addiction, autism, ADHD, anxiety, panic disorder,
obsessive-compulsive disorder (OCD), post-traumatic stress disorder (PTSD) and schizophrenia; suggest that it is necessary to have caution with any interpretation of results from studies that consider only one disorder in isolation [4]. Extrapolating this to epilepsy disease is important, due to the considerable variability in the studies, reports based on a subset of studies or the highly inconsistent between experts makes it difficult to normalize all the differences found in the researches.
The amplitude of the EEG signal strongly depends on how synchronous is the activity of the underlying neurons, as small electric signals sum to generate one larger surface signal when a group of cells are excited simultaneously. However, when each cell receives the same amount of excitation but spread out in time, the summed signals are meager and irregular. This behavior is usually caused by a pathological discharge patterns generated in the basal ganglia [3]. Note that in this case, the number of activated cells and the total amount of excitation may not have changed, only the timing of the activity. If synchronous excitation of this group of cells is repeated, again and again, the resulting EEG will consist on a signal representing the normal activity of the brain, but if this group of cells presents an excessive excitation, it represents an abnormal activity as is the case during an epileptic seizure [5]. See Table I for a comprehensive relationship between the brain rhythms and their epilepsy clinical association.
Brain Rhythm Frequency (Hz)
Amplitude (µV)
Region Cognitive activity Epileptic clinical association Delta (δ) < 4 20-200 Frontal,
Temporal, Occipital
Deep sleep, waking state, normal in infants, sleeping adults. Intermittent or non-rhythmic slow wave. Newborn seizures.
Delta brush: beta-delta complexes and ripples of prematurity. Semirhythmic hallmarks of slow wave sleep.
Sharply-contoured slow waves. Hypersynchrony. Intermittent rhythmic activity. Focal spiking.
Chaotic bursts. Theta (θ) 4-7 20-100 Temporal,
Occipital
It is more common in children and young adults than in older adults, locomotion, sensory information, consciousness slips to-wards drowsiness, unconscious material, creative inspiration, deep meditation, maturational and emotional studies, sleeping adults, drowsiness, spatial memory processes.
Newborn seizures. Triphasic waves.
Burst with a morphology very similar to ictal patterns. Rhythmic vertex.
Semirhythmic hallmarks of the onset of drowsiness. Sleep-related hypersynchronies.
Sharply-contoured slow waves. Sharp temporal discharges.
Theta pointu alternant: Neonatal alternating sharp theta. Abnormal in the adult during wakefulness. Alpha (α) 8-12 20-60 Occipital When there is no attention, mental fatigue, cognitive disorders,
awake but relaxed, attenuation as an indicator of visual activity during dreaming, semantic memory processes, to any type of task, during visually presented stimulations.
A slow decrease in frequency with an increase in amplitude.. Loss of reactivity to eye-opening or to mental alerting. Desynchronization when moving a body part. Intrude into a deep sleep or attention dramatically. An absence of the posterior rhythm. Beta (β) 13-29 2-30 Frontal,
Central, Parietal
Active thinking, active attention, focus on the outside world or solving concrete problems, is found in normal adults, panic state, rises immediately after the task, sensory-motor area, drowsiness, light sleep, REM sleep, a relatively sudden, diffuse increase in activity can mark onset of early drowsiness
Increase or decrease in waves activity. Triphasic waves.
A smaller magnitude and delayed in motor movements. High voltage or plentiful activity.
Asymmetry. Gamma (γ) 30 < 5-10 Frontal, Central Childhood, memory tasks, awakening, REM sleep, working, right
and left index finger movement, right toes and the rather broad and bilateral area for tongue movement.
Highest levels of cerebral blood flow. Asynchrony bursts
TABLE I
BRAIN RHYTHMS AND THEIR EPILEPSY CLINICAL ASSOCIATION
Independent component analysis (ICA) is a method to find underlying sources (or components) from multivariate or multidimensional statistical data. The main idea of ICA is to find a linear representation of non-Gaussian data in such a way that the components are statistically independent. The advantage of identifying these independent features is that, when used in combination with other methods such as largest Lyapunov exponents (LLE), it may be possible to distinguish between seizure (ictal) and non-seizure (interictal) in a higher dimensional feature space [6]. ICA has been successfully used by the scientific community and has been
applied to numerous signal processing problems in diverse areas such as biomedicine, bioengineering, communications, finance and remote sensing; and keeps evolving [7]. ICA is widely used in EEG data and it applications are very varied, for example in [8] was demonstrated that ICA can be an efficient approach to separate responses related to epilepsy which are commonly obtained through fMRI studies, or in [9] to select the PROJection onto Independent Components (PROJIC) from EEG data collected during fMRI acquisitions to detect Inter-ictal epileptiform discharges, or by using a new deflation ICA algorithm called penalized semialgebraic unitary deflation (P-SAUD) in order to remove artifacts from interictal epileptic spikes [10].
Largest Lyapunov exponents (LLE) is a time-dependent analysis technique that can be used to infer the properties of a system. In a medical context, they describe the time interval over which the system’s evolution diverges, helping to discriminate seizures from non-seizures [11], [12]. In recent studies, the Lyapunov coefficients were applied as a filter-noise that can be used as an epilepsy detector [13], as features in order to predict epileptic seizures in synthetic signals [14], coupled with the adaptive Teager energy to seizure detection in long-term signals with a sensitivity of 91% and a specificity of 86% [15], or by using point-process to correlate the heartbeat dynamics with the epileptic signals and SVM classifier with an
accuracy of 73.91% [16], for EEG patterns classification based on continuous neural networks by using a generalization-regularization with an accuracy of 97.2% [17]; as a seizure prediction in intracraneal signals (iEEG) with a sensitivity of 89.8% and a specificity of 96.7% [18], or to detect metabolic encephalopathy by using SVM with a specificity of 100% and a sensitivity of 95.33% [19].
Logistic regression classifier (LRC) is one of the most common multivariate analysis models used in biomedical applications for analyzing binary outcome data [20], [21]. The choice of the explicative variables that should be included in
the logistic regression model is based on prior knowledge of epilepsy and the statistical correlation between the variable and the epileptic event [22], [23]. In our case the correlation between the seizure and the largest Lyapunov exponent. In recent works, the LRC coupled with Cox regression has been used to construct time to first EEG seizure in neonates subjects [24] or to classifier the significant non-antiepileptic drug predictors of psychiatric and behavioral side effects rate [25], or in average recurrence risk estimation of ictal asystole and its determining factors in people with epilepsy [26].
In this work, the EEG signal was decomposed for each brain rhythms using a multilevel 1D wavelet decomposition followed by ICA to study the epileptic dynamic features of EEG during seizure (ictal) and non-seizure (interictal) behavior. The difference between typical ictal and interictal feature values enables us to distinguish between the two states, which are identified through the largest Lyapunov exponents (LLE). The results allow us to differentiate the distinctive and appreciable changes during epileptic seizures, discriminating normal from abnormal brain activity. Next, a LLE scaling between the ± standard deviation is estimated in order to obtain a vector can be classified between two classes, seizure or non-seizure. Therefore, the logistic regression classifier is proposed with the aim of discriminating between seizure and non-seizure. All these methods have been used in epileptic EEG signals in a wide variety of applications, but to the best of our knowledge, this methodology has not been investigated for EEG signal classification.
The remaining of this document is structured as follows. The proposed methodology is explained in Section II with a brief introduction of the largest Lyapunov exponents theory and the logistic regression in subsections II-A and II-C respectively. Then in Section III the methodology is demonstrated on real EEG signals from patients suffering from epileptic seizures. Discussions and conclusions are finally reported in Section IV.
II. METHODOLOGY
Let X ∈ RN ×M denote the multivariate matrix gathering M EEG signals xm ∈ RN ×1 measured simultaneously on different channels and at N discrete time instants. Then we decompose the EEG signal X to evaluate the energy distribution throughout the neurological frequency spectrum or brain rhythm. The following bands are commonly identified [27] according to their frequency f :
1) Delta (δ): for f < 4 Hz. 2) Theta (θ): for 4 ≤ f ≤ 7 Hz. 3) Alpha (α): for 8 ≤ f ≤ 12 Hz. 4) Beta (β): for 13 ≤ f ≤ 29 Hz. 5) Gamma (γ): for 30 ≤ f ≤ 64 Hz.
The wavelet decomposition is done using time-frequency Daubechies 1D wavelet decomposition [28] with 6 scales. Therefore the brain rhythms of X is given by
XB= h
XDδ XTθ XAα XBβ XGγ iT
(1) where D, T , A, B and G are the corresponding different sizes of each brain rhythm resulting from the wavelet decomposition (e.g. the coefficients). We use χb ∈ RM ×B to reference the content of each XB vector, where B represents the size of
each brain rhythm and 1 ≤ b ≤ 5 corresponds: 1 to the delta band, 2 to the theta band, 3 to the alpha band, 4 to the beta band and 5 to the gamma band.
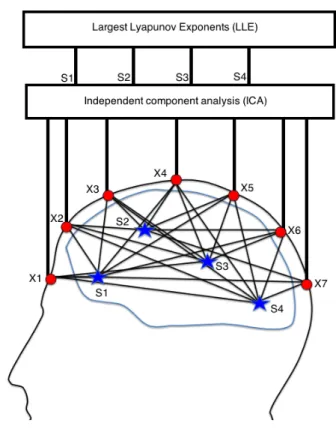
The Independent component analysis (ICA) is a representa-tion of a signal (the brain rhythm of equarepresenta-tion (1) in this case) through a set of independent constituent components given by the likelihood ρ (XB|S) = T Y t=1 ρ (χt|S) (2) where ρ (XB|S) is the joint probability distribution, ρ (χt|S) are the marginal distributions, S ∈ RT ×B are the unknown sources and T is the number of independent components (see Figure 1).
Fig. 1. Example for seven electrodes, namely X1, ..., X7and four sources
S namely s1, .., s4, representation of assumption that the source signals arrive
at the electrodes at the same time instantaneously.
We assume that the source signals arrive at the electrodes at the same time instantaneously, thus the problem of separating sources corresponding to the independent components for each brain rhythm, of equation (1) is given by
χt= Hst+ v (3) where χt is the observed signal matrix, H is the mixing matrix, s is the source matrix and v is the noise.
The separation is performed by means of a matrix W ∈ RT ×M, the so-called unmixing matrix, which uses only the information in χt to reconstruct the original source signals (also known as the independent components) as:
yt= W χt (4)
The estimation of the unmixing matrix W in equation (4) is calculated using singular value decomposition (SVD) through the eigenvalue decomposition of the covariance matrix (prewhitening) and the JADE algorithm for real-valued signals [29], to find the best estimation of the independent sources S through
Y = W XB (5)
The independent sources Y from equation (5) for each brain rhythm is split into sets of non-overlapping 2 seconds segments using a rectangular sliding window so that
Y(i)= Ω(i)Y (6)
Ω(i)=h0L×iL, IL×L, 0L×N −iL−Li (7) where 0N ×M ∈ RN ×M is the null matrix, IN ×N
∈ RN ×N is the identity matrix and L is the number of measurement obtained in 2 seconds.
We refer the reader to [30]–[33] for a comprehensive treatment of the mathematical properties of ICA and SVD. A. Largest Lyapunov exponent (LLE)
Epileptic seizure detection has a great track record since the 1970s, see [28], [34] for a comprehensive state-of-the-art of this topic. The nonlinear prediction technique to separate transients from background activity using Lyapunov exponents was first investigated by Leonidas D. Iasemidis and J. Chris Sackellares in [35] where the lowest values of Lyapunov exponents occur during the seizure. This gives us an idea of how much the EEG signal background changes when a small perturbation or change occurred during the seizure process.
The largest Lyapunov exponent is estimated by means of two time series, Y(i)1 and Y
(i)
2 (we would like to remind the reader that Y(i)denotes each segment of the evaluated signal); which originate from the same system and have similar initial conditions [36], defined as a distance vector
dist(i) = Y (i) 1 − Y (i) 2 (8)
and the Lyapunov exponent λ = 1
i log dist(i)
dist(0) (9)
where i is the sample number and dist(0) is the distance between the initial sample points on the two trajectories. A trajectory is the path that the variables trace throughout the phase space. Phase space represents all possible internal states of a system. The divergence value of λ magnify small changes in a trajectory that grow over time [37], this value shows how an increase in distance between trajectories that start from similar conditions become increasingly decorrelated, contrary to convergence. This can be summarized as follows
• If λ > 0 then the divergence is exponential. • If λ < 0 then the convergence is exponential. • If λ = 0 then there is no divergence or convergence. For each segment of equation (6) and each brain rhythm, of equation (1) a largest Lyapunov exponent λ is estimated using equation (9) according to the divergence or convergence of the considered value. This allows us to discriminate the divergence or convergence between seizure and non-seizure in epileptic
signals. Two positive Lyapunov exponents were estimated [38]. The presence of a positive exponent is sufficient to detect the seizure.
We refer the reader to [36], [38]–[40] for a comprehensive treatment of the mathematical properties of the largest Lya-punov exponents.
B. Scaling
Each largest Lyapunov exponent value for each brain rhythm is assigned one scale value between the minimum and the maximum of the standard deviation, see Table II.
Let `sup= +λstd, `inf = −λstd, λmin= min(LLE) and λmax= max(LLE), then the scale value is given by
w = (λ − λmin)(`sup− `inf)
λmax− λmin + `inf (10) The proposed seizure detection is a classifier by using lo-gistic regression, that labels each Largest Lyapunov exponents (λ) and their scales (w) associated with each brain rhythm as seizure or non-seizure. Precisely, five independent two-parameter classifiers are used in parallel to classify the feature vector pairs φδ(n) = [λδ(n), wδ(n)], φθ(n) = [λθ(n), wθ(n)], φα(n) = [λα(n), wα(n)], φβ(n) = [λβ(n), wβ(n)], and φγ(n) = [λγ(n), wγ(n)].
C. Logistic Regression
Consider a classification into two possible classes: C1 for seizure and C2 for non-seizure. The posterior probability of class C1 can be written as
ρ (C1|x) = ρ(x|C1)ρ(C1) ρ(x|C1)p(C1) + ρ(x|C2)p(C2) (11) = 1 1 + exp(−a) = σ(a) (12) a = lnρ(x|C1)ρ(C1) ρ(x|C2)ρ(C2) (13) where σ(.) is the logistic sigmoid function, and the class-conditional densities are assumed Gaussian [20]. Then the posterior probability of class C1 can be written as a logistic sigmoid acting on a linear function of the feature vector φ so that
ρ(C1|φ) = σ(wTφ) (14) ρ(C2|φ) = 1 − ρ(C1|φ) (15) w = Σ−1(µ1− µ2) (16) assuming that all classes share the same covariance matrix Σ and µ are the means of each class. For a data set {φ, tn}, where tn ∈ {0, 1}, 0 for class C2 and 1 for class C1, and φn= φ(xn), with n = 1, .., N the likelihood can be written
ρ(t|w) = N Y n=1 ytn n {1 − yn} 1−tn (17)
where t = (t1, t2, .., tN)T and yn = ρ(C1|φb(n)). It should be noted that the feature vector φb(n) is given by each LLE (λ) and their scales (w) of each brain rhythm (b). We refer the reader to [20], [21] for a comprehensive treatment of the mathematical properties of the logistic regression.
The methodology used can be summarized in four basic steps through the algorithm 1.
Data: Epileptic EEG signals
Result: Seizure and Non-Seizure detection begin
1. Find all independent brain rhythms using univariate wavelet 1D decomposition;
2. Compute the independent features of each brain rhythms using ICA decomposition;
3. Compute LLE for all independent brain rhythms of 2.;
4. Scaled each LLE from step 3. between the minimum and the maximum of the standard deviation;
5. Seizure detection for each LLE and scale pairs by using logistic regression.
end
Algorithm 1: Epileptic seizure detection algorithm
D. Database
We evaluated the performance of the proposed seizure detector using the Children’s Hospital Boston database [41], [42], which consists of 22 EEG bipolar recordings sampled at 256Hz from pediatric subjects with intractable seizures. No distinctions regarding the types of seizure onsets were considered; the data contains focal, lateral, and generalized seizure onsets. Furthermore, the recordings were made in a routine clinical environment, so non-seizure activity and artifacts such as head/body movement, chewing, blinking, early stages of sleep, and electrode pops/movement are present in the data. For more details see [43].
III. RESULTS
In this work, we used 99 epileptic events from 11 subjects with the same montage of 23 channels, organized as follows: 33 events before the seizure, 33 events after the seizure and 33 events during the seizure. Hence each epoch is comprised of non-seizure before, seizure and non-seizure after. Therefore each signal was edited to have an epoch with the following characteristics: 2 minutes before the seizure, seizure at minute 2 and 2 minutes after the seizure, note that the seizure begins at minute 2. Each recording contained a seizure event with a labeled onset that was detected by an experienced neurologist, who worked backward from the observed clinical onset to find the electrical onset.
Figures 2 to 6 show how the EEG signal background changes through the six largest Lyapunov exponents (LLE) from 9 independent components by using ICA. Two LLE be-fore, two LLE during and two after the seizure ICA process. In the delta, theta and alpha brain rhythms the largest Lyapunov exponent (LLE) presents the lowest value, while in beta and gamma brain rhythms the opposite happens. This suggests that the algorithm is potentially interesting for epilepsy detection systems because it permits discriminating seizure from non-seizure in all brain rhythms.
Table II shows the minimum LLE (λmin), maximum LLE (λmax) and the standard deviation from LLE (λstd) through all the data utilized that permits the use of a threshold approach in order to scale each LLE by using the equation (10).
The logistic regression classifier was trained off-line with 20 empirical fold cross-validation. In this stage, we used
Brain rhythm λmin λmax λstd
δ Non-Seizure -0.00266 0.00028 0.00074 δ Seizure -0.00328 -0.00003 0.00092 θ Non-Seizure -0.00249 0.00052 0.00064 θ Seizure -0.00368 -0.00002 0.00103 α Non-Seizure -0.00443 0.00117 0.00111 α Seizure -0.00641 0.00027 0.00147 β Non-Seizure -0.00311 0.00177 0.00068 β Seizure -0.00317 0.00346 0.00111 γ Non-Seizure -0.00281 0.00364 0.00079 γ Seizure -0.00082 0.00768 0.00149 TABLE II
MINIMUM,MAXIMUM AND STANDARD DEVIATION FROM ALLLLEFOR EACH BRAIN RHYTHM,CALLED THEdelta (δ), theta (θ), alpha (α), beta
(β)ANDgamma(γ)BANDS.
two classes: seizure and non-seizure for each pair [λb, wb] for each brain rhythm (b). The performance of the logistic regression classification method through 792 observations with 2 predictors [λb, wb] for each brain rhythm (b) was assessed in terms of overall accuracy classification, and achieves a 100% of sensitivity (True positive rate) and specificity (True false rate) for seizure detection in epilepsy signals with time-delay of 8.9 sec in average for all brain rhythms.
We suggest that these good results in the classification are due to the fact that the LLE coupled with their scaling can discriminate correctly between seizure and non-seizure in all brain rhythms, as shown in the values of the Table II and the visual observation of the LLE figures 2 to 6.
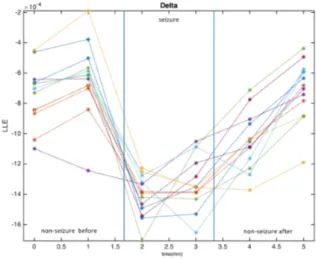
Fig. 2. Scatter plot for six largest Lyapunov exponents (LLE) for seizure (middle) and non-seizure before an after events observed through the delta band. Lowest valued LLE are in the seizure event. Seizure onset begins at minute 2
Note that, the dataset used for the training and classification stage has an unequal class distribution. Seizure events are related to class 1, while the seizures before and the seizures after the seizure were concatenated in class 0. Therefore, the proportion among the number of examples of each class of the problem has a ratio of 1:2, 33 seizures: 66 non-seizures. Technically our dataset is imbalanced. This can be a great limitation in our performance because the classifier proposed may be an accuracy oriented design, which usually makes the minority class to be overlooked. In this sense,
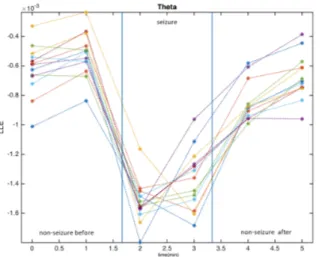
Fig. 3. Scatter plot for six largest Lyapunov exponents (LLE) for seizure (middle) and non-seizure before an after events observed through the theta band. Lowest valued LLE are in the seizure event. Seizure onset begins at minute 2.
Fig. 4. Scatter plot for six largest Lyapunov exponents (LLE) for seizure (middle) and non-seizure before an after events observed through the alpha band. Lowest valued LLE is in the seizure event. Lowest value LLE are in the seizure event. Seizure onset begins at minute 2.
according to [44], [45], our ratio in our dataset is considered as a low imbalanced problem, which permits suggest that the methodology proposed is a powerful tool for detecting seizures in epileptic signals in terms of classification accuracy, sensitivity, and specificity.
IV. DISCUSSION AND CONCLUSIONS
This preliminary work presented a study for classification to detect seizure and non-seizures in epileptic signals. The method is based on two largest Lyapunov exponents (LLE) coupled with their scaling based on the standard deviation from the LLE in order to classify by using the logistic regres-sion independently in each brain rhythms from a multilevel 1D wavelet decomposition followed by ICA analysis. The performance of the proposed method was evaluated on a real dataset containing 99 epileptic events achieving a 100% of sensitivity (True positive rate), specificity (True false rate) for seizure detection and area under curve of 100% for each
Fig. 5. Scatter plot for six largest Lyapunov exponents (LLE) for seizure (middle) and non-seizure before an after events observed through the beta band. Highest valued LLE are in the seizure event. Seizure onset begins at minute 2.
Fig. 6. Scatter plot for six largest Lyapunov exponents (LLE) for seizure (middle) and non-seizure before an after events observed through the gamma band. Highest valued LLE are in the seizure event. Seizure onset begins at minute 2.
brain rhythm, which suggests that the proposed methodology is potentially useful for seizure detection in EEG signals but with an time-delay of 8.9 sec in average for all brain rhythms. This value is a bit high with respect to some state-of-the-art methods that report their time-delay, which is a limitation of our method, see for example [28] 4,08 sec, [46] 3.4 sec, [47] 4.5 sec, or [48] 7.2 sec.
Perspective for future work includes an extensive evaluation of the proposed methodology, as well as performing compa-risons with other detection methods from the state-of-the-art and brain activity source location. Although this method is not instant for seizure detection as the LLE computation is quite a time consuming, further studies could be made to quantify the variation of the LLE in the different brain states throughout all brain rhythms. This new information may have the potential to correlate with different characteristics of the seizure event and eventually provide new insights to evaluate epileptic treatments.
ACKNOWLEDGEMENTS
Part of the work was conducted when AQR kept a Ph.D. at Buenos Aires Institute of Technology (ITBA).
REFERENCES
[1] R. S. Fisher, C. Acevedo, A. Arzimanoglou, A. Bogacz, J. H. Cross, C. E. Elger, J. E. Jr., L. Forsgren, J. A. French, M. Glynn, D. C. Hesdorffer, B. Lee, G. W. Mathern, S. L. Moshe, E. Perucca, I. E. Scheffer, T. Tomson, M. Watanabe, and S. Wiebe, “ILAE official report: A practical clinical definition of epilepsy,” Epilepsy, vol. 55, no. 4, pp. 475–482, 2014.
[2] World Health Organization. Mental Health Action Plan (WHO) 2013-2020. Accessed: 2019-04-08. [Online]. Available: http://apps.who.int/ iris/bitstream/10665/89966/1/9789241506021 eng.pdf
[3] D. Jaeger and R. Jung, Encyclopedia of Computational Neuroscience. Springer-Verlag New York Inc, 2015.
[4] J. J. Newson and T. C. Thiagarajan, “EEG frequency bands in psychiatric disorders: A review of resting state studies,” Frontiers in Human Neuroscience, vol. 12, p. 521, 2019.
[5] M. F. Bear, B. Connors, and M. Paradiso, Neuroscience Exploring the Brain. Lippincott Williams and Wilkins, 2015.
[6] I. Osorio, H. P. Zaveri, M. G. Frei, and S. Arthurs, EPILEPSY, The Intersection of Neurosciences, Biology, Mathematics, Engineering, and Physics. CRC Press, 2011.
[7] T. Adali, M. Anderson, and G. S. Fu, “Diversity in independent com-ponent and vector analyses: Identifiability, algorithms, and applications in medical imaging,” IEEE Signal Processing Magazine, vol. 31, no. 3, pp. 18–33, 2014.
[8] D. Maziero, M. Sturzbecher, T. Velasco, C. Rondinoni, A. Castellanos, D. Carmichael, and C. Salmon, “A comparison of independent compo-nent analysis (ICA) of fMRI and electrical source imaging (ESI) in focal epilepsy reveals misclassification using a classifier,” Brain Topography, vol. 28, no. 6, pp. 813–831, 2015.
[9] R. Abreu, M. Leite, A. Leal, and P. Figueiredo, “Objective selection of epilepsy-related independent components from EEG data,” Journal of Neuroscience Methods, vol. 258, no. 67-78, pp. 1–8, 2016.
[10] H. Becker, L. Albera, P. Comon, A. Kachenoura, and I. Merlet, “A pe-nalized semialgebraic deflation ICA algorithm for the efficient extraction of interictal epileptic signals,” IEEE Journal of Biomedical and Health Informatics, vol. 21, no. 1, pp. 94–104, 2017.
[11] O. A. Rosso and M. L. Mairal, “Characterization of time dynamical evolution of electroencephalographic epileptic records,” Physica A, vol. 312, pp. 469–504, 2002.
[12] H. Adeli, S. Ghosh-Dastidar, and N. Dadmehr, “A wavelet-chaos methodology for analysis of EEG’s and EEG subbands to detect seizure and epilepsy,” IEEE Transactions on Biomedical Engineering, vol. 54, no. 2, pp. 205–211, 2007.
[13] T. Khoa, N. Huong, and W. Toi, “Detecting epileptic seizure from scalp EEG using Lyapunov spectrum,” Computational and Mathematical Methods Medicine, vol. 2021, no. 847686, 2012.
[14] F. Shayegh, S. Sadri, R. Amirfattahi, and K. Ansari-Asl, “A model-based method for computation of correlation dimension, Lyapunov exponents and synchronization from depth-EEG signals,” Computer Methods and Programs in Biomedicine, vol. 113, pp. 323–337, 2014.
[15] V. Venkataraman, I. Vlachos, A. Faith, B. Krishnan, K. Tsakalis, D. Treiman, and L. Iasemidis, “Brain dynamics based automated epilep-tic seizure detection,” Annual International Conference of the IEEE Engineering in Medicine and Biology Society, pp. 946–949, 2014. [16] G. Valenza, A. Romigi, L. Citi, F. Placidi, F. Izzi, M. Albanese,
E. Scilingo, M. Marciani, A. Duggento, M. Guerrisi, N. Toschi, and R. Barbieri, “Predicting seizures in untreated temporal lobe epilepsy using point-process nonlinear models of heartbeat dynamics,” Annual International Conference of the IEEE Engineering in Medicine and Biology Society, pp. 985–988, 2016.
[17] M. Alfaro-Ponce, A. Arguelles, and I. Chairez, “Pattern recognition for electroencephalographic signals based on continuous neural networks,” Neural Networks, vol. 79, pp. 88–96, 2016.
[18] A. Aarabi and B. He, “Seizure prediction in patients with focal hippo-campal epilepsy,” Clinical Neurophysiology, vol. 128, no. 7, pp. 1299– 1307, 2017.
[19] J. Jacob, A. Cherian, K. Gopakumar, T. Iype, D. Yohannan, and K. Di-vya, “Can chaotic analysis of electroencephalogram aid the diagnosis of encephalopathy?” Neurology Research International, no. 8192820, pp. 1–8, 2018.
[20] C. M. Bishop, Pattern Recognition and Machine Learning. Springer-Verlag New York, 2006.
[21] D. W. Hosmer, S. Lemeshow, and R. X. Sturdivant, Applied Logistic Regression. Wiley, 2013.
[22] A. Alkan, E. Koklukaya, and A. Subasi, “Automatic seizure detection in EEG using logistic regression and artificial neural network,” Journal of Neuroscience Methods, vol. 148, pp. 167–176, 2005.
[23] A. Subasi, A. Alkana, E. Koklukayab, and M. K. Kiymik, “Analysis of epileptic seizure. detection methods based on parameter estimation, power spectrum density and Morlet wavelet transform,” Neural Net-works, vol. 18, pp. 985–997, 2005.
[24] A. Sansevere, K. Kapur, J. Peters, I. Fern´andez, T. Loddenkemper, and J. Soul, “Seizure prediction models in the neonatal intensive care unit,” Journal of Clinical Neurophysiology, 2019.
[25] B. Chen, H. Choi, L. Hirsch, A. Katz, A. Legge, R. Buchsbaum, and K. Detyniecki, “Psychiatric and behavioral side effects of antiepileptic drugs in adults with epilepsy,” Epilepsy and Behavior, vol. 76, pp. 24– 31, 2017.
[26] K. Hampel, R. Thijs, C. Elger, and R. Surges, “Recurrence risk of ictal asystole in epilepsy,” Neurology, vol. 89, no. 8, pp. 785–791, 2017. [27] A. Quintero-Rinc´on, J. Prendes, M. Pereyra, H. Batatia, and M. Risk,
“Multivariate bayesian classification of epilepsy EEG signals,” 2016 IEEE 12th Image, Video, and Multidimensional Signal Processing Work-shop (IVMSP), pp. 1–5, 2016.
[28] A. Quintero-Rinc´on, M. Pereyra, C. D’Giano, M. Risk, and H. Batatia, “Fast statistical model-based classification of epileptic EEG signals,” Biocybernetics and Biomedical Engineering, vol. 38, no. 4, pp. 877– 889, 2018.
[29] J. F. Cardoso and A. Souloumiac, “Blind beamforming for non-gaussian signals,” IEE Proceedings F - Radar and Signal Processing, vol. 6, no. 140, pp. 362–370, 1993.
[30] J. Karhunen, E. Oja, and A. Hyvarinen, Independent Component Ana-lysis. John Wiley and Sons Press, 2001.
[31] J. V. Stone, Independent Component Analysis: A Tutorial Introduction. The MIT Press, 2004.
[32] P. Comon and C. Jutten, Handbook of Blind Source Separation -Independent Component Analysis and Applications. Academic Press, 2010.
[33] G. Strang, Introduction to Linear Algebra. Wellesley-Cambridge Press, 2016.
[34] A. Quintero-Rinc´on, M. Pereyra, C. D’Giano, H. Batatia, and M. Risk, “A new algorithm for epilepsy seizure onset detection and spread estimation from EEG signals,” Journal of Physics: Conference Series, vol. 705, no. 1, p. 012032, 2016. [Online]. Available: http://stacks.iop.org/1742-6596/705/i=1/a=012032
[35] L. D. Iasemidis and J. C. Sackellares, “Chaos theory and epilepsy,” Neuroscientist, vol. 2, pp. 118–126, 1996.
[36] H. Kantz and T. Schreiber, Nonlinear Time Series Analysis. Cambridge University Press, 2004.
[37] J. L. Semmlow and B. Griffel, Biosignal and Medical Image Processing, 1st ed. CRC Press, 2014.
[38] M. T. Rosenstein, J. J. Collins, and C. D. Luca, “A practical method for calculating largest Lyapunov exponents from small data set,” Physica D: Nonlinear Phenomena, vol. 65, no. 1-2, pp. 117–134, 1993. [39] A. Wolf, J. B. Swift, H. L. Swinney, and J. A. Vastano, “Determining
Lyapunov exponents from a time series,” Physica D: Nonlinear Phe-nomena, vol. 16, no. 3, pp. 285–317, 1985.
[40] C. Diks, Nonlinear Time Series Analysis, Methods And Applications. World Scientific Publishing Co., 1999.
[41] A. Shoeb, H. Edwards, J. Connolly, B. Bourgeois, S. T. Treves, and J. Guttagf, “Patient-specific seizure onset detection,” Epilepsy and Behavior, vol. 5, pp. 483–498, 2004.
[42] A. Goldberger, L. Amaral, L. Glass, J. Hausdorff, P. Ivanov, R. Mark, J. Mietus, G. Moody, C.-K. Peng, and H. Stanley, “Physiobank, phys-iotoolkit, and physionet: Components of a new research resource for complex physiologic signals,” Circulation, vol. 101, no. 23, pp. e215– e220, 2000.
[43] A. Quintero-Rinc´on, C. D’Giano, and H. Batatia, “A quadratic linear-parabolic model-based classification to detect epileptic electroencephalo-gram (EEG) seizures,” Journal of Biomedical Research, (In press), 2019. [44] A. Fern´andez, S. Garc´ıa, M. Galar, R. Prati, B. Krawczyk, and F. He-rrera, Learning from Imbalanced Data Sets. Springer International Publishing, 2018.
[45] S. Vluymans, Dealing with Imbalanced and Weakly Labelled Data in Machine Learning using Fuzzy and Rough Set Methods. Springer International Publishing, 2019.
[46] D. Bhati, R. B. Pachori, and V. M. Gadre, “A novel approach for time-frequency localization of scaling functions and design of three-band biorthogonal linear phase wavelet filter banks,” Digital Signal Processing, vol. 69, pp. 309–322, 2017.
[47] S. Nasehi and H. Pourghassem, “A novel fast epileptic seizure onset detection algorithm using general tensor discriminant analysis,” Journal of Clinical Neurophysiology, vol. 30, no. 4, pp. 362–370, 2013. [48] R. B Pachori and V. Bajaj, “Analysis of normal and epileptic seizure
EEG signals using empirical mode decomposition,” Computer Methods and Programs in Biomedicine, vol. 104, no. 3, pp. 373–381, 2011.
Antonio Quintero-Rinc´on is postdoctoral fellow research at Fundaci´on contra las Enfermedades Neu-rol´ogicas Infantiles (FLENI). He was a research professor and head researcher at CITeS laboratory (Innovation Center for Health Technologies) at In-stituto Tecnol´ogico de Buenos Aires (ITBA) from the Bioengineering Department for 13 years. He received his MSc from the National University of La Plata (UNLP) in 2015 and a Ph.D. in engineering from ITBA in 2019. His research interests include issues related to EEG signal processing, pattern recognition, neuroscience, machine learning, and music cognition.
M´aximo Flugelman is an advanced Bioengineering student at ITBA and junior researcher at CITeS labo-ratory (Innovation Center for Health Technologies) from the Bioengineering Department. He is currently doing his thesis developing a software to estimate cardiac output non invasively by using volumetric capnography signals.
Jorge Prendes was born in Santa Fe, Argentina, in 1987. He received the 5 years Eng. degree in electrical engineering with honours from the Buenos Aires Institute of Technology (ITBA), Buenos Aires, Argentina in 2010. He worked as a research engi-neer in signal processing at ITBA within the Ap-plied Digital Electronics Group (GEDA) until 2012. He obtained his Ph.D. from the Ecole sup´erieure d’´electricit´e (Sup´elec) in 2015. His main research interest include image processing, applied mathe-matics, deep learning and pattern recognition. Carlos D’Giano is graduated as a doctor in the Faculty of Medicine of the UBA with an Honor Diploma. He completed his training in Neurology at the Neurology Service of the J. M. Ramos Mej´ıa Hospital in Buenos Aires. At the end he was ap-pointed as Assistant Physician in the Clinical Neuro-physiology specialty. He is an Assistant Professor of the Faculty of Medicine of the UBA. He completed numerous training courses in the country, in the Cleveland Clinic and in Montreal related to epilepsy. He participated in numerous scientific meetings and has been speaker in several events, including the American Epilepsy Society and president of the Argentine Congress of Neurology. He has scientific papers published in national and foreign journals and has collaborated in chapters of specialty books. He received the Tom´as Insausti Prize awarded by the Argentine Society of Neurosciences in 1997. He is a member of the American Epilepsy Society and is currently a member of the Latin American Com-mission for Epilepsy Surgery of the International League Against Epilepsy (ILAE) and Head of the Comprehensive Epilepsy Programme in Fundaci´on Lucha contra las Enfermedades Neurol´ogicas Infantiles (FLENI)