The June 2013 Alberta Catastrophic Flooding Event: Part 1 – Climatological aspects and hydrometeorological features
A. Q. Liu1, C. Mooney1, K. Szeto2, J. M. Thériault3,
B. Kochtubajda1, R.E. Stewart4, S. Boodoo5, R. Goodson1, Y. Li6, J. Pomeroy6
1Environment and Climate Change Canada, Edmonton, Alberta 2Environment and Climate Change Canada, Toronto, Ontario
3Université du Québec à Montréal, Montreal, Québec 4University of Manitoba, Winnipeg Manitoba
5Environment and Climate Change Canada, King City, Ontario 6University of Saskatchewan, Saskatoon, Saskatchewan
ABSTRACT
In June 2013, excessive rainfall associated with an intense weather system triggered severe flooding in southern Alberta, which became the costliest natural disaster in Canadian history. This article provides an overview of the climatological aspects and large-scale hydrometeorological features associated with the flooding event based upon information from a variety of sources, including satellite data, upper air soundings, surface observations and operational model analyses. The results show that multiple factors combined to create this unusually severe event. The event was characterized by a slow-moving upper level low pressure system west of Alberta, blocked by an upper level ridge, while an associated well-organized surface low pressure system kept southern Alberta, especially the eastern slopes of the Rocky Mountains, in continuous precipitation for up to two days. Results from air parcel trajectory analysis show that a significant amount of the moisture originated from the central Great Plains, transported into Alberta by a southeasterly low level jet. The event was first dominated by significant thunderstorm activity, and then evolved into continuous precipitation supported by the synoptic-scale low pressure system. Both the thunderstorm activity and upslope winds associated with the low pressure system produced large rainfall amounts. A comparison with previous similar events occurring in the same region suggests that the synoptic-scale features associated with the 2013 rainfall event were not particularly intense; however its storm environment was the most convectively unstable. The system also exhibited a relatively high freezing level, which resulted in rain, rather than snow, mainly falling over the still snow-covered mountainous areas. Melting associated with this rain-on-snow scenario likely contributed to downstream flooding. Furthermore, above-normal snowfall in the preceding spring helped to maintain snow in the high-elevation areas, which facilitated the rain-on-snow event.
Keywords: Alberta flooding, climate, hydrometeorological features, synoptic conditions, moisture transport, rain-on-snow.
1. INTRODUCTION
Heavy precipitation in Alberta associated with vigorous weather systems can trigger floods and result in severe socio-economic damage. For example, a catastrophic rain event in June 2002 brought record-breaking rainfall and major flooding to many locations in southern Alberta (Szeto et al., 2011). In June 2005, a series of four storms with similar tracks caused extensive flooding over numerous municipalities in southern Alberta (Ou, 2008; Shook, 2015). The floods claimed four lives, and insurance losses due to property and infrastructure damage were estimated at $400 million.
A historic, widespread flooding event occurred in the Rocky Mountains, foothills and downstream areas of southern Alberta in June 2013. Dozens of communities were flooded, including the downtown region of Calgary, the largest city in Alberta. Over 100,000 people were evacuated. Infrastructure damage was vast and costly. Remarkably, given the significance of this event, only five fatalities were attributed to the flood. This flooding event was Canada’s costliest natural disaster with financial losses and recovery costs estimated at $6 billion (Phillips, 2014; Pomeroy et al., 2015).
Past studies of Alberta rainstorms resulting in major large-scale flooding have illustrated complex interactions between atmosphere, hydrological processes and the Rocky Mountains (Szeto, et al., 2011; Flesch and Reuter, 2012; Pennelly et al., 2014). These storms are typically associated with a deep short-wave trough or an upper cut-off low (COL) pressure system and surface low pressure system development east of the Rockies (Hage, 1961; Reuter and Nguyen, 1993). These floods were mainly due to rainfall in the foothills and front ranges, with precipitation primarily generated east of the central ranges. Some events may include snowmelt and rain-on-snow influences (Pomeroy et al., 2016; Shook, 2015). Brimelow and Reuter (2005) also found that the transport of water vapour to the province occurs in moist warm conveyor belts from distant sources. Recent model
simulations suggest that the Rocky Mountains affect precipitation amounts and duration in the mountains and foothills as a result of orographic lifting (Flesch and Reuter, 2012).
The unique setup of mountains and prairies makes flood processes in Alberta slightly different from those affecting other provinces that have less significant terrain changes (Buttle et al., 2016). It does share some similarities with flood processes in other parts of the world, such as the west central U.S., which is also on the lee side of the Rockies, and central Europe, downstream of the Alps. It is noted that a few months after the 2013 southern Alberta flood, another severe flood, the great Colorado flood, occurred farther to the south, with damages exceeding $2 billion (Gochis et al., 2015; Friedrich et al. 2016). Another flood, with at least 25
fatalities and more than EUR 12 billion damages, hit central Europe in June 2013 (Grams et al., 2014), the same month as the southern Alberta flood. There are some comparisons made later in this paper between these events.
Milrad et al. (2015) studied the 2013 Alberta flooding with a focus on antecedent large-scale atmospheric flow patterns and synoptic-scale dynamic characteristics. Li et al. (2016) employed the Weather Research and Forecast (WRF) model to numerically investigate dynamic features that led to the heavy rainfall triggering the flood in southern Alberta. However, given the enormity of the 2013 event and the need to better understand it to improve the prediction of such events, the objective of this work is to study the hydrometeorological factors that led to the flooding, as well as to provide a climatological view of the storm system.
The following specific questions will be addressed: 1) What were the unique features of the extreme
precipitation and the associated storm system that triggered flooding in southern Alberta? 2) What were the sources of the moisture that supported the extreme precipitation, and how was this moisture transported into
southern Alberta? 3) What were the snow preconditions, and did the rain-on-snow enhance the overall snowmelt process and runoff?
2. STUDY AREA, DATA AND METHODOLOGY 2.1 Overview of the study area
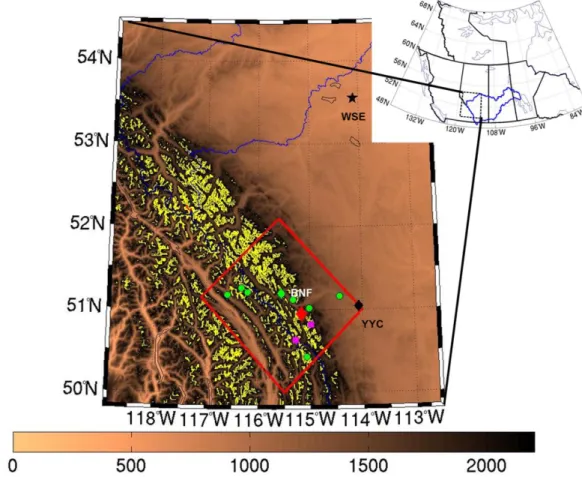
Southern Alberta is located at the intersection of the Rocky Mountains and the northern Great Plains region of North America (Figure 1). The landscape is diverse, bounded by the humid and sub-humid Rocky Mountains and their foothills to the west, and a semi-arid prairie eco-zone extending eastward. This area includes the Bow and Oldman river sub-basins, which are part of the Saskatchewan River Basin. The climate of the region is continental and characterized by short cool summers and cold winters. Monthly average temperatures range from -5 °C to -15 °C in January to around 20 °C in July. Precipitation generally varies from about 300 mm annually over the southeastern area to over 600 mm in the foothills, and can exceed 1000 mm in the mountains. June is typically the wettest month. Snowfall accounts for 30-35% of the annual precipitation, whereas in the mountains about 60% of the annual precipitation falls as snow (Phillips, 1990). Snow cover in the high
mountains lasts until July (DeBeer and Pomeroy, 2010) and there are extensive glaciers at the highest elevations in the central ranges (Demuth and Pietroniro, 2003).
2.2 Data and methodology
A variety of observational and operational model products are utilized in this study. These include satellite observations, upper air soundings, surface weather stations, synoptic analysis, and lightning network information. It also includes gridded model precipitation products and reanalysis data.
2.2.1 Observational and analysis datasets
The operational weather analyses and forecasts produced by Regional Deterministic Prediction System (RDPS) (Mailhot et al., 2006) from Environment and Climate Change Canada (ECCC) were used to examine the
synoptic conditions of the event. As well, a comparison with previous events in southern Alberta was performed using the JRA-55 reanalysis (Kobayashi et al., 2015) and ANUSPLIN 10-km gridded daily precipitation dataset (Hutchinson et al., 2009). Snowpack in the mountains was examined with the ECCC and National Oceanic and Atmospheric Administration (NOAA) snow analyses. ECCC snow analyses are produced by a snow model that combines precipitation accumulation from the operational weather forecast model and snow measurements at various synoptic stations (Brasnett et al., 1999; Brown and Brasnett, 2010). NOAA’s Snow Data Assimilation System (SNODAS) utilizes a snow model driven by a numerical weather prediction model, and is adjusted by remote sensing and surface observations to provide snow estimates (National Operational Hydrologic Remote Sensing Center, 2004).
Satellite observations from the NOAA series of Polar-orbiting Operational Environmental Satellites (POES) and the NOAA Geostationary Operational Environment Satellites (GOES) were used to subjectively examine
surface snow coverage and the evolution of weather systems. Moisture transport was inferred from satellite-derived Total Precipitable Water (TPW) products retrieved from the NOAA Office of Satellite and Product Operations (OSPO) (ftp://www.ospo.noaa.gov/Products/bTPW/index.html). The TPW is created by employing combined data from GOES and POES satellites, as well as GPS data (Kidder and Jones, 2007).
Moisture source attribution was studied using a Lagrangian particle model in which thousands of particles (representing air parcels) are released into a modelled atmospheric flow and followed either forward or backward in time. The model can be used to estimate the moisture uptake over source regions. For example, Stohl and James (2004) used FLEXPART, a Lagrangian particle model in forward mode, to estimate global moisture sources and sinks during one year. Drummond et al. (2008) used the same methodology to identify moisture sources over central Brazil and the La Plata Basin.
This study utilizes the method of Sodemann et al. (2008). A target grid over the precipitation area (the target region) is specified, from which particles are released in backward mode at a time when precipitation in the target region is most significant. Changes in specific humidity (q) are calculated every 6 hours along the trajectory to determine where along the air parcel path moisture was taken up or released. Moisture taken up later (closer to the precipitation area) and intervening precipitation events (drops in q) occurring along the trajectory reduce the weight attached to moisture taken up earlier. It is assumed that if moisture is taken up in the boundary layer, it can be associated with evaporation/evapotranspiration from the surface. If the moisture uptake occurs above the boundary layer, it cannot necessarily be attributed to the surface below, but may be associated with convection, advection or other processes occurring in the mid-atmosphere. The moisture taken up in and outside the boundary layer is tracked separately.
The MLDP0 (Modèle Lagrangien de Dispersion de Particules d’ordre zéro) particle dispersion model developed by the Canadian Meteorological Centre (CMC) (D’Amours et al., 2015) was utilized for this work. The driving meteorological data was provided by the GDPS (Global Deterministic Prediction System) model (Côté et al., 1998a, 1998b). The release (target) grid is set along the Rocky Mountain foothills in southern Alberta. Altogether 80,000 particles, evenly distributed horizontally, were released. In the vertical, particles were released in equal numbers between evenly spaced pressure levels so that the particles represent air parcels of equal mass. The trajectories were calculated backward in time for 168 hours (7 days). This length of time was found sufficient to attribute almost all the precipitation in the target region to either above or below boundary layer moisture uptakes somewhere in the model domain. A particular trajectory in which the value of q decreases (that is, the excess moisture falls as precipitation) in the first 6-h segment after leaving the target region is considered to be a precipitating trajectory, along which moisture uptake calculations are carried out (Sodemann et al., 2008).
3. A CLIMATOLOGICAL VIEW OF THE 19-21 JUNE 2013 PRECIPITATION EVENT 3.1 The significance of precipitation
The heavy precipitation event began on 19 June 2013 and continued for two days, with many stations in
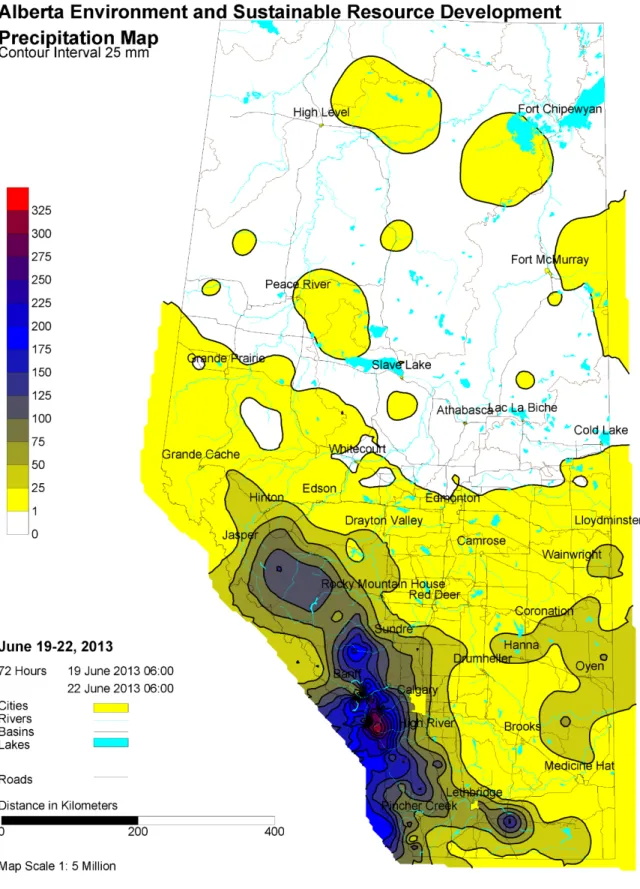
southern Alberta recording substantial (> 100mm) amounts of rain. Furthermore, some snow occurred at higher elevations (Pomeroy et al., 2015). The spatial pattern shown in Figure 2 illustrates several regions of intense precipitation. Over 100 mm of rainfall fell in the area southeast of Jasper; the area extending south of Sundre towards Pincher Creek received more than 200 mm and the station at Burns Creek measured over 300 mm. More detailed analysis of the precipitation features associated with this event can be found in Part 2 of this study (this volume, Kochtubajda et al., 2016).
The observed precipitation and its variability (in both amounts and time) at two long-term stations, Calgary and Banff, are briefly discussed to help put the extreme rain event in climatological perspective. Banff, located in a valley in the mountains, is about 100 km northwest of Calgary, and 500 m higher in elevation. The precipitation
analyses, based upon monthly precipitation from 1960 to 2013, indicate that in Calgary the month with the most precipitation is generally June, but this is not as evident in Banff. The maximum amount of precipitation
recorded during the last 50 years in both Banff and Calgary occurred in June 2005 when more than 200 mm was reported. It is typical that, on average, Banff receives less precipitation than Calgary. For example, the
climatology for the month of June yields 79.8 mm for Calgary and 61.7 mm for Banff. Hence this event
produced more than three times the average June precipitation at Banff and close to the June average at Calgary. In addition, similar to the majority of previous observed extreme rainstorms in the region (Szeto et al., 2016), the event occurred within the month typically receiving the highest precipitation amounts in Calgary and one of the highest in Banff.
3.2 A comparison with similar systems
An overview of long-lived extreme rain events over southern Alberta since 1960 is presented in this section, while systematic analyses and a more detailed description of methodology can be found in Szeto et al. (2016, this volume). The extreme rain events were identified using the ANUSPLIN 10-km gridded daily precipitation dataset (Hutchinson et al., 2009) with the condition that the daily rainfall averaged over southern Alberta and southwestern Saskatchewan (49-53°N, 245-252.5°E; referred to be as the P-area in Table 1) is higher than 12 mm d-1 for at least two days. Only 23 such events, including the 2013 storm, were identified for the period 1960-2013. Various storm characteristics were diagnosed using the 55-yr Japanese global ReAnalysis (JRA-55, Kobayashi et al., 2015). A summary of the inter-comparison of the 2013 system with the ensemble average and extremes of all cases is given in Table 1.
The mean daily rainfall during the 2013 event assessed using ANUSPLIN is 13.6 mm, which is close to the ensemble minimum. On the other hand, the JRA value (22.1 mm) is amongst the highest of all, suggesting that the gauge observations used in ANUSPLIN were probably not able to capture the localized extreme convective rainfall of the 2013 storm, and under-estimated the rain rate of this event. The area with mean ANUSPLIN rainfall > 10 mm d-1 during the two day period is 233x103 km2, which is also somewhat lower than the 302x103 km2 ensemble average.
Szeto et al. (2016) found that all the identified rainstorms were associated with a slow-moving upper level COL that typically tracked near the region close to northwestern U.S. and southern BC during their incipient stage. East of the COL, an accompanying surface low pressure system was often found over the northern central U.S. This is also the synoptic situation characterizing the 2013 case, except that the surface low pressure center was located somewhat west of the ensemble-average low center position. However, it was still situated east of the upper COL, which maintained a westward-tilted vertical structure to facilitate baroclinic growth. The strength of the surface frontal zone (as measured by the horizontal gradients of low level temperature or equivalent potential temperature) was typically weaker than other cases. In addition, both the minimum 500 hPa
geopotential height at the center of the 2013 COL and the lowest surface central pressure were higher than the ensemble average values.
Also similar to many other cases, a broad high pressure area over central and northern Canada was found in the June 2013 storm. This blocked the northward propagation of the surface system and enhanced the low level north-south oriented pressure gradients and, hence, the associated synoptic low level easterly flow towards the foothills. However, the overall low level cyclonic flow was relatively weak. In particular, the maximum meridional wind speeds at 850 hPa and associated northward moisture transport over the central Great Plains were somewhat lower than the ensemble average.
The storm characteristics that separated the 2013 event from the majority of other cases are related to thermal conditions and convective stability. In particular, the storm environment was much warmer than average and was very convectively unstable (i.e., exhibiting the largest convective available potential energy (CAPE) and lowest Lifted Index (LI) of all cases shown in Table 1). In fact, its CAPE value was substantially higher than those estimated for the three other strong convective events that occurred in 1965, 1973 and 1982, and all other cases occurred in more stable and cooler conditions (Szeto et al., 2016). As a result, the June 2013 case had amongst the highest values for both the precipitable water and the ratio of convective to total rainfall. It also has the highest freezing level, which suggests that the precipitation over high-elevation areas was more likely to fall as rain versus snow.
In summary, the synoptic scale features associated with the 2013 rainfall event were not particularly intense when compared to many other cases, but its storm environment was the most convectively unstable. Unlike most previous events, excessive rainfall from both convective and synoptic system, contributed significantly to the flooding. The following sections will discuss the characteristics for the June 2013 case itself, including the evolution of the synoptic patterns, moisture transport, precipitation phase, and pre-existing snow conditions over the mountains. Focused discussions on the fine-scale convective precipitation features are presented in Part 2 of this study.
4. EVOLUTION OF THE WEATHER SYSTEM
The evolution of the antecedent large-scale atmospheric flow pattern about two weeks prior to the onset of the heavy precipitation has been studied by Milrad et al. (2015). They found that a train of Rossby waves across the North Pacific Ocean contributed to the development of a cut-off anticyclone over Alaska, an upper trough off the west Pacific coast, and an associated blocking pattern in the northeastern North Pacific.
During the event, a well-organized surface low pressure system moved into southern Alberta and kept the western part of the region in continuous precipitation for close to two days (00 UTC 20 to 00 UTC 22 June), especially over the eastern slopes of the Rockies. Previous to the heavy precipitation dominated by the synoptic-scale low pressure system, there was also intense convective rainfall associated with thunderstorms, which occurred during the initial stages of the event, roughly from 00 UTC to 06 UTC 20 June. The analyses in this section will focus on the evolution of the synoptic weather system and convective features during the heavy precipitation period.
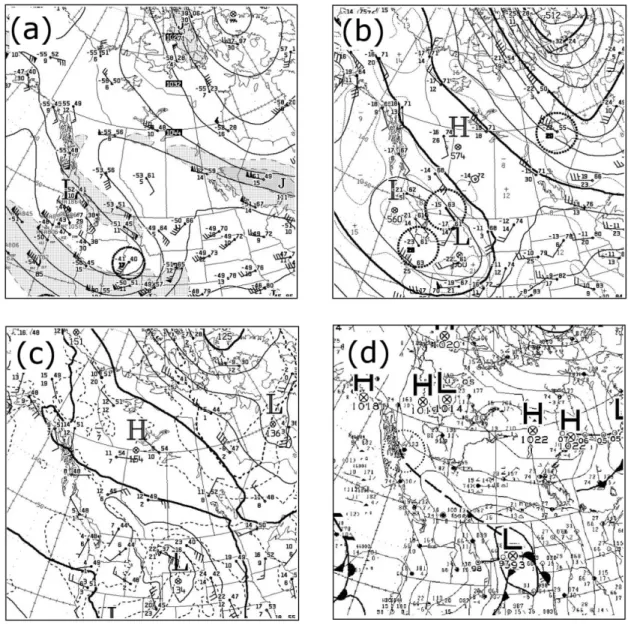
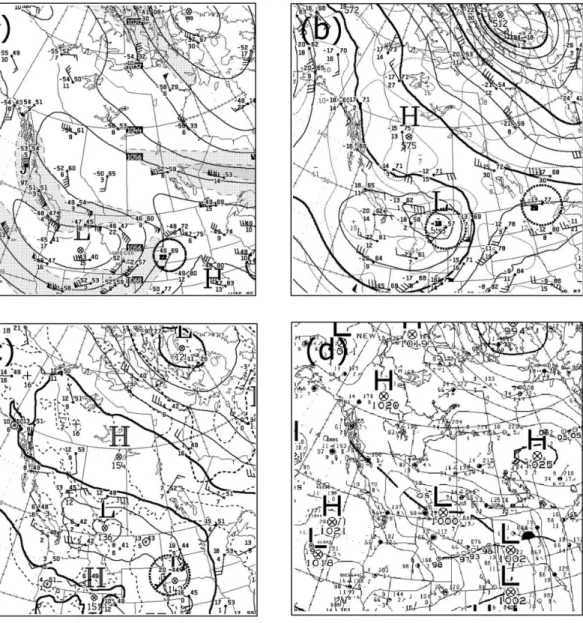
At 00 UTC 20June (Figure 3a) the 250 hPa analysis chart shows a deep negatively-tilted trough along the Pacific coast, stretching northwestward from northern California to southern Alaska with a southeast-northwest oriented upper ridge extending from the central Great Plains towards central Alaska. Between the trough and ridge, a strong southeasterly jet streak was present with maximum wind speeds close to 130 km h-1, as measured by the Kelowna, BC (British Columbia) upper air sounding, and a second northwesterly jet streak upstream of the trough (Figure 3a) was also present. The same deep trough, with a closed circulation at its base, can also be seen in the 500 hPa chart (Figure 3b). This upper circulation enhanced the advection of Pacific Ocean air into the northwestern U.S., and southern BC and Alberta. Southern Alberta was in the right entrance region of a minor jet core at 250 hPA, as well as under strong diffluent flows aloft (Figures 3a and 3b), and these factors tend to promote lift and are favourable for severe thunderstorm development.
At 850 hPa (Figure 3c) the air was warm and relatively over the northern Great Plains, which was advected northwestward into southern Alberta by a 70 km h-1 jet, which acted to destabalize the lower atmosphere and provided low level moisture to support thunderstorm development. Associated with the upper features was a surface low pressure system centered in eastern Montana, with a weak warm front extending southeastward into the central U.S, a cold front southward into central-western U.S., and a trough extending northeastward into southern Alberta and BC (Figure 3d). The convergence associated with the surface trough, combined with terrain-induced vertical motion due to easterly upslope winds against the mountains, likely acted as the trigger for thunderstorm development over southern Alberta.
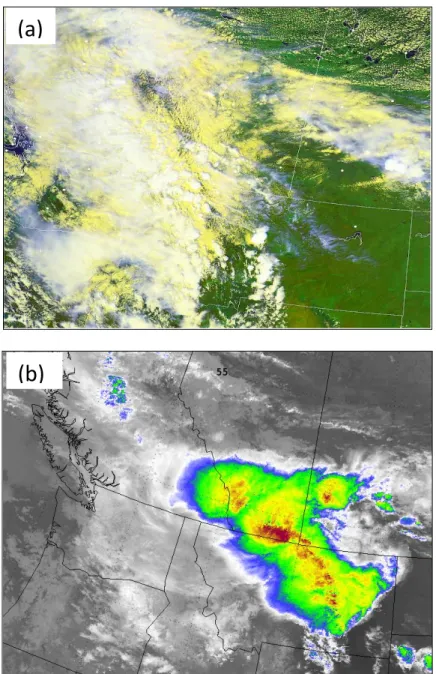
Isolated thunderstorms formed along the foothills of southern Alberta and Montana on the afternoon of 19June, as shown in the satellite image in Figure 4a. Intensive convective anvil-shaped clouds became widespread overnight associated with severe thunderstorms over all of southern Alberta (Figure 4b). More detailed analysis of the heavy rainfall associated with these thunderstorms is given in the Part 2 of this study.
The 250 hPa analysis at 12 UTC 20 June (Figure 5a) shows the upper ridge still in place over the southern Prairies, so that only the southern portion of the upper trough continued to dig eastward, resulting in the jet stream ahead of the trough turning more zonally along the U.S-Canada border. A blocking pattern can be seen at 500 hPa (Figure 5b), with a closed circulation around the upper low over northwestern Montana and a high pressurecenter over extreme northeastern BC. This type of large-scale circulation pattern may have slowed the eastward propagation of the system and maintained the upslope flow on the lee side of the mountains. The jets and diffluent flows ahead of the low in southern Alberta propagated farther eastward into southern
Saskatchewan and Manitoba, weakening the upper level support for severe thunderstorm development over southern Alberta.
At 850 hPa (Figure 5c) the southeasterly low level jet also weakened, and the airflow from the central Great Plains was now advected through southern Saskatchewan and Manitoba before reaching southern Alberta via an easterly low level jet, which allowed warm moist air to continue to be advected against the Rockies. At the surface, a low pressure system formed over southern Alberta (Figure 5d). Although the low pressure system was not particularly intense (central pressure of 1000 hPa at 12 UTC 20 June), the pressure difference between the low and the surface ridge to the northeast was enough to maintain a strong easterly low level flow. The orographic lift associated with these upslope winds, combined with synoptic ascent and abundant moisture, contributed to the significant precipitation. The earlier dominant convective precipitation had, by this time, evolved into widespread synoptic stratiform rainfall. Due to the blocking pattern, the low pressure system was quasi-stationary and the associated rainfall persisted over the next 36 hours, gradually weakening with time. As the southwesterly jet streak continued to push the upper trough northeastward, the ridge over the central Prairies collapsed, resulting in the end of the blocking pattern by 12 UTC 21 June. The low started to move northeastward, and the mid-level moisture transport shifted further eastward. As the surface low continued to propagate away from the lee side of the mountain and gradually fill, both moisture advection and upslope flow diminished, which led to the end of the precipitation by 00 UTC 22 June.
The evolution of the low level atmospheric thermodynamic environment over southern Alberta was characterized by peaks in both area-averaged surface temperature and dew points during the extreme precipitation (Figure 6a). The atmospheric moisture content, as shown in the precipitable water field, also peaked on 00 UTC 20 July when the convective rainfall started (Figure 6b). The hourly lightning data over southern Alberta indicates diurnal convective activity with vigorous thunderstorms occurring on the 19th and
20th (Figure 6c), when surface temperature and moisture, and atmospheric precipitable water over southern Alberta were high.
5. LARGE-SCALE ATMOSPHERIC MOISTURE TRANSPORT
Excessive rainfall requires not only a dynamic weather system, but also abundant moisture. In this section satellite observations and model analyses will be used to examine the large-scale atmospheric moisture transport for this event.
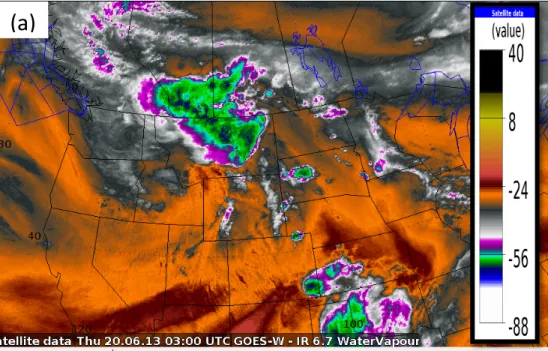
The grey-shades on the 6.7 µm water vapour image at 03 UTC 20 June (Figure 7a) indicate a generally east-west oriented band of mid-level moisture in the southern Prairies being directed against the Rocky Mountains. Well-developed convective clouds over southern Alberta and western Montana are also evidenced by the purple and green shades. Figure 7b illustrates a band of high TPW with values of > 30 mm reaching southern Alberta and Saskatchewan. As shown below, this moisture was advected directly from the central Great Plains. This band was not shown in the water vapor image, which is only sensitive to mid-to-upper level atmospheric moisture, suggesting that the majority of the moisture was located in the lower atmosphere. The moisture axis was also co-located with the low level jet as shown in Figure 3c, which provides more evidence of strong low level transport of moisture into southern Alberta.
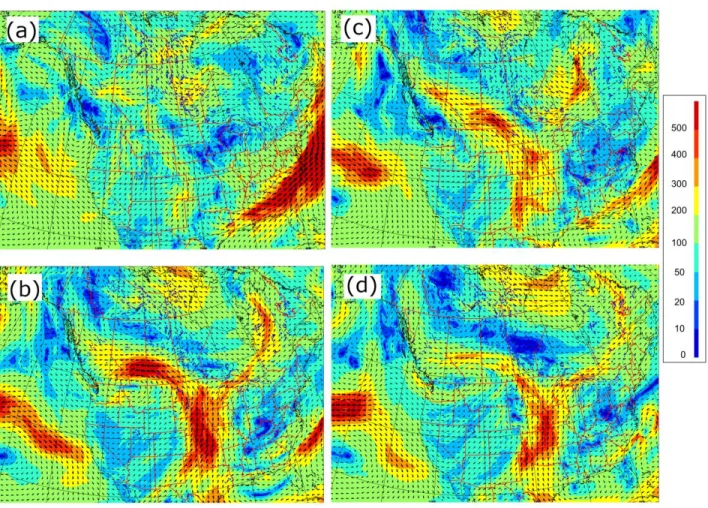
Vertically-integrated moisture fluxes from the RDPS simulation were also employed to study the source and transport of the moisture (Figure 8). A band of intense moisture flux from the central Great Plains stretching into the southern Canadian Prairies first appeared in the 00 UTC 20 June analysis (Figures 8a and 8b), which coincided with the convective precipitation that occurred from 00 UTC to 06 UTC 20 June. This band became more organized and intense by 12 UTC 20 June, when convective precipitation evolved into stratiform synoptic rainfall, and the surface low formed over southern Alberta (Figures 5d and 8c). Significant moisture flux
convergence was evident over southern Alberta at both times. It was apparent that the Great Plains low level jet had enhanced the transport over central and northern Great Plains between 00 and 12 UTC 20 June. Twelve hours later, the moisture flux weakened and the major moisture path shifted farther eastward (Figure 8d). The model moisture fluxes analyses suggest that the central Great Plains provided a direct moisture feed for this event.
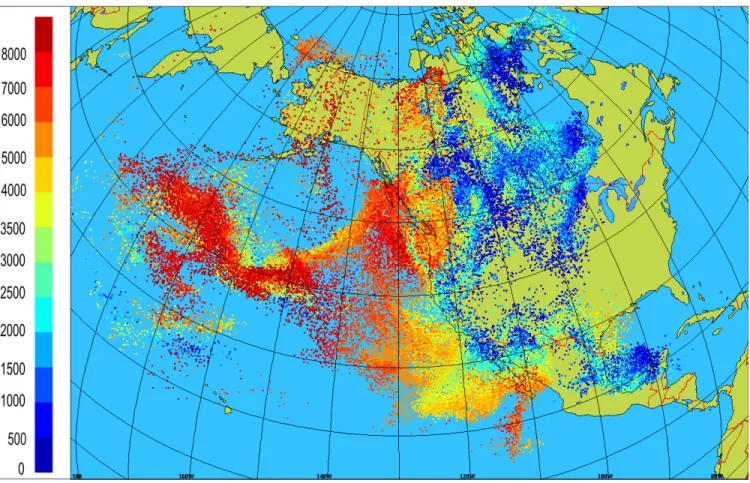
To further investigate the source of the atmospheric moisture, the trajectory method described in Section 2.2 was employed with 80,000 particles released over southern Alberta at 06 UTC 20 June, and the MLDP0 model run 168 hours backward in time. This time was chosen because the most intense precipitation during any 6-h time interval of the event occurred during this period. Figure 9 shows the location of particles 168 hours before they reached the precipitation area. High level particles were primarily advected in from the Pacific, but those in the low levels typically originated from the central Great Plains and the Canadian Prairies.
Figure 10a depicts the regions where the uptake of moisture occurred in the boundary layer. The significant area is over the central Great Plains from the northern U.S. into the southern Canadian Prairies. It is more
complicated to attribute the moisture uptake from above the boundary layer to specific surface locations, because this moisture could be derived from many sources, such as convective vertical transport or advection from other regions. Figure 10b shows that the maxima also occurred along the north-south Great Plains belt, but was less dominant than that from the boundary layer sources. There was also a wide band of moisture directed towards the target area from the Pacific Ocean. The above analysis suggests that evapotranspiration from the central Great Plains played an important role in providing moisture to support the excessive precipitation that
triggered southern Alberta flooding. While not investigated here, the trajectory and satellite moisture patterns suggest that the Great Plains may have initially received some of its moisture from the Gulf of Mexico. 6. SNOWMELT CONTRIBUTIONS
6.1 Snow preconditions
The ECCC seasonal precipitation analysis shows that the preceding winter had below-normal precipitation over the mountainous areas of southern Alberta, and the spring was slightly above-normal. Temperatures during spring snowmelt season were near-normal over southwest Alberta, yet May to mid-June was colder than normal, which kept the snow on the ground to above normal conditions. MODIS satellite imagery (Figures 11a and 11b) indicates the presence of snow (red shades) in the mountainous areas of southern Alberta before and after the flooding event. The CMC snow mass analysis (Brown and Brasnett, 2010) also indicates snow over much of the same area (Figures 11c and 11d). Snow-covered areas were also confirmed by NOAA’s SNODAS high-resolution snow water equivalent analysis (Figures 11e and 11f).
ECCC surface meteorological stations located within the boxed area of Figure 1 observed no snow on the ground during this period. However most of these stations are located in valleys below 2000 m whereas the satellite-observed snow is mainly over locations with elevations above 2200 m (detailed topographical heights are shown in Figure 1). Snow course measurements from two high-elevation AESRD (Alberta Environment and Sustainable Resource Development) stations, Little Elbow Summit and Three Isle Lake (each near 2200 m), reported snow water equivalent values of 428 mm and 483 mm on 1 June , and 12 mm and 62 mm on 1 July respectively, also corroborating the satellite observations and snow analysis.
6.2 Rain-on-snow scheme
The closest rawinsonde station to the areas affected by the most intense precipitation is Stony Plain, which is about 300 km to the northeast (Figure 1). While this is too far away to draw any detailed conclusions, some general comments may be made. The 00 UTC 20 June sounding (not shown) indicates that the atmosphere was close to saturation above the boundary layer to just below 600 hPa, with the freezing level at approximately 3300 m above sea level (ASL), a relatively high value. Stony Plain was under the northern edge of the weather system at this time, so these values could be underestimated for the study area. An aircraft sounding from Calgary near 00 UTC 20 June (not shown) shows the freezing level was about 3850 m ASL (550 m higher than at Stony Plain), indicating that Calgary was located in deep warm air. This sounding also captures the
northeasterly low level jet near the surface, which implies upslope flow into the Rocky Mountain foothills. The sounding analysis suggests that the precipitation more likely fell in the form of rain rather than snow even at higher elevations, which were still snow-covered.
To examine the impact of rain-on-snow on snowmelt and its contribution to runoff, overall snow mass change within the boxed areas in Figure 1 was quantitatively examined by using snow water equivalent data from the SNODAS analysis. Figure 12a reveals a continuous seasonal snow mass decrease as a result of
radiation-induced snowmelt, and does not indicate any unusual snow mass decrease during the flooding period. However, surface observations from Marmot Creek research basin show that some precipitation did fall as snow during the event (Pomeroy et al., 2015). New snow being added into the snow mass balance calculation could result in an underestimated snowmelt rate; therefore, biases could exist in deriving snowmelt from snow mass balances. It is difficult to accurately understand the impact of the rain-on-snow merely based on a simple mass balance calculation over a relatively large spatial and temporal period. This difficulty is highlighted by examining
measurements of snow depth and coverage, which are available from a high-elevation station, Fisera Ridge, located in the Marmot Creek research basin. Figure 12b gives a record of temperature and snow depth at this station during the period 13-26 June. There was, as expected, a general decrease in snow depth due to the seasonal warming, however, this was interrupted with an increase of snow depth on 21 June after the major rainfall when surface temperature dropped to near 0 °C. Snow depth data were missing from 19 to 20June, but it appears there was a significant snow depth decrease during this period.
A comparison of snow coverage and snowmelt rates for two nearby stations (ridge-top and south-facing slope) on Fisera Ridge during this event show significant differences, which suggests that the rain-on-snow scheme could be more complicated in mountainous areas as a result of various thermodynamic factors. The rain-on-snow dynamics, examined by Pomeroy et al. (2016), indicate that the melt rates during the rain-on-rain-on-snow period were lower than during high insolation periods, and that widespread snowfall at the end of the event provided a large snow cover that was subject to rapid melting.
7. DISCUSSION
It has been shown that a unique feature of the heavy precipitation event that triggered severe flooding in southern Alberta was that both convective thunderstorms and the parent synoptic low pressure system
significantly contributed to the heavy rainfall. Detailed precipitation analyses in Part 2 of this study shows that prolonged stratiform rainfall made a major contribution to most northern precipitation areas, such as at Burns Creek, where rainfall amounts exceeded 300 mm, whereas convective rainfall dominated at other locations farther south. Although convective rainfall occurred for only a few hours, the precipitation rates were as high as 50 mm h-1. As addressed in Section 3, the synoptic features in this event were not particularly intense compared to previous similar systems, but had the most convectively unstable environment.
The early-event convection analysis (Figure 6c) suggests diurnal convective activity with vigorous
thunderstorms occurring on the 19 June, the day before the major event. However, the spatial distribution of lightning places these storms mainly in southeast Alberta, far away from the mountains and foothills. As well, rainfall amounts on that day were not significant. The lack of moisture support, as illustrated in Figure 8a, could be one major reason for less rainfall being associated with the thunderstorms on 19 June.
The development of a strong convective environment was assisted in this case by a sustained and uninterrupted transport of warm moist air. Time series analyses of area-averaged surface temperature and dew points over southern Alberta shows that on average southern Alberta became warmer and moister over time before the onset of the precipitation (Figures 6a and 6b).
A conceptual model as described below was used to help understand large-scale hydrometeorological process associated with this event. Before the event, a lee low developed over northwestern U.S. on the east side of the Rockies in response to an upper trough along the Pacific coast. The quasi-stationary low, alongside a high pressure ridge that extended into central northern U.S., facilitated the sustained transport of warm and moist air from the central Great Plains into southern Alberta. The low level 850 hPa southeasterly jet acted in concert with the cyclonic flow of the low to enhance the transport of heat and moisture, which was maximized during the evening and night hours. The strong and sustained upper level heating associated with thunderstorms reduced the low level pressure over southern Alberta and induced a new low pressure center, which together with the diminishing low level jet, weakened the cyclonic southerly flow, and hence cut off the fuel for convection. This initiated the decay of the system and the precipitation became mainly stratiform thereafter.
A similar evolution has occurred in other events. Gochis et al. (2015) found quasi-stationary weather systems due to a blocking pattern helped to set up large-scale flow patterns, which triggered several mesoscale
circulation features in the great Colorado flood. Grams et al. (2014) found that a quasi-stationary COL initiated multiple consecutive low pressure systems travelling along an abnormal track, resulting in a few days of heavy precipitation, which triggered the 2013 central Europe flood. It is common to all three events that the quasi-stationary synoptic system maintained the large-scale circulation during the event, which provided the required heat and moisture fluxes, although the individual weather system that directly produced extreme precipitation could be a single quasi-stationary low pressure system, such as in the Alberta flood, or a few consecutive travelling cyclones, such as in the great Colorado and central European floods.
Moisture analysis using satellite products, model simulated fluxes, and trajectory modelling confirmed that strong evapotranspiration from the central Great Plains provided the moisture that was advected into southern Alberta. Milrad et al. (2015) also found that the air parcels involved in the precipitation mainly originated from the Great Plains. It is also noted that the moisture band corresponds well to the location of the Great Plains low level jet. In the conceptual model of Brimelow and Reuter (2005), this pattern often transports moisture for significant rainfall events into the lower Mackenzie River Basin, which is farther north than the area of interest in this study. Examining station and gridded precipitation observations for the warm season months over and downstream of the Great Plains, DeAngelis et al. (2010) found enhanced precipitation over and downstream of irrigation areas, which supports the moisture transport analysis for this event.
Strong interaction and feedbacks exist between the Great Plains and the atmosphere above. The moisture from the Gulf of Mexico might fall as precipitation as it moves inland and subsequent evaporation can bring the moisture back into the atmosphere. Dirmeyer et al. (2009) found that the Great Plains has significant moisture feedback between atmosphere and land surface throughout most of the year. This event occurred during mid-June when evapotranspiration from crops is high, so it is not surprising that the central Great Plains region would be an important moisture source.
It is also worth noting that the temporal and spatial patterns of evapotranspiration in the Great Plains could vary under future climate change. Previous observational and modelling studies have demonstrated significant evapotranspiration responses to climate changes (Calanca et al., 2006; Cong et al., 2008), and impact to the overall hydrologic cycle (Jung et al., 2010). In general, summer temperatures in the Great Plains could increase as a result of global warming, which may lead to an increase in evapotranspiration, and enhanced moisture fluxes and associated precipitation. Also, changes in land use in the Great Plains could affect evapotranspiration and therefore impact downstream precipitation and flood potentials. Whitfield and Pomeroy (2016) highlighted the importance of considering land use changes and climate changes for flood risk assessment by investigating hydrological regime changes in a mountain headwater basin in southern Alberta.
Gochis et al. (2015) identified that the long-range transport of moisture from the Gulf of Mexico was one of the primary sources for the great Colorado flood, and Grams et al. (2014) argued that continental evaporation provided significant moisture support for the central European flood in June 2013. Among these three extreme flooding events in 2013, evapotranspiration over land played an important role in the Alberta and central European floods in June. Therefore evaporation should be carefully considered for assessing rainfall intensity and flood risks in summer.
Surface and satellite observations, as well as snow reanalysis products show there was snow over high
elevations before the flooding event. High freezing levels enabled a rain-on-snow event, which likely provided additional runoff and contributed to downstream runoff. However the evidence provided here is not definitive,
and measurements from Marmot Creek research basin suggest that the snowmelt evolution can be very different over short distances. Previous studies highlight the sensitivity of snowmelt processes during rain-on-snow events (Singh et al., 1997; Marks et al., 1998). Garvelmann et al. (2014) observed significant spatial variability of energy balance terms during different snowmelt conditions in a mountain environment. More detailed studies (Pomeroy et al., 2016) employing both hydrological modelling and observations from Marmot Creek research basin suggest the snowmelt process during this event was different from classic rain-on-snow floods where the energy from longwave and shortwave radiation, downward sensible and latent heat and from the rainfall
increases the snowmelt rate dramatically. In this event snowmelt in some areas might have slowed down due to reduced solar radiation reaching the snow. The analyses in this study suggest that rain-on-snow did occur and overall it contributed to the flooding, although the use of enhanced observational networks in mountainous areas and high-resolution modelling would improve the understanding of the rain-on-snow process.
8. CONCLUSIONS
Through analysis of data from a variety of sources, including surface hydrometeorological observations, upper air soundings, satellite data, lightning data and operational model analyses, this study has revealed important hydrometeorological features associated with this event which, in combination, contributed to the
unprecedented flooding:
The preceding spring had above-normal precipitation and normal to below-normal temperatures, which helped to maintain snow over higher elevation areas prime the region for a potential rain-on-snow event.
A slow-moving upper COL was blocked by a high pressure ridge. The circulation around an associated surface lee low kept southern Alberta in continuous precipitation for up to two days, especially over the foothills and the eastern slopes of the Rockies.
The majority of the moisture affecting southern Alberta originated with evapotranspiration from the central Great Plains and was advected into the region by a southeasterly low level jet. The precipitation event was first dominated by convective thunderstorms, which evolved into
steady rain associated with the synoptic low pressure system. Strong thunderstorms and persistent upslope winds associated with the synoptic low pressure system produced intense convective and orographic precipitation in southern Alberta.
The relatively high freezing level of the system resulted in rain rather than snow mainly falling over snow-covered high elevation areas. Melting associated with the rain-on-snow likely helped to increase already significant surface runoff.
A comparison with similar weather systems previously over the region suggests that, although the synoptic scale features and overall precipitation associated with the 2013 rainfall event were not particularly intense, its storm environment was the most convectively unstable.
It is evident from this study that multiple hydrometeorological factors combined to create the severe flooding in southern Alberta. It is also noted that there are similarities, but also significant differences, between this event and two extreme flood events that occurred in Colorado and central Europe (also in 2013) with similar
topographic setups. Different combinations of key factors, such as large-scale synoptic systems, moisture sources and transport, snowmelt regime, or evapotranspiration, can all result in devastating floods. Further
studies including enhanced observation networks, especially in mountainous areas, and coupled atmospheric-hydrological simulations would improve the understanding and future forecasting of such extreme events.
ACKNOWLEDGEMENTS
This research is supported by Environment and Climate Change Canada (ECCC) and the Changing Cold Regions Network (CCRN) which is sponsored by the Natural Sciences and Engineering Research Council of Canada (NSERC). The authors thank the anonymous reviewers and Dr. William Quinton for their helpful comments and suggestions. The authors would like to thank Rachel Mintz and Alain Pietroniro of ECCC for reviewing the manuscript. ECCC provided synoptic analysis charts, precipitation and surface snow
observations. The National Oceanic and Atmospheric Administration (NOAA) provided satellite observation and snow reanalysis data. The authors would like to acknowledge Colleen Walford from Alberta Environment and Parks for providing the Alberta snow survey data.
REFERENCES
Brasnett, B. 1999. A global analysis of snow depth for numerical weather prediction. Journal of Applied Meteorology 38: 726-740.
Brimelow J, Reuter GW. 2005. Transport of atmospheric moisture during three extreme rainfall events over the Mackenzie River basin. Journal of Hydrometeorology 6: 413-440.
Brown, RD, Brasnett, B. 2010. Canadian Meteorological Centre (CMC) daily snow depth analysis data. Environment Canada.
Buttle, J.M., Allen, D.M., Caissie, D., Davison, B., Hayashi, M., Peters, D.L., Pomeroy, J.W., Simonovic, S., St-Hilaire, A. and Whitfield, P.H. 2016. Flood processes in Canada, regional and special aspects. Canadian Water Resources Journal 38: 7-30. DOI: 10.1080/07011784.2015.1131629.
Calanca P, Roesch A, Jasper K, Wild M. 2006. Global warming and the summertime evapotranspiration of the Alpine region. Climate Change 79: 65–78.
Cong Z, Yang D, Lei Z. 2008. Did evaporation paradox disappear after the 1980s? A case study for China. Geophysical Research Abstracts. EGU, Munich, Germany.
Côté J, Desmarais JG, Gravel S, Méthot A, Patoine A, Roch M, and Staniforth A. 1998a. The perational CMC– MRB global environmental multiscale (GEM) model. Part II: Results. Monthly Weather Review 126: 1397– 1418. DOI: 10.1175/1520-0493.
Côté J, Gravel S, Méthot A, Patoine A, Roch M, Staniforth A. 1998b. The operational CMC–MRB global environmental multiscale (GEM) model. Part I: Design considerations and formulation. Monthly Weather Review 126: 1373–1395. DOI: 10.1175/1520-0493.
D’Amours R, Malo A, Flesch T, Wilson J, Gauthier JP, Servranckx R. 2015. The Canadian Meteorological Centre’s Atmospheric Transport and Dispersion Modelling Suite. Atmosphere-Ocean 53: 176-199. DOI: 10.1018/07055900.2014.1000260
DeAngelis A, Dominguez F, Fan Y, Robock A, Kustu MD, Robinson D. 2010. Evidence of enhanced
precipitation due to irrigation over the Great Plains of the United States. Journal of Geophysical Research 115: D15. DOI: 10.1029/2010JD013892.
DeBeer, C. M., & Pomeroy, J. W. 2010. Simulation of the snowmelt runoff contributing area in a small alpine basin. Hydrology and Earth System Science 14: 1205-1219 DOI: 10.5194/hess-14-1205-2010.
Demuth, M. N., and Pietroniro A. 2003. The impact of climate change on the glaciers of the Canadian Rocky Mountain eastern slopes and implications for water resource-related adaptation in the Canadian prairies. Phase I -Headwaters of the North Saskatchewan River Basin. GSC Open File 4322.
Dirmeyer PA, Schlosser CA, Brubaker KL. 2009. Precipitation, recycling, and land memory: An integrated analysis. Journal of Hydrometeorology 10: 278-288.
Drumond, A., R. Nieto, L. Gimeno, and T. Ambrizzi, 2008: A Lagrangian identification of major sources of moisture over Central Brazil and La Plata Basin, Journal of Geophysical. Research 113: D14128. DOI: 10.1029/2007JD009547.
Flesch TK, Reuter GW. 2012: WRF model simulation of two Alberta flooding events and the impact of topography. Journal of Hydrometeorology 13: 695-708. DOI: 10.1175/JHM-D-11-035.1.
Friedrich K, Kalina EA, Aikins J, Gochis D, Rasmussen R. 2016. Precipitation and cloud structures of intense rain during the 2013 great Colorado flood. Journal of Hydrometeorology 17: 27-52. DOI: 10.1175/JHM-D-14-0157.1.
Garvelmann J, Pohl S, Weiler M. 2014. Variability of observed energy fluxes during rain-on-snow and clear sky snowmelt in a mid-latitude mountain environment. Journal of Hydrometeorology 15: 1220–1237. DOI: 10.1175/JHM-D-13-0187.1.
Gochis D, and Coauthors. 2015. The great Colorado flood of September 2013. Bulletin of the American Meteorological Society. DOI: 10.1175/BAMS-D-13-00241.1.
Grams, C. M., Binder, H., Pfahl, S., Piaget, N., Wernli, H. 2014. Atmospheric processes triggering the central European floods in June 2013. Natural Hazards and Earth System Science 14: 1691–1702.
Hage KD. 1961. On summer cyclogenesis in the lee of the Rocky Mountains. Bulletin of the American Meteorological Society 42: 20-33.
Hutchinson, M. F., McKenney, D. W., Lawrence, K., Pedlar, J. H., Hopkinson, R. F., Milewska, E., Papadopol, P. 2009. Development and testing of Canada-wide interpolated spatial models of daily minimum-maximum temperature and precipitation for 1961-2003. Journal of Applied Meteorology and Climatology 48: 725-741. DOI: 10.1175/2008JAMC1979.1
Jung M et al. 2010. Recent decline in the global evapotranspiration trend due to limited moisture supply. Nature 467: 951–954.
Kidder SQ, Jones AS. 2007. A blended satellite total precipitable water product for operational forecasting. Journal of Atmospheric and Oceanic Technology 24: 74-81.
Kobayashi S, Ota Y, Harada Y, Ebita A, Moriya M, Onoda H, Onogi K, Kamahori H, Kobayashi C, Endo H, Miyaoka K, Takahashi K. 2015. The JRA-55 reanalysis: General specifications and basic characteristics. Journal of the Meteorological Society of Japan 93: 5-48. DOI:10.2151/jmsj.2015-001.
Kochtubajda B, Stewart RE, Boodoo S, Thériault JM, Li Y, Liu A, Mooney C, Goodson R, , Szeto K. 2016. The June 2013 Alberta catastrophic flooding event: Part 2 – Fine-scale precipitation and associated features. Hydrological Processes. In review.
Li Y, Szeto K, Stewart RE, Thériault JM, Chen L, Kochtubajda B, Liu A, Boodoo S, Goodson, R, Mooney C. 2016. WRF simulation of Calgary and southern Alberta flood of June 2013. Journal of Hydrometeorology.In review.
Mailhot J, Bélair S, Lefaivre L, Bilodeau B, Desgagné M, Girard C, Glazer A, Méthot A, Patoine A, Plante A, Talbot D, Tremblay A, Vaillancourt P, and Zadra A. 2006. The 15-km version of the Canadian regional forecast system. Atmosphere-Ocean 44: 133-149.
Marks D, Kimball J, Tingey D, Link T. 1998. The sensitivity of snowmelt processes to climate conditions and forest cover during rain-on-snow: A case study of the 1996 Pacific Northwest flood. Hydrological Processes 12:1569–1587. DOI: 10.1002/(SICI)1099-085(199808/09)12: 10/11.
Milrad, S. M., Gyakum, J. R., Atallah, E. H. 2015. A meteorological analysis of the 2013 Alberta Flood: Antecedent large-scale flow pattern and synoptic-dynamic characteristics. Monthly Weather Review 143: 2817– 2841. DOI: 10.1175/MWR-D-14-00236.1.
National Operational Hydrologic Remote Sensing Center. 2004. Snow Data Assimilation System
(SNODAS) data products at NSIDC. Boulder, Colorado USA: National Snow and Ice Data Center. DOI: 10.7265/N5TB14TC. Accessed in Feb, 2015.
Ou AA. 2008. Meteorological analysis of four rainstorms that caused severe flooding in Alberta during June 2005. Master Thesis of University of Alberta, Edmonton, Canada.
Pennelly C, Reuter G, Flesch T. 2014. Verification of the WRF model for simulating heavy precipitation in Alberta. Atmospheric Research 135:172-192. DOI: 10.1016/j.atmosres.2013.09.004.
Phillips D. 1990. The climates of Canada. Ottawa, Minister of Supply and Services Canada. Phillips, D. 2014. The top ten weather stories of 2013. CMOS Bulletin 42: 16-24.
Pomeroy J, Stewart RE, Whitfield PH. 2015. The 2013 flood event in the South Saskatchewan and Elk River basins: Causes, assessment and damages. Canadian Water Resources Journal. 1-13.
Pomeroy J, Fang X, Marks DG. 2016. A cold rain-on-snow event in a Canadian Rockies alpine catchment: Characteristics and modelling. Hydrological Processes. In review.
Reuter GW, Nguyen CC. 1993. Organization of cloud and precipitation in an Alberta storm. Atmospheric Research 30: 127-141.
Singh P, Spitzbart G, Hübl H, Weinmeister HW. 1997. Hydrological response of snowpack under rain-on-snow events: A field study. Journal of Hydrology 202:1–20. DOI: 10.1016/S0022-1694(97)00004-8.
Shook K. 2015. The 2005 flood events in the Saskatchewan River Basin: causes, assessment and damages. Canadian Water Resources Journal. DOI: 10.1080/07011784.2014.1001439
Sodemann H, Schwierz C, Wernli H. 2008. Inter-annual variability of Greenland winter precipitation sources: Lagrangian moisture diagnostic and North American Oscillation influence. Journal of Geophysical Research 113: D03107. DOI:10.1029/2007JD008503.
Stohl A, James P. 2004. A Lagrangian analysis of the atmospheric branch of the global water cycle, Part I: Method description, validation, and demonstration for the August 2002 flooding in central Europe. Journal of Hydrometeorology 108: 656-678.
Szeto, K., Henson, W., Stewart, R., & Gascon, G. 2011. The catastrophic June 2002 prairie rainstorm. Atmosphere-Ocean 49: 380-395.
Szeto, K., Evans F and Gysbers P. 2016. Long-lived extreme rainstorms in southern Alberta. Hydrological Processes (submitted).
Whitfield, H. Paul, Pomeroy J. 2016. Changes to the hydrological regime of the Upper Bow River 1 affecting flood peaks: implications for analysis of the 2013 flood. Hydrological Processes (submitted).
Table1. Comparison of storm characteristics between the 2013 rainstorm and 22 similar events occurring between 1960 and 2013.
Parameter 2013 Max Min Average
Mean JRA Precip (mm d-1) over P-area during storm period 22.1 22.6 8.5 15.6
Mean ANUSPLIN Precip (mm/d) over P-area during storm
period 13.6 27.0 12.2 17.4
Freezing Level of Mean T (hPa) over P-area (First Day of
Storm) 600 800 600 677.2
Mean T (K) at 925 hPa over P-area (First Day of Storm) 291.1 292 278 285.4 Mean precipitable water (kg m-2) over P-area (First Day of
Storm) 23.6 24.3 12.8 17.9
Mean soil wetness over southern Prairies during 15 Days
preceding storm 413.7 424.5 289.4 352.7
Minimum sea level pressure (hPa) over 225E-264E,
30N-55N during storm period 996.7 1005.5 978.2 995.9
Longitude (deg E) of Minimum SLP (First Day of Storm) 248.8 256.25 248.8 253.2
Latitude (deg N) of Minimum SLP (First Day of Storm) 46.3 52.5 37.5 45
Difference in Mean SLP (hPa) Between (245E-260E,63N)
and (245E-260E, 45N) (First Day of Storm) 18.6 30.1 -1.5 14.2
Latitude of 500 hPa COL center (deg N) 45 61 43 48.1
Longitude of 500 hPa COL center (deg E) 233 247 226 237.7
Mean 500 hPa Center Height of COL (m) (First Day of
Storm) 5546 5722 5361 5543.5
Maximum 500 hPa wind speed 240-270E, 30-55N 25.6 38.5 19.3 28.1
Mean Zonal Water Vapour Flux (kg m-1s-1) over 252.5E,
50N-55N (First Day of Storm) -177 154.85 -200.9 -91.6
Mean Meridional Water Vapour Flux (kg m-1s-1) over
255E-262.5E, 45N (First Day of Storm) 205.6 375.4 122.2 219.2
Ratio of Mean Convective P to Mean Total P over P-area 0.71 0.71 0.04 0.3 Mean Lifted Index between 925-500 hPa (K) over P-area
(First Day of Storm) -5.6 4.8 -5.7 -0.4
Mean Convective Available Potential Energy (J kg-1) over
P-area (First Day of Storm) 714.9 714.9 -18.67 107.3
Fig. 1 Map of study area: terrain elevation is shaded; areas in yellow have elevations between 2200 m and 3000 m, and in red higher than 3000 m; available ECCC snow depth observation stations are represented by green dots; two AESRD snow course observation sites are marked with magenta squares; the Marmot Creek research basin is marked with a red diamond; and the locations of Calgary and Banff are marked as black and green diamonds and labeled as “YYC” and “BNF” respectively; the Stony Plain upper air sounding site is marked with a black star and labelled as “WSE”; the South Saskatchewan River Basin is outlined with a thick blue line in the regional map inset. The red box indicates the region where area-averaged snow water equivalent was calculated.
Fig. 2 Map of Alberta showing contours of accumulated precipitation (mm) from 06 MDT June 19 to 06 MDT June 22, 2013.
Fig. 3 CMC 250 hPa, 500 hPa, 850 hPa and surface analysis charts at 0000 UTC 20 June 2013. (a) 250 hPa chart: geopotential height (solid lines), jet streaks (shaded), wind barbs and sounding data; (b) 500 hPa chart: geopotential height (solid lines), vorticity (dashed lines), wind barbs and sounding data; (c) 850 hPa chart: geopotential heights (solid lines), isotherms (dashed lines), wind barbs and sounding data; (d) surface chart: mean sea level pressure (solid lines) and surface station observations.
Fig. 4 (a) POES Satellite NOAA-19 image at 20:28 UTC 19 June 2013. The yellow areas depict low clouds, white regions over western Montana and southern Alberta showing Cb tops from developing thunderstorms; (b) POES infrared satellite NOAA-16 image at 03:55 UTC, 20 June 2013, with cloud temperature -40 °C to -70 °C color shaded (warmest colours map to coldest temperatures) to illustrate detailed thunderstorm structures.
(a)
Fig. 6 Time series of (a) RDPS analyzed surface temperatures and dew points; (b) vertically integrated TPW, and TPW with precipitation from RDPS analysis; and (c) observed lightning activity over southern Alberta, averaged over a latitude/longitude rectangle (49.0 to 51.5 N, 110.0 to 114.0 W) for the period 17-22 June.
Fig. 7 (a) GOES water vapour image valid at 03 UTC, 20 June (oC); (b) blended TPW product valid at 04 UTC 20 June.
(a)
Fig. 8 RDPS analyzed vertically integrated moisture flux (kg m s-1) at a) 00 UTC 19 June; b) 00 UTC 20 June; c) 12 UTC 20 June; and d) 00 UTC 21 June.
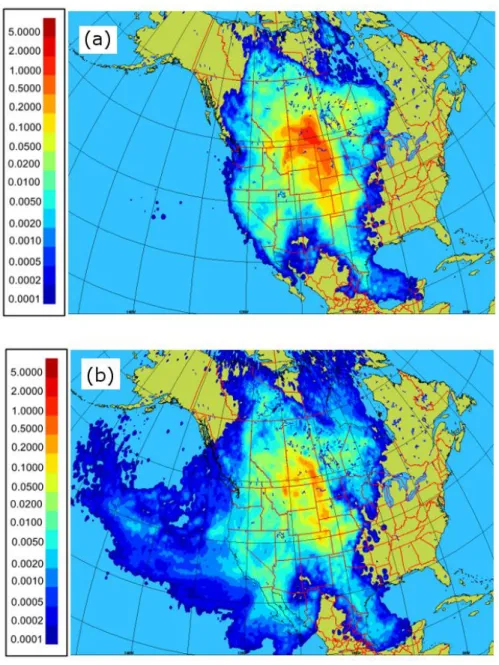
Fig. 10 Moisture sources for precipitation occurring between 06 and 12 UTC 20 June 2013 over the target area: (a) where the source was in the atmospheric boundary layer; and b) where the source was above the boundary layer. Units: mm 6hr-1.
Fig. 11 Snow cover (red color) derived from MODIS Terra satellite data at (a) 1911 UTC 16 June 2013, and (b) 1917 UTC 23 June 2013; snow mass (kg m-2) from CMC snow analyses at (c) 06 UTC 16 June 2013, and (d) 06 UTC 23 June 2013; snow water equivalent (kg m-2) from SNODAS snow reanalysis at (e) 06 UTC 16 June 2013, and (f) 06 UTC 23 June 2013.
Fig. 12 (a) Daily 06 UTC SNODAS snow water equivalent (kg m-2), averaged over the outlined rectangular area as shown in Figure 1, with the red bars corresponding to the period of interest, 16-23 June 2013; (b) Snow depth and temperature measurements at Fisera Ridge in the Marmot Creek research site.