Science Arts & Métiers (SAM)
is an open access repository that collects the work of Arts et Métiers Institute of
Technology researchers and makes it freely available over the web where possible.
This is an author-deposited version published in:
https://sam.ensam.eu
Handle ID: .
http://hdl.handle.net/10985/15075
To cite this version :
AMIN HOSSEINPOOR, Rahim Ali ABBASPOUR, Christophe CLARAMUNT - A Dempster-Shafer
based approach to the detection of trajectory stop points - Computers, Environment and Urban
Systems - Vol. 70, p.189-196 - 2018
Any correspondence concerning this service should be sent to the repository
Administrator :
archiveouverte@ensam.eu
Computers, Environment and Urban Systems
A Dempster-Shafer based approach to the detection of trajectory stop points
Amin Hosseinpoor Milaghardan
a, Rahim Ali Abbaspour
a,⁎, Christophe Claramunt
baSchool of Surveying and Geospatial Engineering, College of Engineering, University of Tehran, North Kargar Street, After Ale-ahmad Junction, Tehran, Iran bNaval Academy Research Institute Lanveoc-Poulmic, BP 600, 29240 Brest Naval, France
A R T I C L E I N F O Keywords: Trajectory Stop points Uncertainty Theory of evidence Belief function A B S T R A C T
Nowadays, location-based data collected by GPS-equipped devices such as smartphones and cars are often stored as spatio-temporal sequences of points denoted as trajectories. The analysis of the large generated trajectory databases such as the detection of patterns, outliers, and stops has a great importance for many application domains. Over the past few years, several successful trajectory data infrastructures have been progressively developed for a large range of applications in both the terrestrial and maritime environments. However, it still appears that amongst many research issues to consider, the resulting uncertainties when analyzing local tra-jectory properties have not been completely taken into account. In particular, determining for instance certainty rates, while detecting stop points, might have valuable impacts on most cases. The framework developed in this paper introduces an approach based on the Dempster-Shafer theory of evidence, and whose objective is to detect trajectory stop points and associated degrees of uncertainty. The approach is experimented using a large urban trajectory database and is compared to several computational algorithms introduced in previous studies. The results show that our approach reduces uncertainty values when detecting trajectory stop points as well as a significant improvement of the recall and precision values.
1. Introduction
Nowadays, the worldwide availability of GPS-equipped devices generates a massive volume of trajectory datasets (Gong, Liu, Wu, & Liu, 2016;Lipan & Groza, 2010). The search for appropriate data re-presentations and analysis of these large trajectory databases is of a great importance for many application domains such as urban trans-portation monitoring and traffic control, maritime navigation, and an-imal behavioral studies. Amongst many directions still to explore, ex-traction of regular and irregular movement patterns of human beings in an urban network is one amongst many significant examples. In fact, the extraction of such trajectory patterns can be useful for solving many urban planning and management issues.
To date, many attempts have been made for collecting trajectory data and different methods have been proposed to represent and ma-nipulate them within specialized data infrastructures (Ashbrook & Starner, 2003; Cao, Mamoulis, & Cheung, 2005; Dodge, Weibel, & Laube, 2011;Zhao, Qin, Ye, Wang, & Chen, 2016). Considered as a whole, a trajectory can be defined as a set of points with spatial, se-mantic, and temporal properties, and where per each point the spatial location and time of its measurement are recorded, although the re-sulting precision depends greatly upon the equipment accuracy and the sampling interval (Mao, Ji, & Liu, 2016;Puertas, Fernández, de la Luz
Morales-Botello, & Aliane, 2013). Such stops can be directly associated to street locations or more specific places such as shopping centers, restaurants, sport centers, and many other entities depending on the application semantics.
Current methods developed so far can be categorized as geometric and semantic approaches. Geometric methods are mostly based on the underlying geometry of the represented trajectories, that is, a sequence of time-stamped points while a second category of approaches rather combines raw data with geographical data in which available semantic data are correlated with potential stop points (Alvares et al., 2007;Cao, Mamoulis, & Cheung, 2007; Cao, Cong, & Jensen, 2010; Yan, Chakraborty, Parent, Spaccapietra, & Aberer, 2013). Indeed, such geometric and temporal data are crucial for an analysis of trajectory paths, but there is still a need to integrate additional semantics in order for instance to take into account human beings' activities (Widhalm, Yang, Ulm, Athavale, & González, 2015). Overall, such analysis can be also closely related to the concept of space-time path as introduced by the theory of Time Geography where human trajectories are considered as combinations of dynamic (i.e., travel) and static (i.e., activity) properties (Hägerstraand, 1970;Zheni, Frihida, Claramunt, & Ghezala, 2015).
Over the past few years, several successful trajectory data models, algorithms and data infrastructures have been progressively developed
https://doi.org/10.1016/j.compenvurbsys.2018.03.007
⁎Corresponding author.
E-mail address:abaspour@ut.ac.ir(R. Ali Abbaspour).
Please cite this article as: Milaghardan, A.H., Computers, Environment and Urban Systems (2018), https://doi.org/10.1016/j.compenvurbsys.2018.03.007
for the management of big trajectory datasets for a large range of ap-plications in both the terrestrial and maritime environments. However, it still appears that amongst many research issues to consider, the re-sulting uncertainties when analyzing local trajectory properties have not been completely considered. In particular, determining for instance certainty rates, while detecting stop points, might have valuable im-pacts on the regular and irregular patterns that are likely to emerge.
The objective of the research presented in this paper is to evaluate uncertainty rates when detecting trajectory stop points and to in-vestigate the probability of such stop points to arise in a given trajec-tory. Our approach is based on the Dempster-Shafer theory of evidence that has the advantage of both evaluating uncertainties when re-presenting some information, and also providing measures to evaluate the probability for some events to happen. The rest of the paper is or-ganized as follows. Section 2 briefly reviews current related works while Section 3introduces the main principles of the developed ap-proach.Section 4develops some experimental results whileSection 5 draws the conclusions and outlines further work.
2. Related work
Several approaches have been so far applied for detecting trajectory stop points. Afirst category considers raw data. For instance, (Ashbrook & Starner, 2003) identifies stop points as locations where the speed derived from GPS data is null. In another related work, (Krumm & Horvitz, 2006) consider two parameters for detecting stop points, that is, either speeds lower than 2 miles/h or lack of data for more than 5 min. Stop points can be also derived from trajectory derivatives as suggested in (Palma, Bogorny, Kuijpers, & Alvares, 2008). Changes of orientation can be also used to filter potential stop points (Rocha, Times, Oliveira, Alvares, & Bogorny, 2010). Stop points can be further enriched by clustering analysis where potential stop points are gen-eralized as representative locations (Zhou, Frankowski, Ludford, Shekhar, & Terveen, 2004). Metadata can be further associated to search algorithms (Guc, May, Saygin, & Körner, 2008), as well as spe-cific spatial data structures such as Voronoi diagrams (Shang, Xie, Zheng, Liu, & Wen, 2015).
A second category of approaches consider trajectories in relation to points of interest and landmarks, and thus providing additional relevant
Fig. 1. Detecting stop points: methodology.
information to travel paths (Majid, Chen, Mirza, Hussain, & Chen, 2015). A trajectory is not only considered as a set of ordered points from a semantic point of view, but also as a sequence of specific places where a given person has passed through and perform some activities (Lipan & Groza, 2010). Moreover, these specific activities should be defined beforehand by a domain-based ontology and associated to ad-ditional descriptive data (Allahviranloo & Recker, 2015; Bogorny, Renso, Aquino, Lucca Siqueira, & Alvares, 2014). When modeling a trajectory, specific stop points and movements related to a series of activities, human behavior, and activity-based patterns analysis can be developed (Do & Gatica-Perez, 2012;Shen & Cheng, 2016;Wang et al., 2016).
When analyzing related works, it clearly appears that the extraction of stop points often follows some approximations that generate missing points as well as uncertainties. For instance, the clustering-based method developed by (Palma et al., 2008) does not give a complete coverage of potential stop points. The DB-SMoT algorithm suggested by Rocha et al., 2010) is rather oriented to the detection and clustering of change of directions, but it is not specifically oriented to the detection of stop points. In fact, a frequent limitation of current approaches is the intrinsic integration of vague concepts in their definition. For example, considering null speed values of some trajectories does not give a full coverage of potential stop points. (Ashbrook & Starner, 2003;Sadilek & Krumm, 2012). Moreover, most of these approaches do not give a complete evaluation related to theirfindings, being a lack of additional information that will provide a better background to the approach. Overall, and despite the fact that several successful trajectory data in-frastructures have been progressively developed, it still appears that amongst many research issues to consider, the resulting uncertainties when analyzing local trajectory properties have not been completely taken into account. In particular, determining for instance certainty rates, while detecting stop points, might have valuable impacts on the analysis of the patterns that emerge.
3. Modeling approach
Fig. 1 presents the main methodological steps of the proposed modeling approach. Thefirst stage of this framework is the data pre-processing and preparation followed by an initial computation of the trajectory descriptors such as mean velocity as well as additional tem-poral and spatial data. These values are used to determine the mem-bership degrees in the neighborhood and for deriving the Belief and Disbelief values of some candidate stop points. After valuing the thresholds for Belief and Disbelief values, candidate stop points are detected. Therefore, candidate stop points, which do not have sufficient spatial accuracy are removed. In fact, lack of accuracy can be caused by several factors such as weak GPS signals so appropriate preprocessing is necessary and often performed using map-matching methods. However, when these errors exceed some acceptable and predefined limits, complementary methods can be applied for example using a Kalman filter (Zheng, 2015). Geometric patterns can be further studied by taking into account several trajectory parameters such as velocities and locations (Zheng & Zhou, 2011). Noisy data are removed by the ap-plication of a Kalmanfilter by recursively modifying error values.
Our method applies a recursive process to the measurements ob-served over time and predicts the positions that tend to be closer to the true values of the measurements (Grewal & Andrews, 2011;Lin, Xu, Qiu, Wang, & Han, 2016;Parent et al., 2013;Rosales & Sclaroff, 1998; Zheng & Zhou, 2011). After a linear estimation of the candidate stop points, the standard deviation of distance (ϭ) between two consecutive candidate stop points is calculated. Next, the points with a distance higher than 2ϭ from the linear estimated model are detected as noise and removed from the trajectory. The preprocessing step provides several initial trajectory indices such as the mean velocity, mean sam-pling intervals, and mean samsam-pling time. The third step of the frame-work searches for candidate stop points by applying and implementing
a series of principles derived from the Dempster-Shafer theory of evi-dence. Accordingly, fuzzy membership values denote how distance and velocity parameters in the neighbors of candidate stop points can be taken into account. This allows us to derive Belief and Disbelief values in the neighborhood of candidate stop points, the reasons behind this approach are as follows:
•
In most previous studies, stop points are detected by crisp ap-proaches where such points have a null velocity. This is not com-pletely satisfactory for at least two reasons:first of all, positioning data can be relatively imprecise; secondly one might consider very low speeds as possible stop situations. Furthermore, spatial as well as temporal distances to possible stop points in the neighborhood are also considered as valid parameters in such process (temporal and spatial distances are valued as neighbor thresholds). This leads us to introduce a fuzzy approach to detect such stop points, the approach being particularly adapted to this case.•
As we consider multi-modal trajectories, so potentially trajectories with high speed variability, the velocity parameter is considered as a local one that should be studied in the neighborhood of candidate stop points.This approach provides uncertainty values for candidate stop points as well as movement locations. Finally, after assessing uncertainty va-lues for candidate stop points, a thorough difference can be made be-tween true stop points and moving points.
3.1. Dempster-Schafer theory of evidence
The Dempster-Shafer theory of evidence wasfirst introduced by Dempster in 1967 and then was further improved by Shafer in 1976 (Shafer, 1976). This theory is derived from the Bayesian probability theory and its most important feature is the integration of the notion of uncertainty. This theory is based upon the fact that lack of enough data and knowledge concerning a specific hypothesis could not implicate a negative response to the intended hypothesis. Accordingly, the concept of uncertainty is modeled and all available evidence from various re-sources for believing or unbelieving the discussed hypothesis is ex-amined and valued. The theory concepts include the notions of Belief, Disbelief, uncertainty and plausibility (Mogaji, Lim, & Abdullah, 2015; Ran, Li, Lu, & Li, 2012). Hereafter, the Belief function is considered as a main parameter for evaluating the status of stop points along with the Disbelief function to account the possibility of movement status. All possible hypotheses are presented in a frame of discernment set denoted byθ. Different combination cases of the elements of θ, also the empty set (∅), are given in the power set of θ.
The Dempster-Shafer theory is applied to all trajectory points se-parately. The main hypothesis is the possibility of evaluating the status of candidate stop points. Therefore, the frame of discernment for every candidate stop point is defined as two values: stop and move. Moreover, the neighborhoods of every candidate stop point are considered as further evidence. Likewise the Mass Function or basic probability as-signment m is defined as follows (Shi, 2009):
∑
→ ∅ = = ⊂ m: Ω(θ) [0, 1] m( ) 0 m(A) 1 A Ω(θ) (1)The Eq.(1)is a function of basic probability assignments. The value m(A) is a basic probability assignment for the set A. It represents a level of support for A containing one element inΩ(θ). The Belief Function is defined by Eq. (2) where Bel(A) denotes the sum of the Beliefs which precisely belong to the elements in the set A. The set A is here composed of the neighborhoods of a considered candidate stop point and the Belief of such candidate stop point is calculated using the impact of the
set A.
∑
→ = ⊂ Bel: Ω(θ) [0, 1] Bel(A) m(B) B A (2)The Belief measure represents the Belief that elements (B) belong to A as well as to subsets of A. The Plausibility Function is defined as follows. The concept of plausibility is given by the sum of Belief and Uncertainty of a considered candidate stop point.
∑
→ = ∩ ≠ Pl: Ω(θ) [0, 1] Pl(A) m(B) ϕ B A (3)Pl(A) in Eq.(3)is the sum of all beliefs which are common to the elements of the set A. In order to identify the stop and movement points and also investigating the uncertainty associated with the location of these points, the power set ofθ is defined by Eq. (4) as follows:
= s s
θ { p, }p (4)
where spdenotes the probability of stopping at a point p, whilesp
de-notes the probability of not stopping at a point p.
In fact, one of the main principles of the Dempster-Shafer theory is to integrate the notion of evidence using the measures of Belief and Plausibility and to complement them using a mass function. The velo-cities of the neighbor points and distance of each neighborhood to the considered candidate stop point are used as main evidences when searching for possible stop points. The mass functions of the Belief and Disbelief values are separately derived in the neighborhood of each candidate stop point.
3.2. Stop point detection
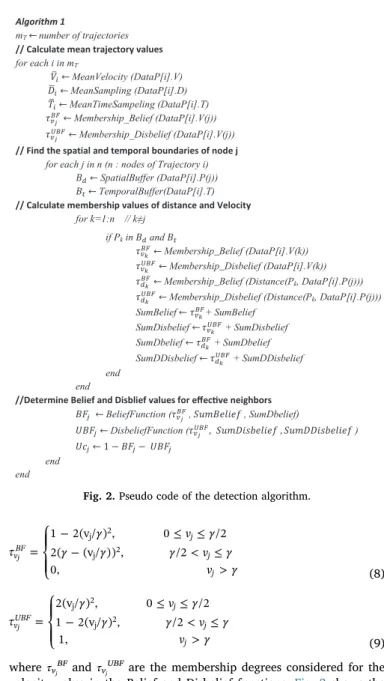
Let us introduce and explain the main parameters of the proposed method.Fig. 2shows the pseudo-code of the algorithm applied for the detection of the stop points in a data set of mTsequences. The execution
of the algorithm is made of the following main steps. First the mean values of velocity, spatial and temporal sampling rates are calculated and used to detect the effective neighbors. Next, by determining the membership values for velocity and distance of the effective neighbors, the measures of Belief and Disbelief are derived.
The algorithm 1 introduced inFig. 2starts by calculating the values of the mean velocity (Vi), mean sampling intervals (Di), and mean time
of measurement (Ti) data per each trajectory using Eqs. (5)–(7). The
results of these equations are used to determine the membership functions at each step, as well as speed and distance parameters in the following step.
∑
=⎛ ⎝ ⎜ ⎞ ⎠ ⎟ = − + − − = − − − Vi v /n,v ( (x x ) (y y ) )/t t j n j j j j j j j j 2 12 12 1 (5)∑
=⎛ ⎝ ⎜ − + − ⎞ ⎠ ⎟ = − − Di (x x ) (y y ) /n j n j j j j 2 12 12 (6)∑
=⎛ ⎝ ⎜ − ⎞ ⎠ ⎟ = − Ti (t t ) /n j n j j 2 1 (7) where vjis the velocity of the jth node from the selected trajectory, n isthe number of trajectory nodes, xjand yjare the coordinates of the jth
node and tj, is the measurement time of the jth node.
The detection of the stop or movement locations for each node of the trajectory is applied as follows. First, per each node of trajectory, theτvj
BF
andτvj UBF
are the velocity membership values of the Belief and Disbelief functions (Ross, 2009), respectively, as shown in Eqs.(8) and (9). The obtained results from these equations are used for the calcu-lation of the Belief and Disbelief values for each node in the trajectory.
= ⎧ ⎨ ⎪ ⎩ ⎪ − ≤ ≤ − < ≤ > τ γ v γ γ γ γ v γ v γ 1 2(v / ) , 0 /2 2( (v / )) , /2 0, vBF j j j j 2 j 2 j (8) = ⎧ ⎨ ⎪ ⎩ ⎪ ≤ ≤ − < ≤ > τ γ v γ γ γ v γ v γ 2(v / ) , 0 /2 1 2(v / ) , /2 1, v UBF j j j j 2 j 2 j (9) whereτvj BF andτvj UBF
are the membership degrees considered for the velocity value in the Belief and Disbelief functions.Fig. 3shows the membership values of the Belief and Disbelief functions in whichγv(the
mean value of velocityVi) is the threshold value for the membership
functions.
When the value for the velocity membership in the Belief and Disbelief functions for the jth node is calculated, there is still a need to detect the effective neighbors around a considered point. Therefore, two kinds of neighbors are defined, and denoted as spatial and temporal neighborhoods. First, the spatial neighborhood is detected. Next, points that are located in the spatial border but have high temporal distances from the considered point should be removed. Accordingly, per each node the spatial and temporal borders are assigned to measure the node congestion. Bdand Btdenote the spatial and temporal borders for the jth
node which are obtained from Eqs. (10) and (11), respectively.
− + − ≤
Bd: (x xj)2 (y yj)2 Di (10)
− ≤ ≤ +
Bt: t 5Ti t t 5Ti (11)
where xjand yjare coordinate specification and t is the measurement
time of the jth node.
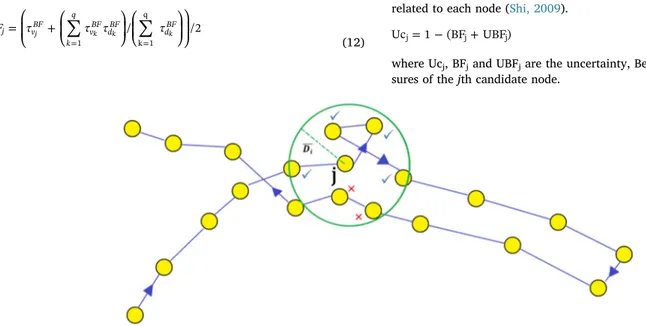
Let us illustrate the principles of our approach applied to the search of effective neighbors. We first consider the existing points in the spatial and temporal neighborhoods of the jth node from the ith trajectory as shown inFig. 4. The ith trajectory is observed, it depicts a back and
Fig. 2. Pseudo code of the detection algorithm.
forth movement over the path. While investigating the neighborhood of the jth point, several nodes corresponding to a backward movement may also fall within this border in addition to the measured points before and after this point. For this purpose, Eqs. (10) and (11) are used for detecting the temporal and spatial borders. Considering these equations, only points assumed as neighbors for the jth node for the calculation of the Belief and Disbelief values which are located within both the temporal and spatial borders of this point are considered. In Fig. 4the neighborhood border for the jth node is shown as a circle, and where the points marked with x are those which are located in the defined spatial neighborhoods, but not the ones in the temporal border that belong to the backward path and that are marked with✓.
Let us further explain the case illustrated by Fig. 4. The points within the neighborhood border of the jth node are identified with the constraint that they are also within the temporal and spatial borders. Then, withγd(Di) considered as the mean distance value, the Belief and
Disbelief values (τdj BF
andτdj UBF
) are derived using Eq. (8). Next the Belief and Disbelief functions for the jth node are derived from Eqs. (12) and (13), considering the membership degrees of distance and velocity obtained from Eq. (8).
∑
∑
=⎛ ⎝ ⎜ + ⎛ ⎝ ⎜ ⎞ ⎠ ⎟ ⎛ ⎝ ⎜ ⎞ ⎠ ⎟ ⎞ ⎠ ⎟ = = BFj τvBF τ τ / τ /2 k q vBF dBF dBF 1 k 1 q j k k k (12)∑
∑
=⎛ ⎝ ⎜ + ⎛ ⎝ ⎜ ⎞ ⎠ ⎟⎛ ⎝ ⎜ ⎞ ⎠ ⎟ ⎞ ⎠ ⎟ = = UBFj τvUBF τ τ / τ /2 k qvUBF dUBF dUBF
1 k 1
q
j k k k
(13) where q is the number of existing nodes in the spatial and temporal borders of the jth node,τdk
BF
andτdk UBF
are the membership degrees obtained for the distance of the kth node from the neighboring nodes to the jth node for the Belief and disbelief functions,τvk
BFandτ
vk
UBFare the
membership degrees of the kth node velocity from the neighboring nodes for the Belief and Disbelief functions andfinally τvj
BFandτ
vj
UBFare
the membership degrees of the jth node velocity for the Belief and Disbelief functions.
Although a successful identified stop point is likely to have addi-tional points in its neighbor this doesn't mean that these points will be necessary candidate stop points. Overall, the representative stop points of a given cluster of stop points will be the ones with maximum Belief and minimum Unbelief values as given by Eqs. (12) and (13). Another parameter of the Dempster-Shafer theory is the uncertainty value that is applied to the detection of movement points. This parameter is calcu-lated from the difference between the sum of the Belief and Disbelief values and the total probabilities. Eq. (14) denotes the uncertainty as related to each node (Shi, 2009).
= − +
Ucj 1 (BFj UBF)j (14)
where Ucj, BFjand UBFjare the uncertainty, Belief and Disbelief
mea-sures of the jth candidate node.
Fig. 3. Membership functions considered for the Belief (a) and Disbelief (b) functions.
4. Implementation and experiments
Our modeling framework has been applied to the detection of the stop points extracted from a large dataset of trajectories denoting in-dividuals' activities.Fig. 5shows the sample of trajectories used in this research. These trajectories are derived from the Geolife project during the years 2007–2012, which have been recorded by taxi GPS-based displacements in the city of Beijing in China (Zheng, Zhang, Xie, & Ma, 2009). For the purpose of our experimental validation, we selected 326 trajectories which include activities like walking, or displacements using bicycles, taxis, or buses. After performing the preprocessing and removal of outliers, the number of identified points in the total studied trajectories gives 83,412 points, while the total traveled distance is 672.195 km. The shortest trajectory covers a distance of 8.54 m, longest 14.408 km and the mean trajectory length 2.417 km. The mean sam-pling distance interval is 10.2 m and the mean samsam-pling time duration is 5.11 s.
Our approach and algorithm should be applied to each node of a given trajectory. The algorithm 1 is applied as follows. First, the mean velocity, mean sampling interval, and mean sampling time values for each trajectory are calculated. Next the spatial and temporal borders of each node are generated and the effective neighbor nodes are detected. In the next stage, the membership values of velocity and distance needed for the Belief and Disbelief functions are calculated for each candidate neighborhood point.
Next, the effective neighbors of a candidate stop point are identified
as an evidence to determine the status of that point. This increases the confidence level of that candidate stop point. In fact considering the imprecise velocity of that candidate point is not sufficient enough and likely to generate high uncertainty. For example, when considering the null velocity value as a rule for detecting stop points, a node with a velocity of 0.275 m/s is likely to be identified as a movement point but this encompasses high uncertainty. In fact, when considering effective neighbors as evidences, our method delivers much less uncertainty while identifying the status of each node. Although a successful iden-tified stop point is likely to have additional points in its direct neighbor this doesn't mean that these points will be necessary candidate stop points. Overall, the representative points of a cluster will be the ones with maximum Belief and minimum Unbelief as suggested by Eqs. (12) and (13). An important issue while detecting stop points is to define appropriate thresholds for the uncertainty and Belief values associated to each candidate stop point. This is the main motivation behind the membership functions as defined for Belief and Unbelief. For instance, when considering high speed values, low speed values should have Belief value close to the unit. Similarly, trajectories with low speed values will give lower Belief values. This emphasizes the role of the thresholds in the detection mechanisms.
4.1. Candidate stop point selection
A set of 150 candidate stop points have been manually selected in order to provide a reasonable ground truth data reference. These 150
Fig. 5. Geolife trajectories sample.
points have been identified according to a semantic analysis of the environment and the location of each selected point. For example, stop points identified at road intersections with traffic lights or bus stations for walking-based trajectories are considered as stop point conditions. We retained this data sample in such a way that there is at least one candidate stop point for each of the 326 trajectories, and by also con-sidering the fact that some of the locations of the selected stop points can be common to several trajectories. Belief and Uncertainty values are derived for each candidate stop point and then compared to some predefined threshold according to the travelling modes identified. Stop points are extracted from a range of different activities such as walking, and displacements by bicycle, taxi, or bus. For each of these stop points, the Belief (Eq. (12)), Disbelief (Eq. (13)), and Uncertainty (Eq. (14)) values are derived (Table 1). The minimum value of the Belief function (τBF) and the maximum value of the Uncertainty (τUc) of these 150 stop
points are considered as two main criteria while detecting the stop points and the conditions for being a stop point are as follows: BFj≥ τBF
and Ucj≤ τUc.In other words, a candidate stop point can be considered
as an actual stop node if its corresponding Belief value is greater than the minimum Belief value of the stop point as well as its Uncertainty value is less than the maximum uncertainty value of the known stop points. Considering different parameters of each trajectory data set as mode of travel, spatial and temporal intervals and mean velocity, our method defines the thresholds of Belief and Uncertainty according to the application semantics.
4.2. Method evaluation
Overall, the application of our method to the Geolife sample dataset detected a total of 2826 stop points among the existing nodes of the trajectories sample. The results obtained have been compared with three methods introduced in our related work (Palma et al., 2008), (Rocha et al., 2010) and (Shang et al., 2015). These methods are compared on the basis of a series of parameters such as speed and di-rection change. They arefirst applied to the Geolife dataset of our case study and secondly to the set of 150 preselected points. First, the aforementioned methods are applied to detect stop points to all tra-jectories from the Geolife dataset. Secondly, results are compared to existing approaches using a test data set that includes 150 sample points made of well identified stop and move points, then precision and recall values are derived for the four methods.Table 2summarizes the performance of the 4 methods, as well as the uncertainty values asso-ciated to the candidate stop points as the Disbelief value, that is, con-ditions for minimum Belief value for the stop points and maximum calculated values for the Uncertainty. As shown inTable 2, our method
has successfully detected 2826 stop points with a mean value equal to 0.831 for the stop Belief, showing high precision when detecting these points as compared to the other methods. Likewise, the mean value for Uncertainty in detecting the stop points is 0.148, which, compared to the Belief value is negligible. Also, an important trend of these values is that they present an appropriate confidence when detecting these stop points location, this being an important objective of our research. Whereas the presented method by (Palma et al., 2008) has detected 2131 stop points with a significant mean Uncertainty value equal to 0.351 alongside a mean Belief value of 0.695. Lastly, the presented methods by (Rocha et al., 2010) and (Shang et al., 2015) have detected in total 2298 and 2310 stop points, respectively, with mean uncertainty and Belief values of 0.398, 0.634 for (Rocha et al., 2010) and 0.411, 0.711 for (Shang et al., 2015).
The four methods are also evaluated by considering two additional parameters, that is, the Precision and Recall derived by Eqs.(15) and (16)applied to the a set of sample points including 150 identified stop and move points.
= +
Precision TP/(TP FP) (15)
= +
Recall TP/(TP FN) (16)
where TP denotes the stop points, which are truly detected by our ap-proach, while FP denotes the stop points, which are falsely detected by the proposed approach, and FN denotes the number of stop points not detected by our approach. As seen in Fig. 6, our method gives sig-nificant values of 95.35% and 97.85% for Precision and Recall, ex-hibiting a significant improvement with respect to the other methods, as well as high accuracy of our method when detecting these stop points.
The overall satisfactory precision of the presented results shows the value and impact of the measure of uncertainty when analysis and detecting the location of candidate stop points in a given trajectory. This confidence parameter facilitates the algorithmic and decision process when selecting and identifying the location of these stop points. This provides an important improvement when compared to the aforementioned 3 methods, and many points which have high rates of uncertainty are falsely detected. Overall,Table 2 exhibits significant results, that is, the detected stop points and the mean Belief value. As exhibited by Table 2, the mean Belief value for the stop points as produced by our method is 0.831 which has a great improvement and high confidence with the calculated values of the other methods that are 0.695 (Palma et al., 2008), 0.634 (Rocha et al., 2010),and 0.711 (Shang et al., 2015), respectively. Overall, our method detects stop points with high precision and recalls parameters, along with high mean value of 0.831 and low mean uncertainty of 0.18 for Belief and Uncertainty respectively. This shows that our method detects a max-imum number of true stop points considering high level of confidence. Last, the mean uncertainty value of the stop points as exhibited by our
Table 1
Results obtained from the assessment of the stop points.
Mean value Max. value Min. value
0.864 1 0.733 Belief
0.131 0.203 0 Uncertainty
Table 2
Detecting stop points: four methods comparison.
Mean uncertainty value for detected stop points
Mean belief value for detected stop points Number of detected stop points Method 0.148 0.831 2826 Our method 0.351 0.695 2131 (Palma et al., 2008) 0.398 0.634 2298 (Rocha et al., 2010) 0.411 0.711 2310 (Shang et al., 2015) 0 10 20 30 40 50 60 70 80 90 100
Proposed Method Palma, 2008 Rocha, 2010 Shang, 2015
95.35 78.62 77.11 84.67 97.85 76.36 72.08 81.41 Precision Recall
method provides a great improvement compared to the aforementioned methods.
5. Conclusion
Over the past few years, many studies have been performed to ex-tract candidate stop points from trajectories. However, an important shortcoming observed in these previous works is that the detection of the location of these stop points is not related to any uncertainty value. The research presented in this paper introduces an approach that takes into account the notion of uncertainty when detecting the location of stop or moving points in a given trajectory. Our approach is based on an application of the Dempster-Shafer theory of evidence where for each candidate stop point, the Belief, Disbelief and Uncertainty values are derived, and the movement status of the points (stop or moving) is determined. The results show high precision when detecting stop points as compared to previous approaches. In particular, the experimental evaluations indicate that the mean uncertainty overall associated with the detected stop points, in comparison with similar extracted points by the other methods, is much lower and meanwhile possesses a higher Belief value. This outlines the important role of uncertainty in the re-sults and the efficiency of the Dempster-Shafer theory of evidence when applied to this case. Overall we believe that thefindings illustrated in the experimental section show that not only our algorithms deliver much more candidate stop points, but also with better recall and pre-cision. These results show that our method is likely to deliver much more candidate stop points, and then further insights on the semantics that emerge from a series of trajectories. Thefindings might be of value for many applications oriented to the analysis of trajectory behavior such as urban and maritime trajectories or even studies oriented to the analysis of animal trajectories. Hence, the results of this research should be further implemented and applied to different application contexts where different trajectory scenarios might be evaluated and discussed. As points of interest are potential candidate stop points, these can be considered as new evidences for tracking stop points. Overall additional semantics might be considered as valuable inputs to the search algo-rithms.
References
Allahviranloo, M., & Recker, W. (2015). Mining activity pattern trajectories and allo-cating activities in the network. Transportation, 42(4), 561–579.
Alvares, L. O., Bogorny, V., Kuijpers, B., de Macedo, J. A. F., Moelans, B., & Vaisman, A. (2007). A model for enriching trajectories with semantic geographical information. Proceedings of the 15th annual ACM international symposium on advances in geographic information systems (pp. 22.1–22.8). New-York: ACM Press.
Ashbrook, D., & Starner, T. (2003). Using GPS to learn significant locations and predict movement across multiple users. Personal and Ubiquitous Computing, 7(5), 275–286. Bogorny, V., Renso, C., Aquino, A. R., Lucca Siqueira, F., & Alvares, L. O. (2014).
CONSTAnT– a conceptual data model for semantic trajectories of moving objects. Transactions in GIS, 18(1), 66–88.
Cao, H., Mamoulis, N., & Cheung, D. W. (2005). Mining frequent spatio-temporal se-quential patterns. Proceedings of the 20th international conference on database systems for advanced applications DASFAA. Vol. LNCS 9058. Proceedings of the 20th interna-tional conference on database systems for advanced applications DASFAA (pp. 123–138). Springer.
Cao, H., Mamoulis, N., & Cheung, D. W. (2007). Discovery of periodic patterns in spa-tiotemporal sequences. IEEE Transactions on Knowledge and Data Engineering, 19(4), 453–467.
Cao, X., Cong, G., & Jensen, C. S. (2010). Mining significant semantic locations from GPS data. Proceedings of the VLDB Endowment, 3(1–2), 1009–1020.
Do, T. M. T., & Gatica-Perez, D. (2012). Contextual conditional models for smartphone-based human mobility prediction. Proceedings of the 2012 UbiComp'12 ACM conference on ubiquitous computing (pp. 163–172). ACM Press.
Dodge, S., Weibel, R., & Laube, P. (2011). Trajectory similarity analysis in movement parameter space. Proceedings of GISRUK conference, Plymouth, UK (pp. 270–279).. Gong, L., Liu, X., Wu, L., & Liu, Y. (2016). Inferring trip purposes and uncovering travel
patterns from taxi trajectory data. Cartography and Geographic Information Science, 43(2), 103–114.
Grewal, M. S., & Andrews, M. P. (2011). Kalmanfiltering: Theory and practice with Matlab. Wiley (611p).
Guc, B., May, M., Saygin, Y., & Körner, C. (2008). Semantic annotation of GPS trajec-tories. Proceedings of the 11th AGILE international conference on geographic information science, CD-ROM proceedings.
Hägerstraand, T. (1970). What about people in regional science? Papers in Regional Science, 24(1), 7–24.
Krumm, J., & Horvitz, E. (2006). Predestination: Inferring destinations from partial tra-jectories. Proceedings of the 8th international conference on ubiquitous computing. Vol. LNCS 4206. Proceedings of the 8th international conference on ubiquitous computing (pp. 243–260). Springer.
Lin, K., Xu, Z., Qiu, M., Wang, X., & Han, T. (2016). Noisefiltering, trajectory compression and trajectory segmentation on GPS data. In Proceedings of 11th international con-ference on computer science & education (ICCSE) (pp. 33–52)..
Lipan, F., & Groza, A. (2010). Mining traffic patterns from public transportation GPS data. Proccedings of the IEEE international conference on intelligent computer communication and processing (ICCP) (October 2010).
Majid, A., Chen, L., Mirza, H. T., Hussain, I., & Chen, G. (2015). A system for mining interesting tourist locations and travel sequences from public geo-tagged photos. Data & Knowledge Engineering, 95, 66–86.
Mao, F., Ji, M., & Liu, T. (2016). Mining spatiotemporal patterns of urban dwellers from taxi trajectory data. Frontiers of Earth Science, 10(2), 205–221.
Mogaji, K., Lim, H., & Abdullah, K. (2015). Regional prediction of groundwater potential mapping in a multifaceted geology terrain using GIS-based Dempster–Shafer model. Arabian Journal of Geosciences, 8(5), 3235–3258.
Palma, A. T., Bogorny, V., Kuijpers, B., & Alvares, L. O. (2008). A clustering-based ap-proach for discovering interesting places in trajectories. Proceedings of the 2008 ACM symposium on applied computing, SAC '08 (pp. 863–868). ACM Press.
Parent, C., Spaccapietra, S., Renso, C., Andrienko, G., Andrienko, N., Bogorny, V., & Pelekis, N. (2013). Semantic trajectories modeling and analysis. ACM Computing Surveys (CSUR), 45(4), 42.
Puertas, E., Fernández, J., de la Luz Morales-Botello, M., & Aliane, N. (2013). Detection and visualization of potential traffic hotspots in urban environments. Proceedings of the 13th international conference on ITS telecommunications (ITST) (pp. 85–89).. Ran, Y., Li, X., Lu, L., & Li, Z. (2012). Large-scale land cover mapping with the integration
of multi-source information based on the Dempster–Shafer theory. International Journal of Geographical Information Science, 26(1), 169–191.
Rocha, J. A. M., Times, V. C., Oliveira, G., Alvares, L. O., & Bogorny, V. (2010). DB-SMoT: A direction-based spatio-temporal clustering method. Proceedings of the 5th IEEE in-ternational conference on intelligent systems (pp. 114–119)..
Rosales, R., & Sclaroff, S. (1998). Improved tracking of multiple humans with trajectory prediction and occlusion modeling. Boston University Computer Science Department. Ross, T. J. (2009). Fuzzy logic with engineering applications (4th ed.). John Wiley & Sons
(580p).
Sadilek, A., & Krumm, J. (2012). Far out: Predicting long-term human mobility. Proceedings of the 26th AAAI conference on artificial intelligence (pp. 814–820).. Shafer, G. (1976). A mathematical theory of evidence. Vol. 1Princeton: Princeton University
Press (314p).
Shang, S., Xie, K., Zheng, K., Liu, J., & Wen, J.-R. (2015). VID join: Mapping trajectories to points of interest to support location-based services. Journal of Computer Science and Technology, 30(4), 725–744.
Shen, J., & Cheng, T. (2016). A framework for identifying activity groups from individual space-time profiles. International Journal of Geographical Information Science, 1–21. Shi, W. (2009). Principles of modeling uncertainties in spatial data and spatial analyses. CRC
Press.
Wang, Y., Luo, Z., Takekawa, J., Prosser, D., Xiong, Y., Newman, S., & Balachandran, S. (2016). A new method for discovering behavior patterns among animal movements. International Journal of Geographical Information Science, 30(5), 929–947. Widhalm, P., Yang, Y., Ulm, M., Athavale, S., & González, M. C. (2015). Discovering
urban activity patterns in cell phone data. Transportation, 42(4), 597–623. Yan, Z., Chakraborty, D., Parent, C., Spaccapietra, S., & Aberer, K. (2013). Semantic
trajectories: Mobility data computation and annotation. ACM Transactions on Intelligent Systems and Technology (TIST), 4(3), 49.
Zhao, P., Qin, K., Ye, X., Wang, Y., & Chen, Y. (2016). A trajectory clustering approach based on decision graph and datafield for detecting hotspots. International Journal of Geographical Information Science, 1–27.
Zheng, Y. (2015). Trajectory data mining: An overview. ACM Transactions on Intelligent Systems and Technology (TIST), 6(3), 29.
Zheng, Y., Zhang, L., Xie, X., & Ma, W.-Y. (2009). Mining interesting locations and travel sequences from GPS trajectories. Paper presented at the Proceedings of the 18th inter-national conference on World Wide Web.
Zheng, Y., & Zhou, X. (2011). Computing with spatial trajectories. Springer Science & Business Media.
Zheni, D., Frihida, A., Claramunt, C., & Ghezala, H. B. (2015). A semantic-based data model for the manipulation of trajectories: Application to urban transportation. Paper presented at the international symposium on Web and Wireless Geographical Information Systems.
Zhou, C., Frankowski, D., Ludford, P., Shekhar, S., & Terveen, L. (2004). Discovering personal gazetteers: An interactive clustering approach. Paper presented at the pro-ceedings of the 12th annual ACM international workshop on geographic information sys-tems.
8
View publication stats View publication stats