Science Arts & Métiers (SAM)
is an open access repository that collects the work of Arts et Métiers Institute of
Technology researchers and makes it freely available over the web where possible.
This is an author-deposited version published in: https://sam.ensam.eu Handle ID: .http://hdl.handle.net/10985/15535
To cite this version :
Abdul Rahman Abdel RAZEK, Christian VAN HUSEN, Marc PALLOT, Simon RICHIR Comparing Different Performance Factors of Conventional VS Immersive Service Prototypes -International Conference on Engineering p.9 - 2019
Any correspondence concerning this service should be sent to the repository Administrator : archiveouverte@ensam.eu
Comparing Different Performance Factors of
Conventional VS Immersive Service Prototypes
Abdul Rahman Abdel Razek
Service Innovation, Furtwangen
University
Arts et Métiers ENSAM
aba@hs-furtwangen.de
Christian van Husen
Service Innovation, WING
Furtwangen University
Robert-Gerwig Platz.1, 78120
Furtwangen, Germany
Marc Pallot, Simon Richir
Arts et Métiers ENSAM
2 Bd du Ronceray, 49000 Angers
France
Abstract—Service prototyping is an innovative iterative process envisioned to enhance the service development process while refining the anticipated service experience. Immersive technologies, such as: Virtual Reality (VR), Augmented Reality (AR), and Mixed Reality (MR), in service prototyping have the potential to enhancing the co-creation of service ideas. It is intended to transform intangible service aspects into an experience, even before the service exists. However, there is a lack of research studies comparing different forms of service prototype. Such studies would help to find out the most appropriate Service Prototype (SP) form for exploring, communicating and evaluating new service ideas. Several SP experiment sessions were conducted in France and Germany within an academic context in 2018 to compare different performance factors of conventional Service Prototypes (CSP) versus Immersive Service Prototypes (ISP). The participants have to disassemble and then reassemble a simple three-part mechanical element with the aid of four different SP forms. This paper presents the results of the experiment sessions, involving 38 participants, conducted at Furtwangen University campus in Germany. These results reveal that participants preferred ISP forms rather than CSP forms. However, it also confirms that there are still some difficulties in applying and using VR or AR devices.
Keywords— Service Innovation; Service Prototyping; Service Experience; User eXperience, Virtual Reality, Augmented Reality, Mixed Reality
I. INTRODUCTION
The need for service innovation increases because organizations all over the world are looking for a more consistent, effective and affordable service development process. It is shown by a previous study, that about 40% of newly announced services flop within the initial year [1]. Service is defined as a process that organizations use to deliver, intangible and tangible features, resulting in customer added value [20]. Service prototyping provides an agile process that enables service development through iterations. It allows a co-creative developmental process engaging all service stakeholders at the earliest stages in order to develop, conceptualize, and design through iteratively refining the
service experience. Technology has drastically altered the service context [2]. An uninterrupted information stream interconnects individuals, systems and devices, which is likely to disrupt numerous industries [3]. The technological advancement has elevated the service complexity by increasing the ways stakeholders can interact with each other and with the service systems, leading to a more complex service development process [4]. Digitalized and information based services play a substantial part in defining the strategy of industrial organizations [5]. Immersive technologies (VR, AR, MR) are often used in the industry, especially for product and systems prototyping, as means to have enhanced immersive visual stakeholders’ experiences [6].
It is well acknowledged that traditional service engineering methods induce a longer period of time for completing the service development process [19]. Service prototyping is considered as an innovative service engineering method through an iterative agile service development. It helps shortening the service development process, while focusing on the early stage of service ideas co-creation among stakeholders, and service process learnability. SP is intended to transform intangible service ideas, and concepts, into a service experience. This service experience would be reflecting the anticipated use of a service; it enables the service exploration, communication, and evaluation even before the service exists. Furthermore, it allows an improved decision making process even at the early stage; these well informed decisions are based on stakeholders’ behaviors and feedback collected after experiencing the alternative service prototypes.
This paper presents the results, in terms of performances of four SP forms; this aims to guide service stakeholders to choose the most suitable SP form. It consists of 5 sections: starting with this introduction, then, the literature review on current service concepts and theories. The following section discusses the motivation for the experiment, and the mixed methods that was used. The findings section presents the results of the experiment sessions conducted at the Furtwangen University. Finally, we present the limitations of this study, concluding remarks and future work.
II. EXISTING THEORIES & PREVIOUS WORK
Service prototyping is a process for service development and innovation that uses service representations or parts of it. It is intended to explore, communicate and evaluate a service idea, whilst encompassing diverse intangible and tangible aspects, different processes, and dynamic stakeholders [7]. In the past three years we have experimented different SP forms and their implementation, application, and methods. Henceforth, we conducted several industrial and academic investigations devoted to service prototyping and realized service prototypes. In previous studies, we have covered the service innovation aspect of service prototyping [7,10] and service prototyping framework and model that were used to design this experiment [8]. As well as the experience feedback of industrial stakeholders from a workshop dedicated to explore SP forms [9].
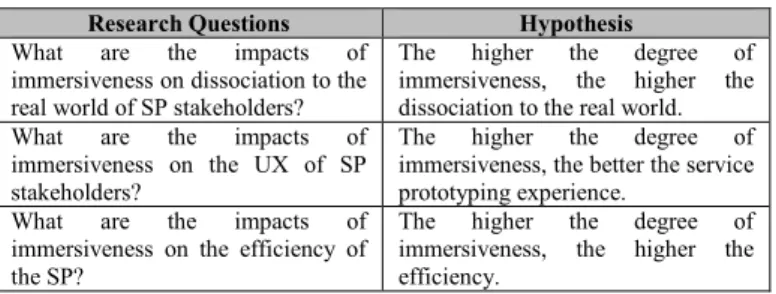
Several scholars have identified that there is a lack of empirical studies on service prototyping and prototypes [11,12]. This statement concurs with our literature review that we have done on the service prototyping literature. This lack of empirical investigation motivated us to carry out this comparison between Conventional Service Prototypes (CSP) and Immersive Service Prototypes (ISP) performance factors. A research framework was developed in order to represent the SP process and its constructs. The main task was about investigating the potential impacts of using immersive service prototypes compared to the conventional ones [8]. The research questions and hypothesis were mentioned in previous publication [8], and briefly shown in Table 1.
TABLE I. RESEARCH QUESTIONS AND HYPOTHESIS [8]
Research Questions Hypothesis
What are the impacts of immersiveness on dissociation to the real world of SP stakeholders?
The higher the degree of immersiveness, the higher the dissociation to the real world. What are the impacts of
immersiveness on the UX of SP stakeholders?
The higher the degree of immersiveness, the better the service prototyping experience.
What are the impacts of immersiveness on the efficiency of the SP?
The higher the degree of immersiveness, the higher the efficiency.
According to a Google scholar search, it appears that the terms “Immersive Service Prototyping” or “Immersive Service Prototype” are both novel. It was also established that the understanding of the most appropriate service prototype form to utilize for each specific service purpose and activity is rarely addressed in the literature [9]. This lack of understanding hinders service designers in the application of immersive technologies to be able to design a more efficient and effective service prototypes. This study aims to give better understanding on the selection and application of the most appropriate SP form.
III. EXPERIMENT
A. Context
Our SP experiment sessions were conducted in three different locations: Furtwangen, Laval and Angers. This paper
discusses the results of the experiment sessions that were conducted at the Furtwangen University from April to September 2018. This experiment is intended to perceptually, emotionally and cognitively engages participants; as such there is a need of different levels of knowledge and experience in a widespread base of participants.
Instruction leaflets are quite commonly used in the industry as an instructional aid for servicing machinery. The instruction leaflet shows steps of the disassembling or assembling process to aid the participant in finishing their task. This type of instruction -based leaflet could be considered as a part of the service process.
The experiment engages the participants with two CSPs (read an instruction leaflet or watch an instructional video) and two ISPs (interact with the instructions within a virtual reality environment or in an augmented reality environment). The participants use these SPs to aid in the completion of the disassembling and assembling tasks. The task consists of a three-part coinciding metal mechanical construction element to disassemble and assemble. This three-part metal element has multiple screws in multiple locations, which needs to be unscrewed, disassembled and screwed back in order to be reassembled. The different instructional SP forms and their short descriptions are shown in Table 2.
TABLE II. INSTRUCTIONS SP FORMS
SP Forms Descriptions
Virtual Reality Service Prototype
(VRSP) Immersing the user through an HTC Vive HMD to explore and interact with the instructions in a virtual environment
Augmented Reality Service
Prototype (ARSP) Overlaying instructions on a tablet device of each disassembling and assembling step directly on the physical metal construction
Paper Service Prototype (PSP) Including all the necessary steps and explanation of every step, with the CAD drawing of each part of the three-parts metal object
Mock-Up Service Prototype (MSP) Containing a replication video of the assembling and the disassembling processes to show the user how it is correctly done
B. Protocol
Participants start out by receiving a verbal briefing on the experiment; after that, they proceed to watch three short clips explaining the experiment. Then, they fill out their information in a demographic survey. As a follow-up, they continue on to use all four SP forms and carry out the disassembling and assembling task after using each form. Then, they provide their feedback in filling out a bipolar survey after each use of the four SP forms and completing the disassembly and assembly tasks. Afterwards, there is a debriefing to ask them if they have any more feedback regarding the experiment. The overall duration of one participant’s session was about one hour. During the experiment, each participant’s action, attitude and behavior was observed and capture, even when they were in isolation in VR as it was possible to observe their interaction through the replication large screen. Idem situation when
participants were using ARSP through their interaction with the AR App on the tablet and when they were using PSP and MSP. The latest took place while the participants were reading the leaflet or watching the video. Due to the fact that both forms (PSP and MSP) lack interaction; the observation was merely to see if any support was needed. Moreover, there was a timing of their tasks duration, and noting their attitudes, comments, explanation requests, and eventual errors.
The clocking of the tasks started from the moment that participant initiates the disassembly or assembly task till the end of each of the tasks. As shown in Table 3, the participants were all assigned different SP cycles; to eliminate biasing from doing the task with the same SP form at the start or end of a cycle for all of the participants. The experiment cycle consists of the sequence of the used SP forms in an explicit order. The clocked task durations present the time that each participant required to complete the two tasks, but do not include the time necessary to acquire the knowledge for the task. The participants were made aware about the clocking of the task completion durations, which implicitly implied that they had to try to be as effective and efficient as possible.
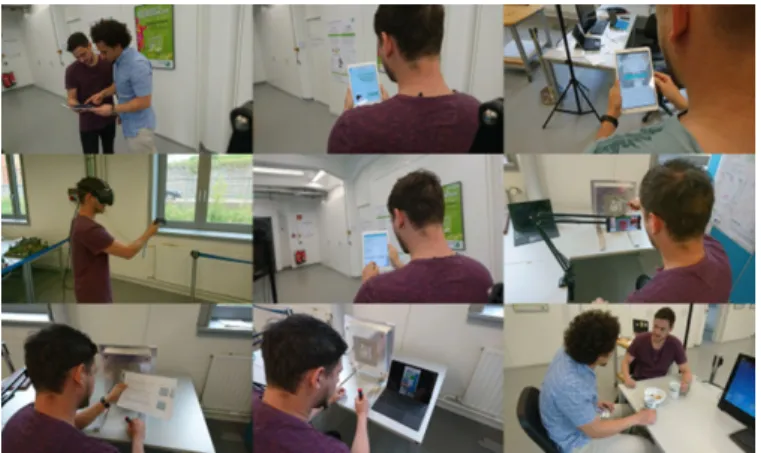
Fig. 1. Experiment Picture Protocol
Fig.1 shows the picture protocol of the experiment in which a participant: (1) receives a verbal and written briefing; (2) watches three short videos explaining the experiment; (3) fills out demographic questionnaire, (4) answers the bipolar survey after the completion of each experiment task, (5) receives an end of experiment debriefing. The participant has to fill the bipolar survey four times, one time after each SP form used, throughout each individual session.
C. Methods
Mixed methods seem to be the most appropriate method to tackle such multidimensional explorative study [13] where quantitative data are justified by qualitative data. Mixed methods approach was used to investigate similar immersive experience study [15]. It was also established as an appropriate method for a similar immersive eXperience study [14]. This approach attempts interpreting the findings by combining qualitative and quantitative data [12]; using the qualitative data to explore and interpret the quantitative findings.
The combination of quantitative and qualitative data is used; because service prototyping is a novel process that is not yet broadly studied. The quantitative and qualitative data are
analyzed concurrently; the observations contribute to both the quantitative and qualitative results. The quantitative data offer a resulting statistical figure on used CSP and ISP while the qualitative data provide explanations. In other words, the quantitative data represent the potential impacts of using immersive service prototypes; the qualitative data illuminate those statistical results exploring in depth the reasons justifying the impacts on the immersive experience.
D. Survey
A bipolar survey is used to collect the participants’ feedback by filling out a rating questionnaire including a justification question for each bipolar question. This bipolar survey entails 15 rating questions; each question includes a rating justification element to explain the motivation for the given rating. These embedded justification elements allow participants to liberally express their feedback about their rating. This survey was written initially in English and then was translated into German (used at The Furtwangen University) and then into French (used at ENSAM Laval and Angers Campuses).
The participants start by filling their profile, including their knowledge self-assessment, in a demographic survey. The nine multiple choice demographic questions are the following: (0) participant’s experiment ID and experiment cycle (sequence of SP forms); (1) gender; (2) age slice; (3) occupation; (4) service design knowledge level; (5) immersive technologies knowledge level; (6) SP knowledge level; (7) prior SP experience level; (8) prior ISP experience.
The experiment survey was cautiously created to contain the SP experience facets, SP efficiency aspects, and the real world disassociation influences as discussed in previous publication [8]. The participants’ feedback and ratings during the experiment can be considered as the Service Prototyping eXperience (SPX), which is an extension on the Immersive eXperience model from Pallot [16]. The SPX is revealed from the questions that cover: (1) if they are convinced of that SP form; (2) if they are willing to re-use the SP form in another context; (3) if they recommend this SP form to others.
The real world disassociation factors are exposed from the participants’ responses on the questions concerning: (1) the feeling of the impression of time vanishing during the experiment; (2) the capacity to be observant of outside factors, (3) the responsiveness to external influences as it was previously used by Pallot [17]. The service prototyping efficiency is quantified by: (1) clocking the disassembly and assembly tasks for each form; (2) the number of explanation requested; (3) mistakes made by the participants during the task.
IV. FINDINGS
The collected data were clustered to several data sets; the first set of results is the demographic data of the participants; the second set of results constitutes the answered bipolar survey. Finally, the third set of results reflects the observation metrics.
A. Demographic Results
A total of 38 participants participated in the experiment sessions held at the Furtwangen University from April to August 2018. The majority of the participants with almost 4 out of each 5 participants (82%) were males, while 18% were females. The ages of the participants ranged from: (1) more than half of the participants (58%) ages were from 17 to 25 (2) quarter of the participants (24%) ages were from 26 to 35; (3) only one twelfth of the participants ages (8%) were from 36 to 45; (4) one tenth of the participants (10%) ages were from 46 to 65. Both results are graphically displayed in fig. 2.
Fig. 2. Age and Gender of the Participants
The amount of young participants and the diversity in the other age slices is characteristic of the academic setting where the experiment sessions took place. The unbalanced gender can be inferred from the fact that the experiment was mostly advertised to the students and faculty members of engineering management faculty and informatics faculty at the Furtwangen University where most of the students are males.
The participants were primarily students mixed from different engineering management and IT disciplines forming two thirds of the total participants (66%). Academic employees participated with 16% followed by professors and other industrial occupations filled one tenth (10%) of the participants each, as shown in Fig.3.
Fig. 3. Occupation of the Participants
The turnout of the non-student participants was better than expected as the sessions were conducted in an academic setting; and the resonance for the non-students was a very high with one third (34%) of the participants. This means that two thirds (66%) of the participants either had no prior service prototyping experience or no immersive technologies
knowledge or both. This is quite important to be able to capture their first impression of such a novel process.
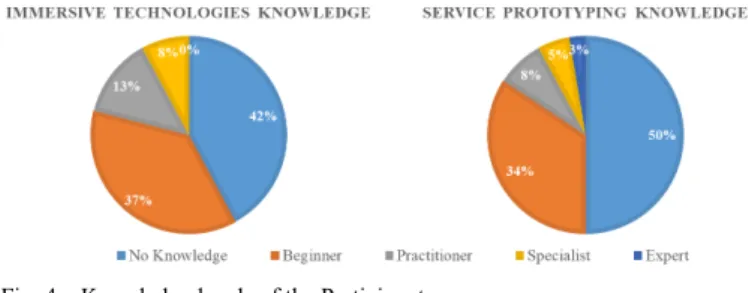
The participants’ knowledge level diversity is reflected in their knowledge rating responses, especially in the area of service prototyping. This is highlighted in the service prototyping and immersive technologies knowledge levels shown in the Fig. 4: (1) half of the participants (50%) had no prior service prototyping knowledge; (2) one third (34%) of the participants were at beginner level, (3) one twelfth (8%) were at practitioner level, (4) one of each twenty participants (5%) were specialists, (5) only one (3%) person was considered an expert; (6) less than half (42%) of the participants had no prior immersive technologies knowledge; (7) more than one third (37%) were beginners in immersive technologies; (8) 13% of the participants were practitioners in immersive technologies; and 8% of the participants were specialists, (9) while there were no participants considered experts in immersive technologies.
Fig. 4. Knowledge levels of the Participants
Almost half the participants had no prior theoretical knowledge of both service prototyping and immersive technologies; and more than third of the participants were at a beginner level. The diversity of the knowledge level and the amount of participants of no prior knowledge were beneficial for catching their first impressions and feedback. The assessment of the level of previous knowledge in both service prototyping and immersive technologies determines the significance of that prior knowledge influence on the participants.
The efficiency of the participant is an interesting aspect to measure, which is directly correlated to the participant’s previous experience in using ISP and CSP. This can be seen in Fig. 5, where 71% of the participants had no prior experience of both CSP and ISP, on one hand 10% had previous CSP experience, and on the other hand 8% had previous ISP experience, while 11% had experienced both CSP and ISP.
The results of the knowledge levels are plausible as about two thirds (66%) of the participants were students; where the knowledge levels are at their starting point with no experience or at beginner level at the most. This is vital for capturing the opinions of the students, the engineers and service managers of the future. There was also more than a quarter of the participants (29%) that had prior experience of either one or both CSP and ISP. This could be attributed to the fact that one third (34%) of the participants were not students. The objective was to have a wide spectrum of participants in an academic environment, while having fresh and first-hand feedback from beginner and novice participants.
B. Bipolar Survey Results
The bipolar survey was created to cover 15 different User eXperience (UX) properties; split into 5 sets of factors clarified in our previous publication [8]. These 5 UX factors sets were inspired by previous research on UX holistic view [16] and Immersiveness factors [17]. The survey was developed to see how each participant perceives the applied SP form emotionally and cognitively. The participants filled out the survey after the completion of each experiment task. Each participant has to use all four SP instructions forms; and answer a questionnaire after each use.
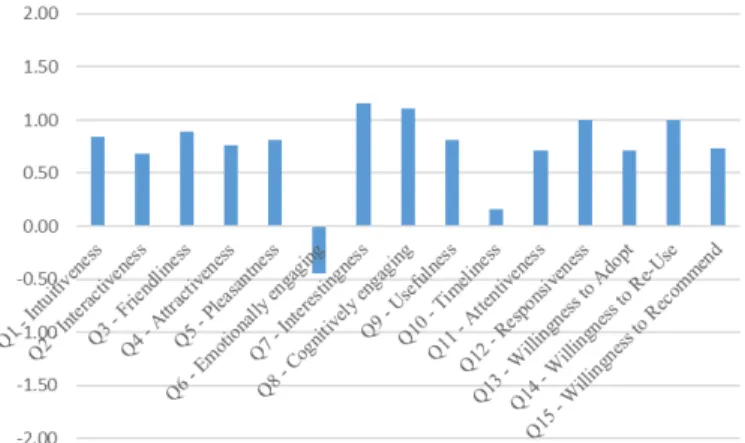
VRSP had the highest overall survey average rating, and had the highest responsiveness rating compared to all the other SP forms. The participants also rated VRSP exceptionally highly in the interestingness, cognitive engagement, and willingness to re-use properties. Almost all properties were positively rated with the exception of the emotional engagement property, which was negatively rated. This could be attributed to the fact that some people might feel disassociated with the outside world or sometimes discomfort feelings (Cyber-sickness). The detailed ratings are shown in Fig. 6. Overall, The VRSP form ranked from good to very good in all the ratings, except in the emotional engagement and the timeliness properties.
Fig. 6. VRSP Survey Average Results
This shows that the participants overall rated VR highly, and it seems that they enjoyed the VR experience, which was noted from the verbal feedback from the participants. The results also show that the average rating of VRSP was the highest amongst all the other SP forms in question. VR doesn’t compromise much emotional engagement, and some may find the immersive aspect disengaging due to a sensation of longer
presence and time. VRSP could be very well utilized for training scenarios or similar scenarios as it shows that is a well-rounded SP form. VR might have a long lasting learning effect due to immersiveness and interactivity of this immersive guidance tool.
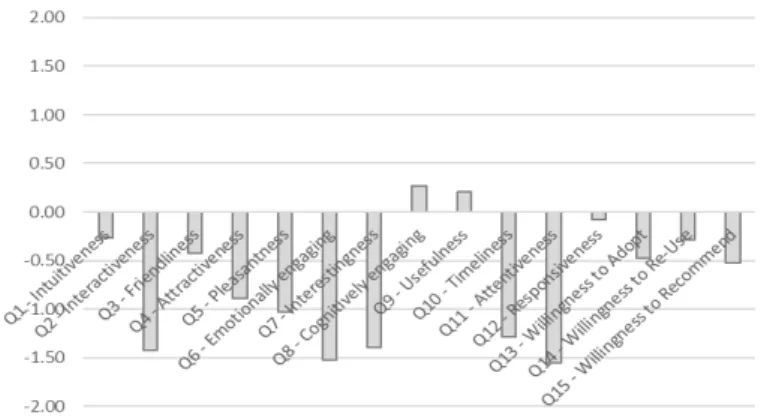
ARSP had the second highest rating overall, the participants rated ARSP highest for the intuitiveness, cognitive engagement and willingness to recommend properties. The participants rated several other UX properties positively, except the emotional engagement, timeliness, and attentiveness properties that were rated negatively. The responsiveness property was rated as almost neutral. This shows that the participants think that ARSP has a worthy applicability and could have multiple uses, and that the participants are more willing to recommend and adopt ARSP than they are willing to re-use it. ARSP might have been rated negatively in these properties due to the fact that users needed to adapt to using this immersive guidance tool.
Fig. 7. ARSP Survey Average Results
The Fig. 7 shows that while using ARSP, participants were almost neutral to the external factors and that they didn’t have any emotionally engagement with it. The ARSP responsiveness property was rated relatively low compared to the VRSP. This could be attributed to that the AR marker recognition was occasionally perplexing for the participants. This is mainly due to the tablet’s location that was sometimes not close enough to the marker; hence, participants had to move closer to be able to recognize the marker. The results also confirm the significant advantage of having a supplementary source of information overlaying the real world objects in order to support the task completion.
PSP was rated negatively in almost every aspect, but the participants ranked the cognitive engagement and the usefulness properties positively. This can be attributed to the fact that the PSP had several CAD drawings and information that might be engaging and that the paper has an almost infinite shelf life and is easy to use. The participants ranked the attentiveness, emotional engagement, and interactivity properties very negatively. The results are graphically shown in Fig. 8.
Fig. 8. PSP Survey Average Results
The results show that although participants rated PSP quite negatively in almost all the properties; but, participants still regard it as a good value proposition (cost/benefit ratio) and as a useful tool in the workplace, or at least for the time being. PSP was also the lowest rated in the average of all the rating questions, and was also the least favorite SP form for almost all participants, which was mentioned verbally throughout the experiment sessions.
As shown in Fig. 9, MSP was rated very highly by the participants regarding the intuitiveness, cognitive engagement and usefulness properties. Participants also ranked it positively in the willing to adopt, re-use, and recommend properties. Although, the moderately high rating of the friendliness, attractiveness, and pleasantness properties, participants rated MSP’s interestingness and responsiveness properties as almost neutral. Participants also ranked MSP quite negatively in the interactivity, emotional engagement, timeliness and attentiveness properties. This might indicate that MSP was quite efficient regarding transferring knowledge as the participant’s durations shows; but due to the answers from the survey might be considered as not quite engaging and not user as friendly compared to other forms (i.e. VRSP and ARSP). MSP showed also a great potential in similar simple training scenarios, or for prototyping simple service processes; as it requires much less technological and training investment compared to ISPs.
Fig. 9. MSP Survey Average Results
These results could be ascribed from the fact that the MSP is composed of two short video clips showing the disassembling and assembling processes without any form of
user interactivity with the player other than playing and stopping the videos. The video clips demonstrate the optimal sequences for completing the task, which is easy to understand and replicate as it shows a person completing the task. The results also indicate that the MSP is more appreciated than the PSP, but less than VRSP and ARPS.
By looking at the results as a whole, we can assume that: (1) VRSP was the most highly rated overall and the positively rated in 14 of the 15 properties; (2) ARSP was rated as the second highest among the SP forms, and had only 3 negatively rated properties; (3) PSP was ranked lowest in every property with only two positively rated properties; (4) MSP was rated relatively highly in 4 properties, neutrally rated in two and negatively rated in another 4 properties. The majority of the participant’s comments showed that most of the participants had enjoyed using ISP and were neutral to or disliked using CSP. There is a clear difference between the CSP and ISP in each participant’s ratings and comments. In fact, it appears that CSP ranked much lower than ISP in almost all the properties and even in the average between them.
Fig. 10. UX Average Per SP Form
The average UX rating, which had a semantic scale of -2 to 2, as shown in Fig. 10 displays: (1) VRSP had the highest UX rating of 0.73, which is considered a satisfactory UX rating; (2) ARSP had the second highest UX rating with a 0.53, which is almost a satisfactory UX rating; (3) PSP had a very low user experience average rating of -0.71; (4) MSP had a positive UX average rating of 0.29 which tends more near to a neutral rating, (5) the overall average UX rating was 0.21, which was higher than PSP, but lower than the VRSP, ARSP, and MSP.
These UX ratings were based on the survey average ratings provided by participants. The ratings show that VRSP and ARSP are a practical option to use in the late stages of service development and innovation. However, VRSP might require an accompanying SP form (generally CSP) to benefit in the early service development stages. PSP’s ratings were expected, as it is the most outdated SP form compared to the other forms, which are based on modern technologies. Surprisingly, MSP did better than expected, and was well accepted from the participants, which was reflected in the very high ratings in some properties. MSP could be also used to prototype simple service processes and used for short term learning or training processes.
C. Observation Results
Observations made during the experiment session consisted of: (1) clocking the duration of disassembling and assembling tasks; (2) participants’ attitudes (face and body expressions) observed during the completion of the disassembling and assembling tasks, when each participant reacts in the stressful situation of completing these tasks (including 3 attitude
options: (a) Happy means that the participants facial expressions were observed as positive (smiling); (b) Neutral meaning that the observer was unable to decode the participant’s facial expressions; (c) Frustrated meaning that the participant’s facial expressions seems to be negative or sad (frown)); (3) errors made during the completion of the tasks;
and (4) explanation requested during the completion of the task.
Fig. 11. Errors and Explanation Requests during the Experiment Session The errors made and explanations requested during the tasks completion are presented in Fig. 11. It seems that: (1) only 1 participant made errors while completing the task when using MSP but height participants requested further explanations; (2) while using ARSP, seven participants made errors and fourteen participants asked for further explanation; which might attribute to some challenges in using the technology; (3) only two participants made errors while using PSP but thirteen participants asked for further explanation; showing that even with the task explained in a simple traditional manner there will be mistakes and explanation requests as well; (4) five participants made errors after using VRSP and only six participants requested explanations; having the least explanation requested shows that VR was the most effective method for dispersing information compared to the other forms; (5) CSP had more explanation requests than ISP although they are supposed to be well know methods that are easy to use and understand; (6) ISP had more errors than CSP, which can be attributed to the fact that both technologies are relatively novel, and most are still not well versed in using them.
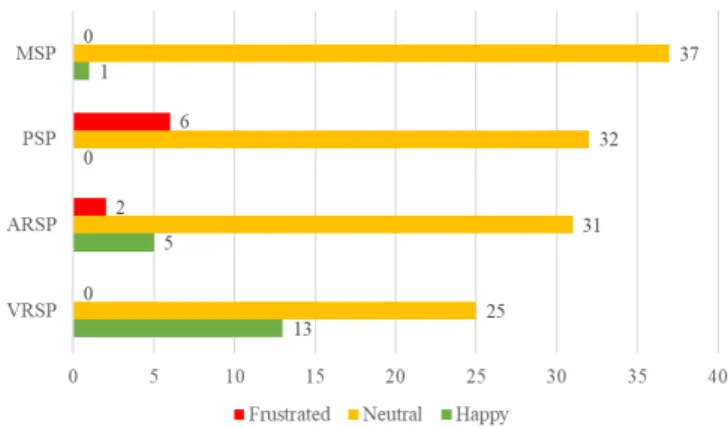
Fig. 12. Participant’s Experissions during the Task Completion
The expression of the participant during the task completion is shown in Fig. 12. The results are as follows: (1) VRSP had the most positive reaction with one third (34%) of the participants with happy attitude and two thirds (66%) of the participants with a neutral attitude; (2) ARSP had the second highest positive attitude with more 13% of the participants with happy expression, and almost four out of 5 (82%) of the participants had neutral expressions, while one of twenty (5%) participants were frustrated; (3) PSP showed the only negative or frustration expressions in the experiment with more than one of each five (15%) participants being frustrated, while four out of five participants (85%) were neutral;(4) MSP had only 2% of the participants that had happy expressions and almost all participants (98%) of them were neutral; (5) VRSP enjoyment might be accredited to the participants liking the VR environment and the interactive instructions simulation; (6) ARSP had mixed participant’s attitude that might be ascribed to the skills needed to suitably use the AR App, which some might have lacked; (7) PSP frustration could be attributed to the fact that the participants had to read several line of text, and some participants might be lacking the capacity to extract the information from it; (8) MSP had the most neutral attitude and that might be as the video used had no interaction, and it was adequate to deliver the information with any cinematics or “action”.
TABLE III. SPCYCLES USED DURING THE EXPERIMENT
SP Cycles SP Form
Cycle 1 VRSP ARSP PSP MSP
Cycle 2 ARSP PSP MSP VRSP
Cycle 3 PSP MSP VRSP ARSP
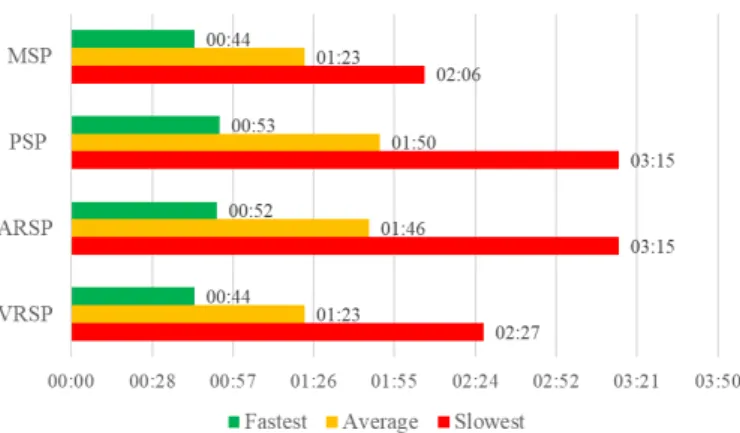
Fig. 13. Disassemblying Task Durations per SP Form (m:s)
The slowest, average and fastest task completion durations for disassembly is shown in Fig. 13: The disassembly process durations were selected as they represent the first interaction of the participants. The results could be described as follows: (1) VRSP and MSP fastest and average disassembly durations were identical with 00m:44s and 1m:23s respectively, showing the high effectivity of both forms; (2) while ARSP and PSP task fastest durations were almost undistinguishable with 00m:52s and 00m:53s, while the average durations for disassembling for ARSP was faster than PSP with 4 seconds; (3) the slowest participants while using MSP clocked 02m:06s while the slowest VRSP duration was 02m:27s, showing that MSP was the more effective even for participants that lacked skills; (4) PSP and ARSP had an identical slowest duration with a 03m:15s, showing that even if the tool is easy or hard to use, if a participant lacks skills the efficiency will be almost the same; (5) average of all durations shows that it was slower than VRSP and MSP average durations but faster than ARSP and PSP durations. VRSP and MSP had the most optimal knowledge transfer, which represents the amount and form of information needed to complete the task; reflected in the shorter duration needed. The relatively slow task duration for ARSP could be accredited to the fact that the participants had to use ARSP while completing the task (AR markers show the next step after completing the initial step); while the participants experienced the other SP forms before starting the task. PSP had similar durations as ARSP showing that for such a simple task paper might be also a viable option when compared to ARSP.
D. Summary of Results
The summary of the results can be seen in Tab. 4, showing the observation and survey results. It includes: (A) Errors made during the experiment; (B) Average Disassembling Task Durations; (C) Number of times each SP form was fastest and slowest within the 4 SP Cycles (D) Participants’ Attitude; (E) Average UX Ratings
TABLE IV. RESULTS SUMMARY
SP
Form Errors Slowest / Cycle Duration Average Fastest / Cycle Attitudes Average Average UX
PSP 2 1 01:50 0 Negative -0.71 MSP 1 0 01:23 1 Neutral 0.29
VRSP 5 0 01:23 3 Positive 0.73
ARSP 7 3 01:46 0 Positive 0.53
After looking at the participants comments, and feedback combined with the results we found that: (1) VRSP has the most potential in similar guidance service processes (i.e.
training processes); (2) VRSP and MSP could be used in
combination to cover the short and long and term knowledge engagement resulting in improving the efficiency; (3) PSP could be utilized for prototyping of simple service activities, but it might not appropriate for prototyping complex service processes; (4) MSP is effective in delivering simple short instructions for a comparatively easy tasks; showing similar duration as VRSP but with less errors; (5) PSP and MSP had a lower UX rating than VRSP and ARSP that might be due to the fact that the participants enjoyed the VR environment and the AR visualization; (6) PSP and MSP had less errors than VRSP and ARSP, that might be attributed to the fact that VR and AR are novel technologies and the participants might have been lacking the required skill; (7) Participant’s attitudes towards the experiment was much better during VRSP and ARSP than PSP and MSP, might be related to the fact that VR and AR are very exciting technology; (8) combined SP forms could be the most appropriate solution to prototype a novel complex service, by using a PSP or MSP for the early service developmental stages (ideation and requirements specification), and VRSP or ARSP for the later stages (design and implementation); (9) the success of VRSP and ARSP depends on the participants’ level of technology acceptance; for some people there is a certain uneasiness, also known as cyber-sickness, while wearing a VR HMD or while using an AR device that unavoidably impacted their performance in completing the tasks [18].
V. CONCLUSION AND FUTURE WORK
This paper presents the results corresponding to a sample of 38 participants out of the overall sample of 105 participants. These experiment sessions were carried out between April and September 2018, involving participants from three different scientific disciplines of the Furtwangen University. Subsequently, the results presented in this paper could be under scrutiny as it might be seen as subject to interpretation due to the size of the sample. The necessary minimum participants’ required skills to appropriately use VR and AR devices could be also considered as a limitation. The experiment also took place in an academic environment, which has mostly students that stand at beginner level for most of them. Some participants faced also challenges while using ARSP despite having a briefing beforehand impacting the average task durations. A couple of participants had some cyber-sickness effect after using the VR HMD. More analysis of the qualitative data will clarify the results and create correlations. The observations could be also construed as idiosyncratic, but that is to that each observer would have their own subjectivity.
In terms of conclusion, the other sample of 48 participants exhibits similar results [19]. The decision about comparing multiple SP forms emerged from our literature review and previous study [9]. Different SP forms are recommended for diverse service complexity and intricacy levels. CSP might be more appropriate for the prototyping of non-complex service processes in which interaction functionality is not required. This is also appropriate for rapid prototyping. According to findings, ISP offers a higher UX due to capacity of higher
degree of fidelity, resolution, and interaction. Nonetheless, ISP requires a higher effort compared to PSP that does not require technological and training investment. Therefore, ISP appears more appropriate for prototyping complex service processes. CSP could be used for prototyping non-complex service processes saving time. ISPs are more appropriate for multi-dimensional service processes (Actors, Artifacts, Environment,
Processes) that are often used in the industrial manufacturing
service sector. We could sum up by saying that ISP enhances the capacity of exploring, experiencing and evaluating a new service even before it really exists.
The rest of the experiment sessions to complete the planned 105 participants were done at the Furtwangen University as well; their results will be soon analyzed. In terms of future work, Mixed Reality Service Prototype (MRSP) will be investigated in future experiment sessions. This will allow us to investigate how much a MR device would improve the experience and overall efficiency compared to the others. Additionally, several industrial experiment sessions are planned to engage industrial stakeholders from the manufacturing and industrial solutions sectors for further investigations. Statistical analysis (i.e. ANOVA) will be conducted for validating the SP model and instrument [8].
ACKNOWLEDGEMENT
This complete empirical study has been carried out successively at the Furtwangen University and then at ENSAM Laval and Angers Campuses. Authors wish to acknowledge their gratitude and appreciation to ENSAM and Furtwangen University, as well as all experiment participants that contributed to this study.
REFERENCES
[1] G. Castellion, S. K. Markham, Perspective: new product failure rates: influence of argumentum ad populum and self‐interest. Journal of Product Innovation Management, 30(5), 976-979, 2013.
[2] B. Larivière, D. Bowen, T. W. Andreassen, W. Kunz, N. J. Sirianni, C. Voss, and A. De Keyser, “Service Encounter 2.0”: An investigation into the roles of technology, employees and customers. Journal of Business Research, 79, 238-246, 2017.
[3] L. Patrício, A. Gustafsson, and R. Fisk. “Upframing Service Design and Innovation for Research Impact.” Journal of Service Research 21, no. 1, 2018.
[4] A. L. Ostrom, A. Parasuraman, D. E. Bowen, L. Patricio, and C. A. Voss, Service research priorities in a rapidly changing context. Journal of Service Research, 18(2), 127-159, 2015.
[5] A. L. Ostrom, M. J. Bitner, S. W. Brown, K. A: Burkhard, M. Goul, V. Smith-Daniels and E. Rabinovich, Moving forward and making a difference: research priorities for the science of service. Journal of service research, 13(1), 4-36, 2010.
[6] M. Buchenau, and J. F. Suri, Experience prototyping. In Proceedings of the 3rd conference on Designing interactive systems: processes, practices, methods, and techniques (pp. 424-433). ACM, 2010.
[7] A.R. Abdel Razek, C. Van Husen, M. Pallot, S. Richir, Innovation by Service Prototyping In the 23rd ICE/IEEE proceedings, 2017.
[8] A. R. Abdel Razek, C. Van Husen, M. Pallot, and S. Richir. "A Proposed Research Framework and Model for Service Prototyping." In 2018 IEEE International Conference on Engineering, Technology and Innovation (ICE/ITMC), pp. 1-8. IEEE, 2018.
[9] M. Sämann, A. R. Abdel Razek, S. Imran, C. van Husen, and C. Droll, Innovation in Prototyping for Technical Product Service Systems. Proceedings of 21st ICE IEEE, 2016.
[10] Exner, K., Lindow, K., Buchholz, C., & Stark, R. (2014). Validation of product-service systems–a prototyping approach. Procedia CIRP, 16, 68-73.
[11] J. Blomkvist, and H. Stefan, „Service prototyping according to service design practitioners." In Conference Proceedings; ServDes. 2010; Exchanging Knowledge; Linköping; Sweden; 1-3 December 2010, no. 060, pp. 1-11. Linköping University Electronic Press, 2012.
[12] J. W. Creswell, V. L. Plano Clark, M. L. Gutmann, and W. E. Hanson, Advanced mixed methods research designs. Handbook of mixed methods in social and behavioral research, P. 209- 240, 2013.
[13] R. B. Johnson, and A. J. Onwuegbuzie, Mixed methods research: A research paradigm whose time has come. Educational researcher, 33(7), 14-26, 2014.
[14] P. Krawczyk, M. Topolewski, and M. Pallot, Towards a reliable and valid mixed methods instrument in user eXperience studies. In Engineering, Technology and Innovation (ICE/ITMC), 2017 International Conference on (pp. 1455-1464). IEEE, 2017.
[15] M. Pallot, and K, Pawar, A holistic model of user experience for living lab experiential design. In 2012 18th International ICE Conference on Engineering, Technology and Innovation (pp. 1-15). IEEE, 2012. [16] M. Pallot, L. Dupont, O. Christmann, S. Richir, B. Vincent, and L.
Morel, “ICE Breaking: Disentangling Factors Affecting the Performance of Immersive Co-creation Environments,” in VRIC ’17 Proceedings of the Virtual Reality International Conference, 2017.
[17] M. Pallot, and S Richir, Laval Virtual Vision 2025: Blurring the lines between Digital and Physical Worlds. Proceedings of ICDVRAT 2016, Los Angeles, USA, 2016.
[18] A. R. Abdel Razek, M. Pallot, C. van Husen and S. Richir, Comparing Conventional versus Immersive Service Prototypes: An Empirical Study - VRIC '19, March 20-24, 2019, IJVR 2019, Laval, France, 2019. [19] S. Cavalieri, and G. Pezzotta, Product–Service Systems Engineering:
State of the art and research challenges. Computers in industry, 63(4), 278-288, 2012.
[20] ISO/IEC 20000-1 Information Technology – Service Management – Part 1: Specification, International
