Microstructure Evolution Of Medium Carbon Low Alloy
Steel During Ingot Breakdown Process
by
Kanwal CHADHA
MANUSCRIPT-BASED THESIS PRESENTED TO ÉCOLE DE
TECHNOLOGIE SUPÉRIEURE IN PARTIAL FULFILLMENT
OF THE REQUIREMENTS FOR THE
DEGREE OF DOCTOR OF PHILOSOPHY
Ph.D.
MONTREAL, JUNE 6
TH2018
ÉCOLE DE TECHNOLOGIE SUPÉRIEURE UNIVERSITÉ DU QUÉBEC
This Creative Commons licence allows readers to download this work and share it with others as long as the author is credited. The content of this work may not be modified in any way or used commercially.
BOARD OF EXAMINERS THIS THESIS HAS BEEN EVALUATED BY THE FOLLOWING BOARD OF EXAMINERS
Prof. Mohammad Jahazi, Thesis Supervisor
Department of Mechanical Engineering at École de technologie supérieure
Prof. Mohamed Cheriet, Chair, Board of Examiners
Department of Automated Production at École de technologie supérieure
Prof. Vincent Demers, Member of the jury
Department of Mechanical Engineering at École de technologie supérieure
Prof. Shae Kwang Kim, External Evaluator
KITECH (Korea Institute of Industrial Technology)
THIS THESIS WAS PRESENTED AND DEFENDED
IN THE PRESENCE OF A BOARD OF EXAMINERS AND THE PUBLIC JUNE 1ST 2018
ACKNOWLEDGMENT
I would wish to convey my earnest gratitude to my supervisor, Prof. Mohammad Jahazi, whose expertise, counsel, and patience added considerably to my research experience. I appreciate all his efforts, especially in transferring his knowledge to me, adjusting my writing and supporting me financially during my Ph.D. I am thankful to him for believing in my accomplishments and providing me with every opportunity to assimilate. His encouragement helped me throughout my research study. I would also wish to thank Prof. Pinaki Prasad Bhattacharjee for stimulating discussions regarding the microstructure characterization using EBSD and KAM technique. His efforts enabled me to do the SEM-EBSD characterization at IIT Hyderabad and helped me to accurately characterize the hot compression microstructures using KAM technique. It was surely a delight to work with these professors during my Ph.D., tenure, all of whom are experts in physical metallurgy and characterization.
I also extend my earnest gratitude to Dr. Davood Shahriari, a researcher at ETS Montreal, for the fruitful discussions I held with him. He enthusiastically supervised and helped me throughout my term with respects to FEM modeling, constitutive equations, and diffusion equations. I would frankly say that I was able to adapt quickly to the research environment because of him.
Particular thanks go out to Dr. Clodualdo Aranas Jr., University of New Brunswick, for his great inputs and discussion regarding Dynamic Transformation. He has helped me at all times, during his term at McGill University and even after that. I would wish to thank Dr. Mohammed Zaid Ahmed for his outstanding support and fruitful discussions regarding various subjects in hot deformation in steels.
I am very grateful for the financial support provided by the NSERC Canada during my Ph.D. tenure. Without this generous program and award, I would not be able to pursue my Ph.D. studies at ETS Montreal. I would also express my gratitude to ETS Montreal for providing financial support to do an internship in IIT Hyderabad, India, where I was able doing all the microstructure characterization.
I would wish to acknowledge my colleagues, Ms. Emna Ben Fredj, Dr. Mohammad Sadati, Dr. Hadi Ghaseminanesa, Mr. Heithem Touazine, for assisting me on during my Ph.D. My Ph.D. research would have been a lot more difficult without their help and discussions. I have been privileged to learn and collaborate with them. I would wish to take this chance to thank Mr. Heithem Touazine and Ms. Emna Ben Fredj for the French rendering of my thesis abstract. I am grateful to Mr. Radu Romanica for his help in doing hot compression tests in Gleeble 3800® thermomechanical Simulator. Special thanks to Mr. Rajasekhar Reddy
Seelam, Ph.D. researcher at IIT Hyderabad, India, for assisting in the post-processing of EBSD data. He has been very friendly and was available at all times to help me in post-processing work.
My utmost gratitude to my parents, Mr. R.K. Chadha, Ms. Kiran Chadha and my sweet sister Ms. Vasudha Pathania, for their outstanding support, kindness, love and constant motivation throughout this journey.
Ultimately, this journey would not be possible without the unconditional love and unparalleled motivation from my wife, Ms. Surbhi Chadha. Her patience and understanding enabled me to concentrate and focus on my work. I am really lucky to have a such a lovely wife.
EVOLUTION DE LA MICROSTRUCTURE D'UN ACIER FAIBLEMENT ALLIÉ DURANT LE PROCESSUS DE FORGEAGE
Kanwal CHADHA RESUME
Les aciers à haute résistance mécanique utilisés pour la fabrication de composants de grandes dimensions tels que les arbres de turbine sont produits par coulée en lingots, suivie d'opérations de forgeage, de trempe et de revenu afin de décomposer la structure coulée et d'optimiser les propriétés. La première étape du processus de déformation, appelée décomposition des lingots, est réalisée bien au-dessus de la température para-équilibre Ae3 (température à laquelle la transformation de la ferrite en austénite accompagnée d'une diffusion interstitielle atteint l'équilibre, et produit donc des changements microstructuraux majeurs. De plus, la microstructure développée au cours du processus de décomposition des lingots a une influence déterminante dans la conception des traitements thermomécaniques ultérieurs pour obtenir les propriétés souhaitées dans le produit forgé. L'objectif principal de cette thèse est d'étudier et de comprendre les mécanismes impliqués dans l'évolution de la microstructure lors du forgeage de la structure coulée d'un acier moyennement allié à faible teneur en carbone utilisé comme matériau de matrice dans l'industrie du transport. En outre, le comportement constitutif de la structure telle que coulée a été modélisé et le modèle de matériau décrivant le mieux le comportement de l'acier étudié pendant le processus de décomposition des lingots de très gros lingots a été déterminé pour la première fois. Le modèle matériel développé a été implémenté dans un code d'éléments finis (FEM).
La première partie de cette étude fournit des détails sur le développement d'un modèle précis afin de prédire le comportement d'écoulement du matériau dans différentes conditions de déformation. L'évolution de la microstructure, de l’état coulé à l'état forgé, a été quantifiée avec précision et le modèle développé ainsi que les constantes de régression ont été identifiées. Le modèle qui permet de mieux anticiper les courbes d'écoulement lors de la déformation d'une structure de coulée a été déterminé. Plus précisément, les modèles constitutifs de Hansel-Spittel et d'Arrhenius ont été développés en utilisant des tests de compression à chaud puis incorporés dans le code FEM à l’aide du code de calcul Forge NxT 1.0®. Les résultats de la simulation ont été utilisés pour analyser le chauffage adiabatique et
pour l'analyse de la force en fonction du temps.
Pour déterminer et quantifier la précision des modèles développés, une comparaison du modèle d'Arrhenius et de Hansel-Spittel est effectuée. La précision et la fiabilité des deux modèles ont été comparées en termes de coefficient de corrélation (R) et d'erreur relative absolue moyenne (EARM). Les valeurs de R et EARM pour le modèle d'Arrhenius sont comprises entre 0.978 et 1.76%, alors que pour le modèle de Hansel Spittel, elles sont comprises entre 0.972 et 3.17%. Les prédictions de contrainte déformations par les deux équations révèlent que le modèle de Hansel-Spittel est incapable de prédire l’adoucissement
dynamique du matériau et s'est également avéré insignifiant dans la prédiction des courbes d'autres intervalles de paramètres. La modélisation par éléments finis (MEF) a été utilisée en intégrant les deux modèles dans le logiciel Forge NxT 1.0® pour la l'optimisation du
processus de forgeage des lingots. D’une part, les résultats de la simulation ont montré un bon accord avec les valeurs théoriques du chauffage adiabatique en utilisant les deux modèles. D’autre part, le modèle d'Arrhenius était capable de prédire avec précision les valeurs de force en fonction du temps. Les résultats indiquent que le modèle d'Arrhenius est plus précis et efficace dans la prédiction du comportement de déformation de la structure coulée que le modèle de Hansel-Spittel.
La deuxième partie de cette étude analyse l'occurrence de la transformation dynamique au cours du processus de forgeage du lingot. Cette recherche se concentre sur les mécanismes fondamentaux responsables de l'évolution de la microstructure coulée vers une microstructure forgée. L'acier au carbone homogénéisé et coulé avec une taille de grain égale à 200 µm a été utilisé pour cette étude. La déformation à chaud est réalisée en utilisant un simulateur thermomécanique Gleeble 3800 à des températures entre 1150 ° C et 1200 ° C avec des vitesses de déformation égales à 0.25, 1 et 2 s-1. Les températures de déformation à
chaud choisies étaient comprises entre 450-500 ° C au-dessus de Ae3. La technique de double
différenciation a été utilisée pour analyser les courbes contrainte-déformation. Des différentes techniques comme la microscopie optique, le microscope électronique à balaya (MEB) et la diffraction d'électrons rétrodiffusés (EBSD) ont été utilisées pour la caractérisation de la microstructure. La misorientation locale (KAM) a été utilisée pour mesurer la misorientation interne afin de séparer la fraction de grains de ferrite transformés dynamiquement (TD). Les résultats indiquent qu'avec l'augmentation de la température de déformation, la fraction de ferrite augmente, alors qu'elle diminue avec l'augmentation de la vitesse de déformation.
L'étude de l'effet de la vitesse de déformation sur la présence de ferrite DT et sa croissance a été déterminée à l'aide du coefficient de diffusion de la tuyauterie. On a constaté que le taux de déformation joue un rôle important dans l'évolution de la microstructure du DT. Des plaques de ferrite de Widmanstätten ont été observées à un taux de déformation plus élevé et, à des taux de déformation plus faibles, de la ferrite quasi polygonale a été observée. Le changement de morphologie était lié à la variation de la diffusivité du carbone et de la distance de diffusion avec le taux de déformation. Un mécanisme pour cette transformation est proposé et illustré schématiquement.
La troisième partie se concentre sur l'effet de l'addition de chrome (Cr) sur la transformation dynamique (TD) de l'austénite à la ferrite à une température supérieure à Ae3 et qui peut
atteindre 430 ° C dans un acier faiblement allié en fonte. En calculant la force motrice et l'énergie de barrière à la transformation, les résultats ont montré que même si Cr augmente la force motrice de la transformation et l'énergie de la barrière augmentent. Afin de mieux comprendre fondamental au niveau atomistique, l'analyse de diffusion a été réalisée en
considérant la contrainte dû à la déformation. Il a été constaté qu'avec l'augmentation de la contrainte, la diffusivité et la distance de diffusion augmentent. En comparant les résultats de diffusion du Cr avec ceux d'autres éléments comme le carbone et le silicium, on a trouvé que la distance de diffusivité et de diffusion du Cr est significativement plus faible que celle du carbone et du silicium. Cette découverte donne un aperçu de la façon dont des éléments comme Cr augmentent l'énergie de barrière à TD, alors que des éléments comme le C et le Si agissent en faveur de TD. L'analyse de diffusion a également Montré que la température n'a aucun effet sur la diffusivité, la diffusion et la distance de diffusion de Si, Mn et Cr par rapport au C qui a un effet significatif avec un changement de la température.
La quatrième est focalisée sur l'étude de l'effet de la double déformation sur la cinétique de recristallisation métadynamique (MDRX). Le processus du forgeage du lingot comprend souvent plusieurs étapes de déformation successives avec des temps d'interpasses élevés, au cours desquels MDRX se produit. Des essais de compression isotherme en deux étapes ont été effectués à des températures égales à 1150 et 1200 ° C, à des vitesses de déformation de 0.25-2s-1 et des temps d'interpassage de 5-25 s. Sur la base des résultats expérimentaux, un
modèle matériel pour MDRX a été proposé. Le modèle constitutif a été implémenté dans le logiciel Forge NxT 1.1® dans le but de simuler la compression multi étapes. Les prédictions s'avèrent cohérentes avec l'analyse numérique et expérimentale. Cette constatation indique que les équations cinétiques proposées peuvent donner un comportement de d’adoucissement précis pour les déformations à chaud pour l'acier faiblement allié à l’état coulé.
Mots-clés : Acier coulé faiblement allié, Microstructure de l'acier coulé, équations constitutives, simulations par éléments finis, Forge Nxt 1.0®, déformation à chaud, transformation dynamique, diffusion, analyse par EBSD, Recristallisation Metadynamique
MICROSTRUCTURE EVOLUTION OF MEDIUM CARBON LOW ALLOY STEEL DURING INGOT BREAKDOWN PROCESS
Kanwal CHADHA ABSTRACT
High-strength steels used for the manufacturing of large size components such as turbine shafts are produced by ingot casting, followed by forging, quenching, and tempering operations to breakdown the as cast structure and to optimize the properties. The first step of the deformation process, called ingot breakdown, is carried out well above the paraequilibrium Ae3 temperature (temperature at which ferrite to austenite transformation
accompanied by interstitial diffusion reaches equilibrium, and therefore produces major microstructural changes. Moreover, the microstructure developed during the ingot break down process has a determining influence in the design of the subsequent thermomechanical treatments to achieve the desired properties in the wrought product. The main aim of this thesis is to investigate and understand the mechanisms involved in the evolution of microstructure during break down of as-cast structure of a medium carbon low alloy steel used as a die material in the transport industry. In addition, constitutive behavior of the
as-cast structure was modelled and the material model best describing the behavior of the
investigated steel during the ingot breakdown process of very large ingots was determined for the first time. The developed material model was implemented in a finite element (FEM) code.
The first part of this study provides the details of the development of a precise model in order to predict the flow behavior of the material under different deformation conditions. The microstructure evolution from as-cast to wrought condition needs to be accurately quantified and the optimum material model and constants need to be identified. The model which can better anticipate the flow curves during the deformation of an as-cast structure is determined. Specifically, Hansel-Spittel and Arrhenius constitutive models were developed using hot compression tests and then incorporated in the FEM code Forge NxT 1.0®. The simulation
results thus generated were further utilized to analyze the adiabatic heating and force vs. time analysis. To determine and quantify the accuracy of the developed models, a comparison of the Arrhenius and Hansel-Spittel model is done. The accuracy and the reliability of both models were compared in terms of correlation coefficient (R) and the average absolute relative error (ARRE). The values of R and ARRE for Arrhenius model are 0.978 and 1.76 %, whereas, for the Hansel Spittel model these values are 0.972 and 3.17 % respectively. Stress-strain predictions by both equations reveal that Hansel-Spittel model is unable to predict the dynamic softening of the material and also proved insignificant in predicting the curves of other range of deformation parameters. Finite Element Modeling (FEM) was used by integrating the two models in Forge NxT 1.0® software for the design and optimization of
the ingot breakdown processes. The simulation results showed good agreement with the theoretical and simulated values of adiabatic heating using both models, whereas only Arrhenius model was able to accurately predict the force vs. time values. The overall results
indicate that the Arrhenius model is more accurate and efficient in predicting the deformation behavior of the cast structure than the Hansel-Spittel model.
The second part of this study analyzes the occurrence of dynamic transformation during ingot break down process. This investigation focuses on fundamental mechanisms responsible for the evolution of the cast microstructure towards a wrought one. As-cast homogenized medium carbon steel with a grain size of ~ 200 µm was used for the investigation. Hot deformation was carried out using Gleeble 3800 thermomechanical simulator at a temperature 1150 °C and 1200 °C under strain rates of 0.25, 1 and 2 s-1. The selected hot
deformation temperatures were 450-500 °C above Ae3. The double differentiation technique
was employed to analyze stress-strain curves and a combination of optical, SEM, and Electron Back Scattered Diffraction (EBSD) technique were used for microstructure characterization. Kernel average misorientation (KAM) was used to measure internal misorientation to separate out the fraction of dynamically transformed (DT) ferrite grains. Results indicated that with the increase in the deformation temperature, ferrite fraction increased, whereas it decreased with increase in strain rate. The investigation on the effect of strain rate on the occurrence of DT ferrite and its growth was determined using pipe diffusion coefficient. It was found that the strain rate has significant role in the microstructure evolution in DT. At higher strain rate, Widmanstätten ferrite plates were observed and at lower strain rates, quasi polygonal ferrite was observed. The change in morphology was related to variation of carbon diffusivity and diffusion distance w.r.t strain rate. A mechanism for this transformation is proposed and shown schematically.
The third part of this study focusses on the effect of the addition of Chromium (Cr) on the dynamic transformation (DT) of austenite to ferrite at temperature above Ae3 up to 430 °C in
as-cast medium carbon low alloy steel. Calculating the driving force and the barrier energy
to the transformation, the results pointed to a fact that although Cr increases the driving force of the transformation, the barrier energy is also increased with its addition. To further understand the fundamental behind this at the atomistic level, diffusion analysis was performed by considering stress due to deformation. It was found that, with the increase in stress, the diffusivity of Cr, increased. Upon comparing the diffusion results with other alloys like carbon and silicon, it was found that the diffusivity and the diffusion distance of Cr was significantly lower than that of carbon and silicon. This finding gave an insight that with the addition of elements like Cr, the austenite matrix becomes stronger in terms of work done in shear and dilatation energy which is related to the sluggish diffusion of Cr and thereby, results as a barrier to the transformation.
The forth part of this study presents the results of the investigation on the effect of double hit deformation on Metadynamic Recrystallization (MDRX) kinetics. Ingot breakdown process often consists of several successive deformation steps with high interpass times, during which MDRX occurs. Two-stage isothermal compression tests were carried out at 1150 °C and 1200 °C with strain rates of 0.25-2 s-1 and interpass times of 5-25 s. Based on the
experimental results, a material model for MDRX is proposed. The constitutive model was implemented in Forge NxT 1.1® software to simulate the multistage compression. The
predicted results from the material model were found to be consistent with the numerical analysis and experimental results, which indicated that the proposed kinetic equations can give precise softening behavior for hot deformed as-cast medium carbon low alloy steel. Keywords: As-cast medium carbon low alloy steel, as-cast microstructure, constitutive model, FEM simulations, Forge Nxt 1.0®, Hot deformation, Dynamic transformation, diffusion, EBSD analysis, Metadynamic Recrystallization.
TABLE OF CONTENTS
Page
INTRODUCTION ...1
CHAPTER 1 LITERATURE REVIEW ...5
1.1 Casting ...5
1.2 As-cast Microstructure ...6
1.3 Bulk Metal Forming Process ...7
1.3.1 Forging ... 8
1.3.2 Closed Die ... 9
1.3.3 Open Die ... 9
1.4 Ingot Breakdown Process ...10
1.5 Iron Carbon Phase Diagram ...12
1.5.1 Transformation of Austenite ... 14
1.5.2 Displacive Transformation ... 14
1.5.3 Diffusional or Reconstructive Transformation ... 17
1.6 Softening Mechanisms during Hot Deformation ...20
1.6.1 Dynamic Recovery (DRV) ... 20
1.6.2 Recrystallization ... 21
1.6.3 Dynamic Transformation of Austenite phase ... 29
1.7 Constitutive Equations ...37
1.8 Thesis Objectives ...38
CHAPTER 2 AN APPROACH TO DEVELOP HANSEL-SPITTEL CONSTITUTIVE EQUATION DURING INGOT BREAKDOWN OPERATION OF LOW ALLOY STEELS ...41
2.1 Introduction ...41
2.2 Experimental ...42
2.3 Results ...43
2.4 Constitutive Equation of the flow stress ...44
2.5 Numerical simulation of 42CrMo hot forging ...45
2.6 Conclusions ...48
CHAPTER 3 CONSTITUTIVE MODELLING OF INGOT BREAKDOWN PROCESS OF LOW ALLOY STEELS ...49
3.1 Introduction ...50
3.2 Experimental ...51
3.3 Results and Discussions ...52
3.4 Constitutive Equation of the flow stress ...53
3.5 Numerical simulation of 42CrMo hot forging ...59
CHAPTER 4 DEFORMATION AND RECRYSTALLIZATION BEHAVIOR OF THE CAST STRUCTURE IN LARGE SIZE, HIGH STRENGTH STEEL
INGOTS: EXPERIMENTATION AND MODELING ...63
4.1 Introduction ...64
4.2 Materials and Methods ...67
4.3 Results ...70 4.3.1 As-cast microstructure ... 70 4.3.2 Flow Curves ... 72 4.4 Constitutive Equations ...75 4.4.1 Arrhenius Equation ... 75 4.4.2 Hansel-Spittel Model ... 80 4.5 Simulation ...81 4.6 Discussion ...88 4.7 Model Validation ...90 4.8 Conclusions ...96
CHAPTER 5 INFLUENCE OF STRAIN RATE ON DYNAMIC TRANSFORMATION OF AUSTENITE IN AN AS-CAST MEDIUM CARBON LOW-ALLOY STEEL ...97
5.1 Introduction ...98
5.2 Materials and Methods ...100
5.3 Results ...103
5.3.1 Stress - Strain Curves ... 103
5.3.2 Microstructure Analysis ... 106
5.4 Discussion ...110
5.4.1 Flow Curves Analysis ... 110
5.4.2 Analysis of Grain Boundary Maps ... 112
5.4.3 Influence of Strain Rate on Carbon Diffusion ... 117
5.4.4 Evaluation of the DT Ferrite Grain Size ... 122
5.5 Conclusions ...127
CHAPTER 6 ON THE ROLE OF CHROMIUM IN DYNAMIC TRANSFORMATION OF AUSTENITE ...129
6.1 Introduction ...130
6.2 Materials and methods ...131
6.3 Results and Discussions ...133
6.3.1 Stress- Strain Curves ... 133
6.3.2 Net Driving Force for Dynamic Transformation ... 134
6.3.3 Diffusion Analysis of alloying elements ... 138
6.4 New Model for Dynamic Transformation ...147
6.5 Conclusions ...148
CONCLUSION ...151
ANNEX 1 MODELING METADYNAMIC RECRYSTALLIZATION OF A DIE STEEL DURING INGOT BREAKDOWN PROCESS ...153
APPENDIX A 165 APPENDIX B 167
LIST OF TABLES
Page
Table 2.1 Composition of as-cast 42CrMo (Wt.%)...43
Table 2.2 Parameters of the Hansel-Spittel equation ...45
Table 4.1 Composition of the Alloy ...67
Table 4.2 Material constants in the Arrhenius model at strain, ε=0. 1 ...79
Table 4.3 Material constants of Hansel-Spittel model ...80
Table 4.4 Thermophysical properties of as-cast medium carbon low alloy steel used for FEM simulation ...83
Table 4.5 Values of adiabatic heating at different strain rates predicted by Hansel-Spittel model and Arrhenius model ...84
Table 5.1 Composition of as-cast medium carbon low alloy steel (Alloy A) (wt. %) ...100
Table 5.2 Temperature, Pressure Coefficients, and Material Data for Carbon in Medium Carbon Low alloy steel ...118
Table 6.1 Composition of as-cast medium carbon low alloy steel (wt. %) ...131
Table 6.2 Pipe and lattice diffusion equations ...140
Table 6.3 Temperature, Pressure Coefficients, and Material Data for Cr, Mn and Si in Medium Carbon Low alloy steel ...141
Table 6.4 Comparison between critical stresses obtained using double differentiation and the barrier energy method for HCr alloy steel ...146
Table 6.5 Comparison between critical stresses obtained the barrier energy method for LCr and HCr alloy steels ...146
LIST OF FIGURES
Figure 1.1 Schematic of microstructure zone formation in castings (Maidorn et Blind,
1985) ...5
Figure 1.2 Different types of macrosegregation found in cast ingot (Pickering, 2013) ...7
Figure 1.3 Forging Process in 5000-ton capacity press ...8
Figure 1.4 Schematic of Closed Die Forging process ...9
Figure 1.5 Schematic of Open Die Forging process (Nakao et Miura, 2011) ...9
Figure 1.6 Illustration of ϒ solvus line in Fe-C phase diagram. (http://www.calphad.com/iron-carbon.html)...11
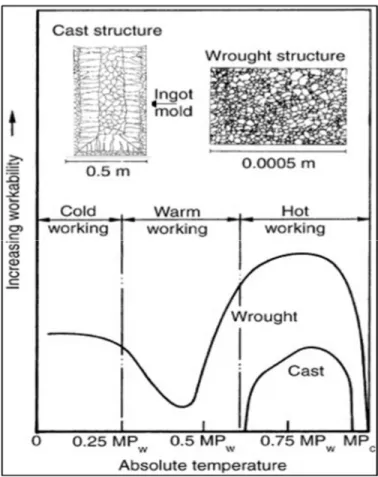
Figure 1.7 Schematic of relative workability of cast metals and wrought metals at cold, warm, and hot working temperatures. The melting point is denoted as MPc (cast metals) or MPw (wrought metals) (Dieter, Kuhn et Semiatin, 2003) ...12
Figure 1.8 Schematic of displacive mechanism ...15
Figure 1.9 Microstructure of plate martensite in Fe–1.86 wt.% C alloy (Krauss, 1999) ...16
Figure 1.10 Nucleation of primary and secondary Widmanstätten ferrite (Bhadeshia, 2010b) ...17
Figure 1.11 Schematic of reconstructive mechanism ...18
Figure 1.12 Nucleation of allotriomorphic and idiomorphic ferrite. (Bhadeshia, 2010a) ...19
Figure 1.13 Representation of pearlite formation showing ...19
Figure 1.14 Diagram showing various stages of the recovery process (Rollett et al., 2004) ...20
Figure 1.15 True stress–strain curves of 20MnNiMo steel under strain rate of 10 s-1 (Wang et al., 2013) ...21
Figure 1.16 Flow curve showing DRX at high and low strain rate (Montheillet et Jonas, 1996) ...24
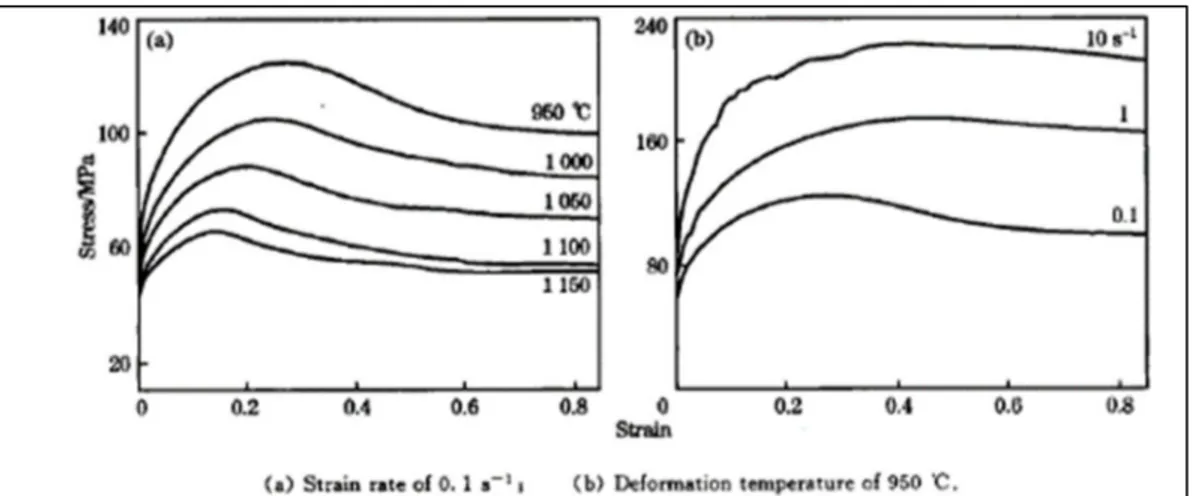
Figure 1.17 True stress- strain curves at different deformation temperatures and deformation rates of 38MnVS forging steel (ZHANG et al., 2013) ...24
Figure 1.18 Illustration of DRX on grain boundaries (a)-(e) (Humphreys et Hatherly) ...25 Figure 1.19 Dynamic recrystallization at prior grain boundaries (a) for Ultra High
Purity and (b) for High Purity in Type 304 Austenitic Stainless Steels
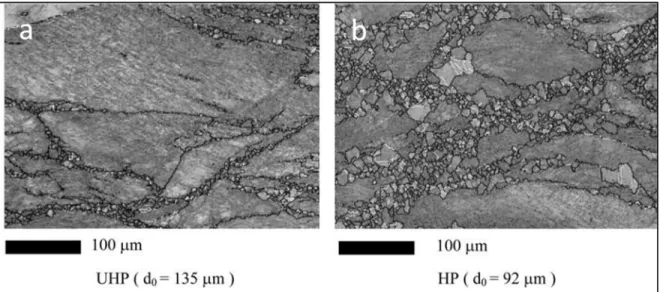
(El Wahabi et al., 2005) ...26 Figure 1.20 Orientation image mapping of UHP and HP at deformation equal to
1 deformed at 850°C: (a) with big initial grain size; and (b) small initial
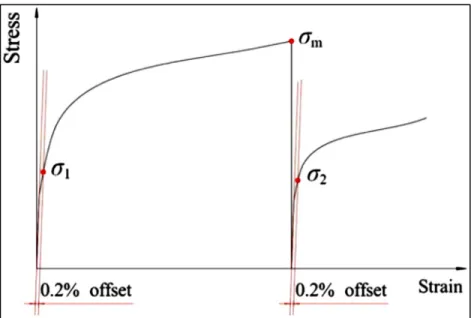
grain size. Black lines: grain boundaries; gray lines: subgrain boundaries and white lines: twin boundaries (El Wahabi et al., 2005) ...27 Figure 1.21 Determination of the metadynamic softening fraction using the 0.2% offset
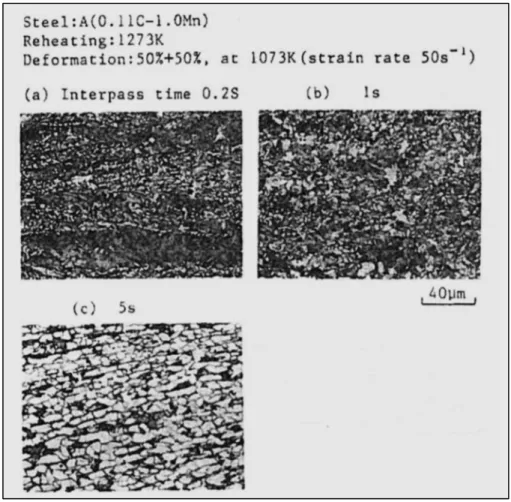
stress method (Liu et al., 2013) ...29 Figure 1.22 Effect of interpass time on the microstructure of steel after 2 pass hot
deformation (Matsumura et Yada, 1987) ...30 Figure 1.23 Schematic diagram of in-situ X-ray experimental setup (Yada, Li et
Yamagata, 2000) ...31 Figure 1.24 Typical X-ray diffraction patterns (a) before heating, (b) at the austenitizing
temperature (790 ºC), and (c) on the application of torsional deformation at 720 ºC (i.e. paraequilibrium Ae3 + 40 ºC) temperature (Yada,
Li et Yamagata, 2000) ...32 Figure 1.25 Scanning electron micrograph of a specimen deformed to a strain of 0.5 at
4 s‐1 at 753 °C (Ae3+20 °C). The deformed and quenched specimen
contains Widmanstätten ferrite, cementite and martensite
(Ghosh et al., 2013b) ...33 Figure 1.26 Appearance of a colony of DT Widmanstätten plates in an IQ map of
0.09C– 0.036Nb steel; (a) IPF map of the Widmanstätten plates and (b) EBSD, showing the small misorientations between the plates
(Ghosh et al., 2013b) ...33 Figure 1.27 Estimated mean diffusion distances of (a) C and (b) Mn in ferrite over the
experimental temperature range (Ghosh et al., 2013b) ...34 Figure 1.28 (a) A rectangle of prior austenite is transformed into a parallelogram of
Widmanstätten ferrite as a result of application of a shear stress. The dilation (shown exaggerated) takes place in a direction perpendicular to the habit plane. (b) The geometry associated with the formation of
a pair of “self-accommodating” plates (Jonas et Ghosh, 2013) ...36 Figure 1.29 (a) Comparison of the Gibbs energies of deformed and undeformed austenite
with that of undeformed ferrite at temperatures above the Ae3. Deformation
unstable ferrite, leading to the occurrence of dynamic transformation. (b) The effect of mechanical activation on dynamic transformation
(Jonas et Ghosh, 2013) ...37 Figure 2.1 Flow curves of 42CrMo at strain rate of (a) 0.25 s-1 and (b) 2 s-1 ...45
Figure 2.2 Simulated temperature distribution map of 42CrMo at strain rate of
(a) 0.25 s-1 and (b) 2 s-1 at deformation temperature of 1200 °C ...47
Figure 2.3 Force versus time plot of experimental and predicted at strain rate
(a) 0.25 s-1 and (b) 2 s-1 at deformation temperature of 1200 °C. ...48
Figure 3.1 Experimental flow curves at a temperature of 1473K and 1423K at strain rate of (a) 0.25 s-1 and (b) 2 s-1. (c) Typical flow stress curve at the
elevated temperature (Lin, Chen et Zhong, 2008a) ...53 Figure 3.2 Relationship of (a) ln(σ) and ln( ), (b) σ and ln ( ) ...57 Figure 3.3 Relationship of (a) ln sinh(ασ) and ln( ), (b) Ln sinh(ασ) and 1/T ...57 Figure 3.4 Polynomial fit of variation of (a) lnA, (b) Q, (c) α and (d) n with strain ...58 Figure 3.5 Predicted and Experimental flow curves of 42CrMo at a strain rate of
(a) 0.25 s-1 and (b) 2 s-1 ...59
Figure 3.6 Simulated temperature distribution map of 42CrMo at a strain rate of
(a) 0.25 s-1 and (b) 2 s-1 at a deformation temperature of 1200°C ...61
Figure 3.7 Force versus time plot of experimental and predicted at strain rate
(a) 0.25 s-1 and (b) 2 s-1 at a deformation temperature of 1200 °C ...62
Figure 4.1 Schematic illustration depicting the position of the sample in the industrial sized ingot ...67 Figure 4.2 Schematic diagram of thermomechanical schedule for hot compression
tests of as-cast medium carbon low alloy steel ...69 Figure 4.3 Schematic diagram of three thermocouples placed at different regions
of the sample for precise measurement of holding time ...69 Figure 4.4 Initial macrostructure of as-cast medium carbon low alloy steel in the
columnar region. The macrostructure consists of large sized dendrites ...70 Figure 4.5 EBSD grain boundary map of initial microstructure of as-cast medium
carbon low alloy steel. Black lines represent HAGBs. The microstructure can be observed with no grain boundaries ...71
Figure 4.6 Comparison of repeated hot deformation tests at 1473K (1200 °C) and strain rate of 0.25 s-1 in order to observe the differences due to coarse
microstructure...72 Figure 4.7 Stress-strain curves of as-cast medium carbon low alloy steel during hot
isothermal compression at strain rates of 0.25 s-1, 0.5 s-1, 1 s-1 and 2 s-1 at
deformation temperatures of (a) 1473K (1200 °C), (b) 1423K (1150 °C), (c) 1373K (1100 °C) and (d) 1323K (1050 °C) ...74 Figure 4.8 Typical stress-strain curve of wrought 42CrMo steel under different
deformation temperatures and strain rates ...75 Figure 4.9 Relationship between (a) lnσ vs ln and (b) σ vs ln at a strain of 0.10 and
deformation temperatures of 1473K (1200 °C), 1423K (1150 °C), 1373K (1100 °C) and 1323K (1050 °C) of as-cast medium carbon low alloy steel ....77 Figure 4.10 Relationship between (a) ln ℎ - (b) ln ℎ -1 at a strain of
0.10 and deformation temperatures of 1473K (1200°C), 1423K (1150 °C), 1373K (1100 °C) and 1323K (1050 °C) of as-cast medium carbon
low alloy steel...77 Figure 4.11 Polynomial fit of order 6 of variation of (a) n, (b) Q, (c) lnA and (d) α
for hot compressed as-cast medium carbon low alloy steel. Black lines
denote experimental data and red line denotes polynomial data ...78 Figure 4.12 Graph of polynomial fit order (m) vs. activation energy, depicting the
experimental and predicted values of activation energy, Q at a strain
of 0.05 ...79 Figure 4.13 Comparison of flow curves between experimental and constitutive model
predicted flow stress data for hot compressed as-cast medium carbon low alloy steel at a temperature of (a) 1200 °C, (b) 1150 °C, (c) 1100 °C and (d) 1050 °C. Continuous black line denotes experimental data, filled symbols denote Hansel-Spittel model data and blank symbols denote
Arrhenius model data ...82 Figure 4.14 Simulated temperature distribution map of as-cast medium carbon low
alloy steel predicted by Hansel-Spittel model at deformation temperature of 1150 °C and at a strain rate of (a) 0.25 s-1 and (b) 2 s-1. Force versus time
plot of experimental and predicted (Hansel-Spittel model) at a deformation temperature of 1150 °C and at strain rates of (c) 0.25 s-1
and (d) 2 s-1 ...86
Figure 4.15 Simulated temperature distribution map of as-cast medium carbon low alloy steel predicted by Arrhenius model at deformation temperature of 1150 °C and at a strain rate of (a) 0.25 s-1 and (b) 2 s-1. Force versus
time plot of experimental and predicted (Arrhenius model) at a
deformation temperature of 1150 °C using and strain rate of (c) 0.25 s-1
and (d) 2 s-1 ...87
Figure 4.16 EBSD grain boundary map of as-cast medium carbon low alloy steel deformed at (a) 1473K (1200 °C), 0.25 s-1 and (b) 1473K (1200 °C),
2 s-1. Black lines denote HAGBs and red lines denote LAGBs ...89
Figure 4.17 Comparison of flow curves between experimental and predicted flow stress data at deformation temperature and strain rate of (a) 1180 ºC, 0.8 s-1
and (b) 1000 °C, 0.05 s-1 ...91
Figure 4.18 Simulated temperature distribution map of as-cast medium carbon low alloy steel at deformation temperature of 1000 °C and at a strain rate of 0.05 s-1 for (a) Hansel-Spittel model and (b) Arrhenius model. Force
versus time plot of experimental and predicted at a strain rate of 0.05 s-1
and at a deformation temperature of 1000 °C using (c) Hansel-Spittel
model and (d) Arrhenius model ...92 Figure 4.19 Simulated temperature distribution map of as-cast medium carbon low
alloy steel at deformation temperature of 1180 °C and at a strain rate of 0.8 s-1 for (a) Hansel-Spittel model and (b) Arrhenius model. Force
versus time plot of experimental and predicted at a strain rate of 0.8 s-1
and at a deformation temperature of 1180 °C using (c) Hansel-Spittel
model and (d) Arrhenius model ...93 Figure 4.20 Correlation between the experimental and predicted flow stresses obtained
from (a) Hansel-Spittel model and (b) Arrhenius model ...95 Figure 4.21 The absolute average error for the Arrhenius-type and Hansel-Spittel
model at various strains for hot compressed as-cast medium carbon
low alloy steel...95 Figure 5.1 Schematic diagram of thermomechanical schedule for hot compression
tests of as-cast medium carbon low alloy steel ...101 Figure 5.2 EBSD of initial microstructure of as-cast medium carbon low alloy steel
in the columnar region. No specific grain boundaries can be observed
in the microstructure. Black lines denote high angle grain boundaries ...102 Figure 5.3 EBSD grain boundary map of as-cast medium carbon low alloy steel
after austenizing at 1260 °C and then cooling to 1200 °C after which it was water quenched. Black lines denote HAGBs and red lines
Figure 5.4 Stress-strain curves of as-cast medium carbon low alloy steel during hot isothermal compression at strain rates of 0.25 s-1, 1 s-1 and 2 s-1 at
deformation temperatures of (a) 1200 °C, (b) 1150 °C ...104 Figure 5.5 The double differentiation method employed in determination of the
critical stresses and strains for DT and DRX. This experiment was carried out at 1200 °C and strain rate of 0.25s-1 ...105
Figure 5.6 Critical stresses for dynamic transformation (DT) and dynamic
recrystallization (DRX) determined over the temperature of 1150 °C to
1200 °C and strain rate of 0.25 s-1 to 2 s-1 ...106
Figure 5.7 EBSD grain boundary map of as-cast medium carbon low alloy steel deformed at deformation temperature of 1200 °C at strain rate of
(a) 0.25 s-1, (b) 1 s-1 and (c) 2 s-1. Black lines denote HAGB and red lines
denote LAGB ...108 Figure 5.8 EBSD grain boundary map of as-cast medium carbon low alloy steel
deformed at deformation temperature of 1150 °C and strain rate of (a) 0.25 s-1, (b) 1 s-1 and (c) 2 s-1. The black encircled region shows the
disintegration of the Widmanstätten plate at high strain rate. Black lines
denote HAGB and red lines denote LAGB. ...109 Figure 5.9 ∆ ( − ) vs T for medium carbon low alloy steel showing the Gibbs
energy obstacle opposing dynamic transformation ...112 Figure 5.10 Schematic diagram showing (a) misorientation between a grain at the
center and all other points at the perimeter of the kernel and (b) misorientation between a grain at the center and all points
in the kernel ...113 Figure 5.11 EBSD Kernal Average Map (KAM) of as-cast medium carbon low alloy
steel deformed at deformation temperature of 1200 °C at strain rate of
(a) 0.25 s-1, (b) 1 s-1 and (c) 2 s-1. Black lines denote HAGB ...115
Figure 5.12 Graph of Kernal Average Misorientation fraction (KAM ˂2º) vs. Ln Z. The graph reveals the effect of strain rate and temperature on
ferrite fraction ...116 Figure 5.13 Graph depicting diffusivity due to lattice diffusion, pipe diffusion and
effective diffusion with regard to strain for 1200 °C and 0.25 s-1. Due to
the absence of stress, DL is constant throughout the strain values ...119
Figure 5.14 Graph depicting Diffusivity due to pipe diffusion vs strain for
Figure 5.15 Graph depicting diffusion distance of carbon atom with respect to the
strain for deformation temperature of 1200 ºC and 0.25 s-1 ...121
Figure 5.16 Graph depicting diffusion distance of carbon w.r.t strain for (a) 1200ºC
and (b) 1150ºC ...121 Figure 5.17 The variation of diffusion distance, x (m) due to pipe diffusion
coefficient vs. deformation time, t (sec) for (a) 0.25 s-1 and (b) 2 s-1 ...122
Figure 5.18 Graph depicting correlation of grain size and diffusion distance
w.r.t the strain rate for (a) 1200 ºC and (b) 1150 ºC ...125 Figure 5.19 Schematic depicting the hypothesis to relate G.S. (grain size) and
x (diffusion distance of carbon) for the strain rate of (a) 0.25 s-1 and
(b) 2 s-1. Red arrows represent diffusion of carbon atoms from the
Widmanstätten grains (dashed lines)...126 Figure 6.1 Schematic diagram of thermomechanical schedule for hot compression
tests of medium-carbon low-alloy steel (HCr) ...132 Figure 6.2 Stress-strain curves of medium carbon low-alloy steel during hot
isothermal compression at strain rate of 1 s-1 at deformation temperatures
of 1200 °C and 1150 °C ...133 Figure 6.3 Driving force calculations for (a) HCr alloy steel and (b) LCr alloy steel.
The driving force is calculated by subtracting the ferrite yield stress from the austenite flow stress at critical strain of 0.1 ...135 Figure 6.4 ΔG(α-γ) vs ΔT (deformation temperature-1100 °C) for HCr alloy steel and
LCr alloy steel, showing the Gibbs energy obstacle opposing dynamic
transformation ...137 Figure 6.5 Graph depicting the driving force (DF), total barrier energy (TBE) and
Net driving force for HCr alloy steel and LCr alloy steel at deformation
temperatures of (a) 1200 °C and (b) 1150 °C ...138 Figure 6.6 Graph depicting diffusivity due to pipe diffusion vs. strain for (a) C
and Si, (b) Mn and (c) Cr at deformation temperatures of 1200 °C
and 1150 °C for HCr alloy steel ...142 Figure 6.7 Graph depicting diffusion distance of (a) C and Si and (b) Mn and Cr,
vs. strain for deformation temperatures of 1200 ºC and 1150 ºC for
Figure 6.8 EBSD grain boundary map of HCr alloy steel deformed at deformation temperature of 1200 °C and strain rate of 1 s-1. The HAGBs are shown in
black and LAGBs are shown in red ...144 Figure 6.9 Graph depicting effect of addition of Cr on work done by shear
accommodation and dilatation of austenite matrix for HCr alloy steel and LCr alloy steel at deformation temperatures of 1200 °C and
1150 °C ...145 Figure 6.10 Schematic diagram of the DT phenomenon. The austenite matrix
(a) when subjected to hot deformation at 1200 °C and 1150 °C, leads to the diffusion of alloying elements like C and Si, whereas, Cr and Mn stay in the matrix due to sluggish diffusivity (b). After shear
accommodation and dilatation (c), the austenite matrix is converted into Widmanstätten ferrite (W. Ferrite) (d), which starts to nucleate from prior austenite grain boundary (PAGB) (e). Due to the effect of stress w.r.t. to strain rate, the Widmanstätten ferrite starts to grow and at slow strain rate (SSR) (f), Quasi polygonal ferrite (QPF) and at high
LIST OF ABREVIATIONS DRV Dynamic Recovery DRX Dynamic Recrystallization DT Dynamic Transformation MDRX Metadynamic Recrystallization Tm Melting Point in ˚C
BCC Body Centered Cubic
FCC Face Centered Cubic
BCT Body Centered Tetragonal
SFE Stacking Fault Energy
HAGB High Angle Grain Boundary
LAGB Low Angle Grain Boundary
EBSD Electron Back Scattered Diffraction
G.S. Grain Size
TMCP Thermomechanical Controlled Processing
FEM Finite Element Modeling
R Correlation coefficient
ARRE Average absolute relative error
KAM Kernel average misorientation
FEG-SEM Field Emission Gun-Scanning Electron Microscope
GB Grain Boundary
LIST OF SYMBOLS
Symbol Description Unit
Austenite α Ferrite Delta Ferrite T Temperature ˚C Strain Rate s-1 Strain Stress MPa A, m1, m2, m3, m4, m5, m6, m7, m8, m9
Parameters of the Hansel-Spittel equation
∆ Change in temperature
Area under the uncorrected stress- strain curve
Density Kg/m3
Cp Specific heat J/Kg/°K
Zener – Hollomon parameter
Q Activation energy KJmol-1
R Universal gas constant 8.314Jmol-1K-1
A, n1, n, α, β Arrhenius Equation Material Constants
∆ Absolute average error
Experimental flow stress MPa
Predicted flow stress MPa
Average values of experimental flow stress Average values of predicted flow stress Flow stress at the end point in the first hit deformation
MPa The offset yield flow stress for the first hit MPa The offset yield flow stress for the second hit MPa
Metadynamic softening fraction %
t Interpass time s
n Material dependent constant
. Time for metadynamic softening fraction of
50%
s
θ Strain hardening rate
Effective diffusion
DL Lattice diffusion coefficients
DP Pipe diffusion coefficients
Fraction of atoms participating in the lattice diffusion processes
diffusion processes
µ Shear modulus MPa
b Burgers vector m
Bulk Modulus MPa
Pressure Dependence Temperature Dependence
∗ Activation Volume
Pre-Exponential of pipe diffusion, Activation energy of pipe diffusion Pre-exponential of lattice diffusion for Carbon
INTRODUCTION
During the last 30 years a large number of structural components such as bumpers, dashboards, rear doors, etc. have been produced using plastic injection or plastic extrusion technologies. Metallic dies, made of high strength steels are generally used to fabricate molds and die (Lin, Chen et Zhong, 2008e). In recent years there has been a continuous demand for larger components by the transport industry and as a result, larger and larger dies need to be produced. The die manufacturing starts with casting process where liquid metal is transformed into an ingot. During the casting process, there is temperature gradient between the liquid metal and the mold which leads to the formation of inhomogeneities in the microstructure such as chill zone, columnar zone and equiaxed zone. In addition to it, when the metal solidifies in the mold, segregation of the alloying elements occurs which leads to lower or higher concentration of elements. The segregation occurs usually at the center and top regions of the ingot. These imperfections become more significant when manufacturing larger dies and molds for which, even larger cast ingots must be produced. With the increase in the size of ingot, there is also an increase in inhomogeneity of microstructure (as-cast structure) and chemical composition (segregation) (Moore et Shah, 1983). The presence of these inhomogeneities leads to low workability of the cast ingot structure. Improper selection of deformation parameter can lead to initiation of cracks along the grain boundaries. In order to break these inhomogeneities, ingot breakdown process is done, in which, the ingot is deformed by repetitive blows at temperatures around 0.75 of the melting point. Deformation at lower temperatures may lead to precipitation of the alloying elements which tend to pin the dislocations, thereby causing grain boundary failure. On the other hand, deformation at temperatures near to the melting point may cause local melting and grain boundary cracking. The local melting may further be promoted at higher strain rates due to deformation heating. Therefore, as-cast structures have a short window of workability and accurate parameters are necessary in order to deform them to wrought structure components.
During hot working of metals specifically, steels, various dynamic and static softening mechanisms occur. The processes that occur during deformation are termed as dynamic process, whereas, those that occur between intervals of deformation or after deformation is completed, are termed as static processes. Dynamic softening process like dynamic recovery, dynamic recrystallization, meta dynamic recrystallization and dynamic transformation, occur during the deformation at high temperatures. Dynamic recovery results from the annihilation of dislocations due to ease of cross slip, climb, and dislocation unpinning at the hot working temperature. During the recovery process, subgrains are formed which act as sinks for moving dislocations. These subgrains have low misorientations across their boundaries and are usually located within primary grains. The stress-strain curve for a metal undergoing dynamic recovery shows an increase in flow stress up to a steady-state value that corresponds to the development of a steady state substructure. In some alloys e.g. steel, where dynamic recovery occurs at a lower rate, dislocation climb is difficult. This leads to higher densities of dislocations in some grains. With the increase in temperature, the grain boundary mobility is also increased. Therefore, the difference in the dislocation density in grains coupled with higher grain boundary mobility leads to the nucleation and growth of strain free grains. This process is termed as discontinuous dynamic recrystallization (DDRX) (Rollett et al., 2004).
Metadynamic recrystallization (MDRX) occurs during the time interval between hot deformation steps or at the end of the deformation process. During MDRX, the nuclei formed due to DDRX undergo a very rapid growth. In recent years, another softening mechanism which occurs in steels known as dynamic transformation (DT) of austenite has gained tremendous attention. It is well known that austenite can be readily transformed into ferrite during deformation between the Ae3 and Ar3 temperatures. This phenomenon is referred to as
“Dynamic Strain Induced Transformation” (DSIT) (Beladi et al., 2004) and is an effective means for the production of ultrafine ferrite microstructures (Choo et al., 2001; Dong, 2001). But in the case of the dynamic transformation of austenite above the Ae3, DSIT also involves
ferrite formation during deformation. It has been observed that ferrite nucleation occurs continuously during straining (Zheng et al., 2009) and leads to the formation of Widmanstätten Ferrite (WF).
The softening mechanisms explained briefly above have been studied mainly for wrought structured alloys and very limited research is available on the effects of these mechanisms on the mechanical behavior of as-cast structured alloys. Considering the importance of the evolution of the as-cast structure on the mechanical properties of the final component and the lack of information in this domain, the focus of the present study will be on the effect of hot deformation parameters on fundamental softening mechanisms governing microstructure evolution of medium carbon low alloy steels.
There are very few studies which focus on the development of precise models for predicting the flow behavior of as-cast structures and using them in FEM simulations in order to optimize the forging parameters of large components. Therefore, the design of the thermomechanical process in order to better engineer the starting as as-cast structure, of the medium carbon low alloy steel, is another objective of the present thesis.
The present thesis is organized into 7 chapters as detailed below:
1. Chapters 2 and 3 focus on the development of constitutive models for as-cast structured medium carbon low alloy steels. Arrhenius and Hansel-Spittel models are two phenomenological models which are extensively used to predict stress-strain curves. Hansel-Spittel model with FEM software has been used by many researchers for wrought alloys, whereas Arrhenius model has been used only to predict stress-strain curves and never been used to simulate using FEM simulation.
2. Chapter 4 focusses on the softening behavior of as-cast medium carbon low alloy steel and the microstructure evolution due to hot compression process. The chapter also provides a detailed comparison between two models already developed in Chapters 2 and 3 and thus provides the best model to predict stress-strain curves as well as FEM simulation of the process.
3. Chapter 5 discusses microstructure evolution due to Dynamic Transformation of austenite in as-cast structures which is reported for the first time. The study proves the presence of ferrite in the microstructure of the hot deformed samples in the austenitic regions by various techniques. The study shows the effect of strain rate on the diffusion of carbon and its resulting effect on the microstructure. This study provides a novel model of dynamic transformation of austenite with the support of microstructure and diffusional analysis.
4. Chapter 6 brings original information on the effect of addition of Chromium on the dynamic transformation of austenite. In all previous studies done, no study involves the effect of addition of Chromium on the kinetics of DT. The present study successfully correlates with the driving force model considering the effect of elements like Chromium, Silicon, and Manganese on the phenomenon of DT with the diffusional study of each contributing element.
5. Annex I focus on the effect of double hit deformation on Metadynamic Recrystallization (MDRX) kinetics. Ingot breakdown process often consists of several successive deformation steps with high interpass times, during which MDRX occurs. Two-stage isothermal compression tests were carried out at 1150 °C and 1200 °C with strain rates of 0.25-2 s-1 and interpass times of 5-25 s. Based on the experimental
results, a material model for MDRX is proposed. The constitutive model was implemented in Forge NxT 1.1® software to simulate the multistage compression. The
predicted results from the material model are found to be consistent with the numerical analysis and experimental results, which indicated that the proposed kinetic equations can give precise softening behavior for hot deformed as-cast medium carbon low alloy steel.
CHAPTER 1 LITERATURE REVIEW 1.1 Casting
It is a unique metal forming process which has the capability to produce complex components of an alloy. Different types of casting process like sand casting, investment casting, die casting etc. are used for manufacturing different types of shapes and sizes of a workpiece according to their desired applications. Most of the alloys solidify with dendritic structures in a mold. When the molten metal comes in contact with the walls of the mold, small equiaxed grains, or the chill crystals, start to form, as shown in Fig. 1.1 (Maidorn et Blind, 1985).
Figure 1.1 Schematic of microstructure zone formation in castings
The undercooling of the melt is reduced by the latent crystallization heat, which is liberated from the crystallizing metal which depresses fast grain growth. Due to this, some grains start to grow in the direction opposition to the direction of the heat flow, thus resulting in columnar grains. Further cooling of the molten metal in the central area causes a formation of large equiaxed grains.
1.2 As-cast Microstructure
During the solidification of molten metal in the mold, various physical and chemical processes occur. These processes are explained as below:
• The elements have different solubility in solid and liquid phases which is entirely temperature dependent.
• Reactions between metal, slag, and gases.
• Temperature gradient in horizontal and vertical direction. • Shrinkage during solidification and further cooling of molds.
These phenomenon during solidification cause segregation. The segregation may be microscopic or macroscopic regions of the ingot having different a chemical composition, non-metallic inclusions and cavities, cracks, pores etc. (Maidorn et Blind, 1985). Due to macrosegregation, various patterns are observed in the ingot like “A” segregation, “V” segregation, Negative segregation, Hot top segregation etc. (Fig. 1.2).
Figure 1.2 Different types of macrosegregation found in cast ingot (Pickering, 2013)
1.3 Bulk Metal Forming Process
Metal forming process consists of series of deformation steps in which a metal billet or blank, received after casting is shaped by tools or dies. The pattern and mastery of such processes depend on an understanding of the features of the workpiece material, the conditions at the tool/workpiece interface, the mechanics of plastic deformation (metal flow), the equipment used, and the finished-product requirements (Hurtuk). These elements determine the choice of tool geometry and material as well as processing conditions (e.g., workpiece and die temperatures and lubrication). Due to the complexity of many metalworking operations, analytical, physical, or numerical models are often relied upon to design such processes. Metal-forming processes are usually classified according to two broad categories:
• Bulk, or massive, forming operations • Sheet forming operations
In both of these processes, the surfaces of the deforming metal and the tools are in contact. The friction between the metal and the tool have a major influence on material flow during deformation. In bulk forming process, the input material is in billet, rod, or slab form, and the surface to volume ratio in the formed part increases considerably under the action of high compressive loading. Whereas, in the sheet forming process, a piece of sheet metal is plastically deformed by tensile loads into a 3D shape, often without significant changes in sheet thickness (Dieter, Kuhn et Semiatin, 2003).
1.3.1 Forging
It is a bulk deformation process in which the shape of a material is changed by squeezing i.e. with a mechanical or hydraulic press or by hammering (Fig. 1.3). The deformation breaks down the cast microstructure and the resultant directional alignment of the fiber make the forged ingot stronger and more ductile than casting process which results in greater resistance to shock and fatigue (Dieter, Kuhn et Semiatin, 2003). Forging is basically of two types, Closed Die forging and Open Die Forging.
1.3.2 Closed Die
The forging partially closes the workpiece material and thus restricts the flow of the metal. Fig. 1.4 illustrates the closed die forging process. The hot metal is enclosed in the dies of a predefined shape (Step 1). The force is applied to the dies to give the impression to the hot metal (Steps 2 & 3).
Figure 1.4 Schematic of Closed Die Forging process
1.3.3 Open Die
The hot metal is squeezed or hammered between flat, V-shaped or circular dies. The metal flow is not completely restricted due to the fact that the work piece is not enclosed as shown in Fig. 1.5. Open die forging is usually used when the size of the forging is too large to be produced in a closed die.
Figure 1.5 Schematic of Open Die Forging process (Nakao et Miura, 2011)
1.4 Ingot Breakdown Process
In order to break down the initial cast microstructure which is composed of the chill zone, columnar zone, and equiaxed zone, to wrought structure, open die forging is used to deform the large ingot into a short wide ingot by the action of repetitive die blows. This process is known as ingot breakdown process (Dieter, Kuhn et Semiatin, 2003). This process not only converts large, non-uniform grains (cast microstructure) to wrought microstructure but also is useful for reducing chemical heterogeneities present due to segregation of various elements due to diffusion process of alloying elements. In the case of steels, the ingot breakdown process is usually conducted in the austenite phase (Fig. 1.6). The operation consists in heating the ingot and held for ~24hrs in a furnace to about 1260 °C. It is then transferred to the forging press where through a multi-hit process incremental deformation is applied to the ingot. Due to this, various microstructural changes occur, like dynamic softening such as dynamic recovery (DRV), dynamic recrystallization (DRX), dynamic transformation (DT) and metadynamic recrystallization, MDRX. To attain the final shape of the ingot, deformation is done along the various axis of the ingot.
During the ingot breakdown process, the ingot is deformed above the 0.75Tm (Tm = Melting
Point in °C) as shown in Fig. 1.7, to reduce the forging load. Forging at low temperatures may lead to precipitation of carbides that pin matrix dislocations and cause grain boundary failure.
Figure 1.6 Illustration of ϒ solvus line in Fe-C phase diagram. (http://www.calphad.com/iron-carbon.html)
Figure 1.7 Schematic of relative workability of cast metals and wrought metals at cold, warm, and hot working temperatures.
The melting point is denoted as MPc (cast metals) or MPw (wrought metals)
(Dieter, Kuhn et Semiatin, 2003)
1.5 Iron Carbon Phase Diagram
Fig. 1.6 shows the Iron-Carbon phase diagram, showing the equilibrium phases that are present at each temperature. Upon heating pure iron to 910 °C, the crystal structure transforms from body-centered cubic (BCC) to the face-centered cubic (FCC) structure known as austenite or γ iron. This structure or phase of iron is fully austenitic up to 1390 °C. Above 1394 °C, the FCC structure of iron transforms back into the BCC structure, known as δ iron, which remains ferritic until it melts at 1538 °C. The austenitizing temperature lowers
down to 723 °C upon the addition of carbon as an alloying element when it nears the eutectoid point with 0.8 wt.% carbon content.
Some important boundaries at single-phase fields have been given special names. These include:
• A1: Eutectoid temperature, which is the minimum temperature for austenite.
• A3: The lower-temperature boundary of the austenite region at low carbon contents;
i.e., the gamma/gamma + ferrite boundary.
• Acm: The counterpart boundary for high-carbon contents; i.e., the gamma / gamma +
Fe3C boundary (Bhadeshia, 2002).
Sometimes the letters c, e, or r are included e.g. Ae1 or Ae3.
The boundary between the initial formation of ferrite and pure austenite is known as the Ae3
temperature, which is a very important temperature in the present study. As the temperature slowly decreases, all the austenite transforms into a ferrite + pearlite microstructure at the Ae1 temperature or 723 °C. Pearlite microstructure consists of a lamellar structure of ferrite
and cementite (Fe3C). The maximum solubility of carbon in the ferrite and austenite phase is
0.02 wt.% and 2.14 wt.% respectively. This solubility limit depends on the crystal structure and the conditions of the interstitial sites available for the carbon atoms to fill.
The addition of other alloying elements significantly changes the Fe-C phase diagram, especially with regard to the constancy of the ferrite and austenite phases. The concentration of these alloying elements results in the shifting of phase boundaries. Alloying elements such as C, Co, Cu, Mn, N, and Ni are known as the austenite stabilizers. They lower the eutectoid temperature and widen the range of temperature over which the austenite phase is stable. In contrast, alloying elements such as Al, Cr, Mo, Si, and W are known as ferrite formers, increase the eutectoid temperature thereby restricting the formation of the austenite phase. The addition of alloying elements also improves material properties such as the corrosion resistance (Aranas Jr et Jonas, 2015).
This kind of the phase diagram is usually determined based on orthoequilibrium conditions. This involves the diffusion of both the substitutional and interstitial atoms (Ortho-equilibrium) (Hillert et Ågren, 2004) during transformation, which usually takes a considerable amount of time. It has been found that the diffusional movement of interstitial elements such as C and N is orders of magnitudes faster than that of the substitutional elements (Hillert et Ågren, 2004). On the other hand, paraequilibrium is a condition where only partial equilibrium is attained (Hultgren, 1947). In this situation, only the interstitial elements are able to partition due to time limitations. The paraequilibrium temperatures are lower than the orthoequilibrium temperatures by about 5 °C to 30 °C, depending on the alloying element. In the present work, transformation occurs under paraequilibrium conditions.
1.5.1 Transformation of Austenite
As discussed above, Fe-C equilibrium phase diagram gives the phases which are present due to equilibrium cooling conditions. For most of the applications, the material is cooled under non-equilibrium conditions in order to modify the mechanical properties. Due to this, actual cooling rates may be too fast for actual equilibrium to be achieved and various types of microstructures are developed in many alloys, specifically steels. Due to this, various non-equilibrium phases are formed. The development of microstructure in steels can be divided into two types of mechanism; i) displacive and ii) diffusional. These are described briefly:
1.5.2 Displacive Transformation
Austenite as a parent crystal structure transforms to another crystal structure by deformation without any diffusion of atoms taking place (Fig. 1.8). Deformation rate will change the parent crystal structure to product crystal structure. There is invariant plain strain shape deformation with a large shear component. Examples of this transformation are Widmanstätten ferrite, bainite or acicular ferrite and martensite.
Figure 1.8 Schematic of displacive mechanism
1.5.2.1 Martensite
Martensite is a non-equilibrium phase structure formed by rapid cooling or quenching austenite to a low temperature. It is formed by a diffusionless or displacive transformation. The initial FCC austenite undergoes polymorphic transformation to the body-centered tetragonal (BCT) martensite phase. This transformation increases the volume because the austenite is denser than the martensite. High cooling rates prevent the carbon atoms from diffusing, thus inhibiting the formation of ferrite or cementite. Martensite has supersaturated solid solution of carbon due to the fact that the carbon atoms remain in the interstices thus causing lattice strain and distortion.
Martensite is brittle and is considered as the hardest phase of steel with needle-like grains. Fig. 1.9 shows an example of martensite taken from an optical microscope. The toughness can be recovered by tempering the as-quenched martensite between 250 °C – 600 °C. The microstructure transforms into tempered martensite with better mechanical properties (Krauss, 1999).
Figure 1.9 Microstructure of plate martensite in Fe–1.86 wt.% C alloy (Krauss, 1999)
1.5.2.2 Widmanstätten Ferrite
Widmanstätten ferrite consists of long and thin, pointed plates of ferrite which involve the simultaneous growth of pairs of plates as shown in Fig. 1.10. It is usually nucleated at high temperatures, usually just below the Ae3 temperature. The development and length of the
ferrite plate depend on the paraequilibrium condition of carbon diffusion in the austenite. The ferrite plates which nucleate on an austenite grain boundary, are known as primary
Widmanstätten ferrite and the ones which form from allotriomorphic ferrite (Sec 1.5.3.1 and
Fig. 1.12), are known as secondary Widmanstätten ferrite. The plates grow by diffusion control mechanism, but they nucleate by a displacive mechanism. Fig. 1.10 illustrates the nucleation of Widmanstätten ferrite according to these two types of transformation (Bhadeshia, 2010b). A part of the present work is also concerned with the formation of Widmanstätten ferrite, however, formation takes place entirely above the Ae3 temperature.
Figure 1.10 Nucleation of primary and secondary Widmanstätten ferrite (Bhadeshia, 2010b)
1.5.3 Diffusional or Reconstructive Transformation
Transformation starts with a parent crystal structure where the atoms rearrange themselves in a different pattern and the product phase can (although it need not) be of a different composition from the parent phase (Fig. 1.11). This process requires diffusion and mobility of the atoms. The rate at which an interface move depends both on its intrinsic mobility (related to the process of atom transfer across the interface) and on the ease with which any alloying elements partitioned during transformation diffuse ahead of the moving interface (Bhadeshia, 1987). Due to this, there is also a composition change because of some atoms partitioning from the parent phase to the product phase. This process requires very slow cooling from the austenitic region to temperatures below the Ae3 and Ae1 lines. Examples of
this type of transformation are allotriomorphic ferrite, idiomorphic ferrite, massive ferrite, and pearlite.
Figure 1.11 Schematic of reconstructive mechanism
1.5.3.1 Ferrite
Ferrite is the thermodynamic stable phase of steel below the Ae3 temperature. It nucleates
within austenite grains during cooling from temperatures above the Ae3 and is usually seen as
equiaxed shapes. When the nucleation of the ferrite phase occurs at the grain boundaries, it is known as Allotriomorphic Ferrite (Bhadeshia, 2010a). When the nucleation is inside the austenite grains Idiomorphic Ferrite forms. Nucleation of ferrite usually occurs at the austenite grain boundaries and the surfaces of inclusions. Ferrite which forms inside grains usually nucleates heterogeneously on non-metallic inclusions present in the steel. Fig. 1.12 illustrates the formation of ferrite.
1.5.3.2 Pearlite
Pearlite consists of a lamellar structure of ferrite and cementite. Steel is fully austenitic at temperatures above the Ae3. Pearlite formation starts when the austenite reaches the Ae1
temperature. Carbon solubility in ferrite is only 0.02%, and any surplus is passed up into the austenite. This results in cementite formation on both edges of the ferrite plate. As the concentration of carbon on both edges of the cementite plate drops, this leads to the development of a new ferrite plate. This is the sidewise nucleation of sets of lamellae responsible for the pearlite structure. The microstructure is shaped by a reconstructive transformation, where the atomic movement of carbon is significantly high and there is