GEOCHEMfCAL SruDY OF THE CIRCULATION Of THE GEOTHERMAL FLUIDS OF LOS AZUFRES, MEXICO
THESIS PRESENTED
AS PARTIAL REQUIREMENT OF THE MASTERS OF EARTH SCIENCES
BY CAROLYNE PICKLER
Avertissement
La diffusion de ce mémoire se fait dans le; respect des droits de son auteur, qui a signé le formulaire Autorisation de reproduire et de diffuser un travail de recherche de cycles supérieurs (SDU-522 - Rév.01-2006). Cette autorisation stipule que «conformément
à
l'article 11 du Règlement no 8 des études de cycles supérieurs, [l'auteur] concèdeà
l'Université du Québecà
Montréal une licence non exclusive d'utilisation et de publicationqe
la totalité ou d'une partie importante de [son] travail de recherche pour 'des fins pédagogiques et non commerciales. Plus précisément, [l'auteur] autorise l'Université du Québec à Montréal à reproduire, diffuser, prêter, distribuer ou vendre des copies de [son] travail de rechercheà
des fins non commerciales sur quelque support que ce soit, y compris l'Internet. Cette licence et cette autorisation n'entraînent pas une renonciation de [la] part [de l'auteur]à
[ses] droits moraux nià
[ses] droits de propriété intellectuelle. Sauf ententé contraire, [l'auteur] conserve la liberté de diffuser et de commercialiser ou non ce travail dont [il] possède un exemplaire.»ÉTUDE GÉOCHIMlQUE DE LA CIRCULATION DES FLUIDES GÉOTHERMAUX DE LOS AZUFRES, MEXIQUE
MÉMOIRE PRÉSENTÉ
COMME EXIGENCE PARTIELLE
DE LA MAÎTRISE EN SCIENCES DE LA TERRE
PAR CAROLYNE PICKLER
m'avoir donnée une chance et pennis de découvrir un domaine des sciences qui me passionne. Les encouragements, discussions et conseils ont été très précieux. Un énorme merci aussi à M. Bassam Ghaleb pour ses conseils, aide, soutien et encouragement. Finalement, un gros merci à ma famille, mes amies et mon copain pour leur patience, motivation, et soutien.
LISTE DES TABLEAUX v
RÉsuMÉ vi
ABSTRACT vii
INTRODUCTION GÉNÉRALE 1
CHAPITRE 1
RADnJM BEHAVIOR IN THE ACIDIC HYDROTHERMAL SPRINGS OF
MARITARO, LOS AZUFRES GEOTHERMAL FIELD, MEXICO .3
Abstract. 4
1. Introduction 5
2. Geology of the studied area and visual core description 6
3. Analytical Methods
3.1. Core Preparation 7
3.2. Gamma Spectrometry 8
3.3. X-Ray Fluorescence 9
3.4. X-Ray Diffraction .10
3.5. Radium Purification and Thennal Ionization Mass Spectrometry 10 4. Results
4.1. Chemistry and mineralogy of the core .11
4.2. Radium content of the core 13
5. Discussion , 14 6. Conclusion '" 18 7. Acknowledgements .18 8. References .19 CONCLUSION GÉNÉRALE .41 ANNEXE A DONNÉES STRONTnJM 42 ANNEXEB ANNEXEC DONNÉES RADIlJM 45 GAZ RARES 47 BIBLIOGRAPHIE GÉNÉRALE .49
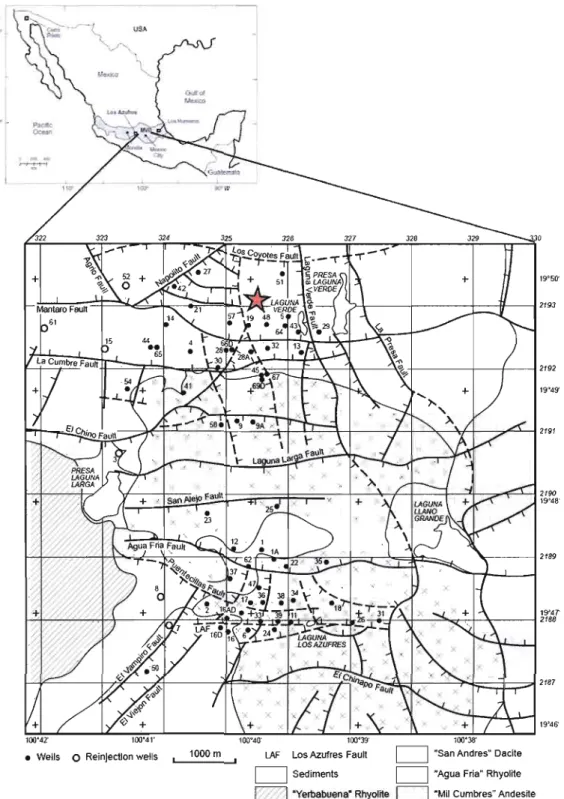
1. Location of the MARITARO hydrothennal springs
within the LOS AZUFRESGeothennal Field and Mexico l
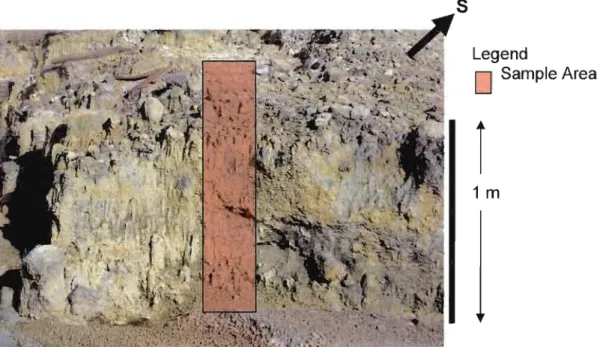
2. Picture of HYDROTHERMAL DEPOSIT in the
MARlTARO hydrothennal springs where the core was extracted 2
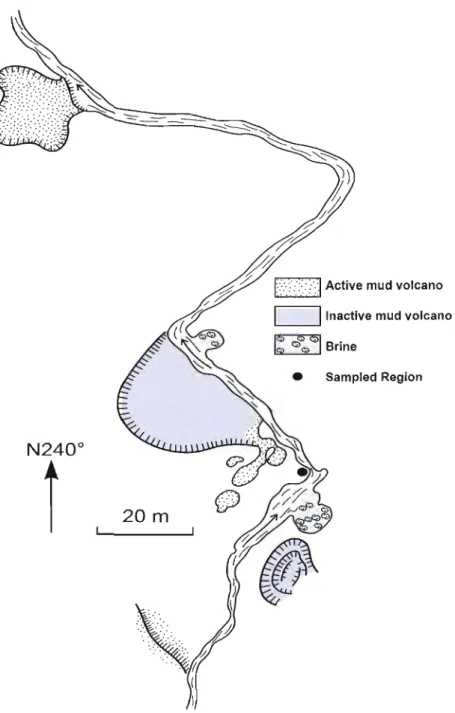
3. Location within the MARlTARO hydrothennal
springs where the core was extracted 3
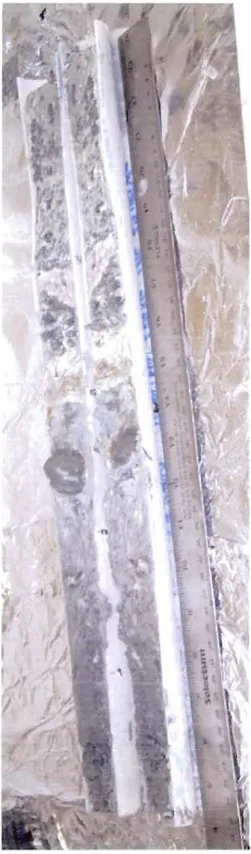
4. Picture of the core extracted from the MARITARO
hydrothennal springs 4
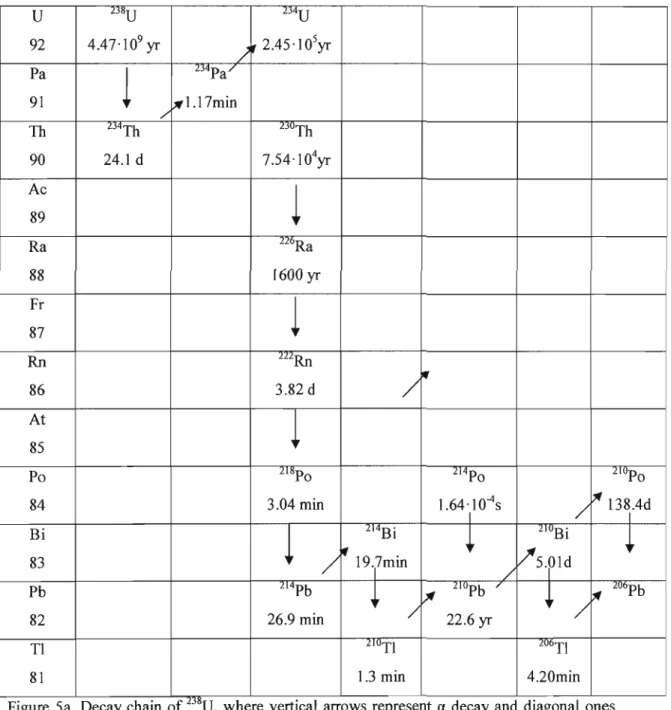
Sa. Decay chain of 238U, where vertical arrows represent a decay and diagonal ones represent
p-
decay.Half-lives are indicated under each isotope 5
Sb. Decay chain of232Th, where vertical arrows
represent a decay and diagonal ones represent
p-
decay.Half-lives are indicated under each isotope 6
6. Mineralogy of the core 7
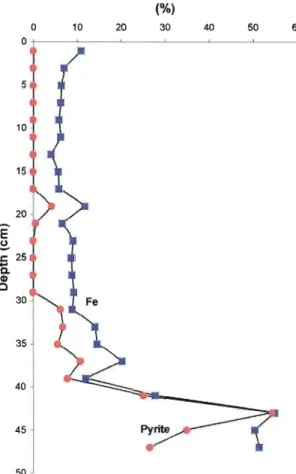
7. Correlation between pyrite and iron within the core 8
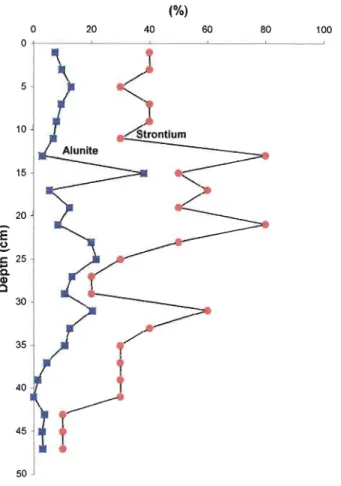
8. Correlation between phosphorus and alunite within the core 9
10c. 226Ra vs. depth 13
Il. 224RaJ228Ra vs. depth 14
12. 228Ral226Ra vs. depth 15
13. 210PbP26Ra vs. depth 16
14. Ca1culated dates of the sediments from the core of the MARITARû hydrothennal springs calculated using the method of Condomines et al. (1999) represented
by the blue points and the 210Pb vs. depth curve as ca1culated
by Condomines et al. (1999) represented by the red line 17
15. Range of ca1culated ages present in the sediments
1. Chemical elements present
in
the core " 12. Mineralogy of the core 2
3. 224Ra,226Ra,228Ra and 210Pb in the core 3
Transmexicaine, afm de développer de nouveaux outils géochimiques pour tracer l'évolution de ces fluides qui sont exploités pour la production d'énergie électrique. Lors de ces campagnes, une carotte de dépôts hydrothermaux a été prélevée dans le secteur de thermes de Maritaro (Los Azufres) où les phénomènes hydrothermaux à la surface (fumerolles, volcans de boue, etc.) sont les plus actifs. Le but de cette étude était de dater ces évènements hydrothermaux par le moyen des chronomètres 226Ra, 228Ra et 21op b, en utilisant la méthode développée par Condomines et al. (1999). Pour déterminer les possibles sites minéraux où le radium pourrait se concentrer, la minéralogie et la chimie de la carotte ont été examinées par diffraction des rayons x et par fluorescence des rayons x. Les résultats ont montré la présence de minéraux secondaires comme les argiles (kaolinite) et les sulfates hydratés de potassium (alunite) qui sont des produits d'altération de roches volcaniques par les eaux thermales acides. Les concentrations du radium e 26Ra de 0.502 à 1.514 dpm/g, 228Ra de 0.077 à 1.302 dpm/g) et du plomb e10pb de 0.204 à 0.734 dpm/g) mesurés dans les sédiments montrent une forte diminution par rapport aux teneurs mesurées dans les fluides du champ 2éothermique de Los Azufres (226Ra de 0.1688 à 3.0989 dpm/g). D'autre part, les ratios 28Ral226Ra et 21Opbp26Ra s'approchent de l'équilibre séculaire. Cette absence de radium peut être expliquée par l'inhibition de l'adsorption du radium sur les argiles et les sulfates dans un environnent fortement acide avec un pH ::; 3. Néanmoins, en appliquant des modèles chronologiques simples nous pouvons estimer des âges maximaux de 20 à 50 ans de la mise en place des dépôts hydrothermaux superficiels du secteur de Mari taro, démontrant une activité hydrothermale intense.
Central Mexico, which is located within the Transmexican Volcanic Belt. The aim of the study was to analyze the 226Ra, 228Ra and 210Pb in order to evaluate whether these isotopes could be used to establish a chronology of hydrothermal events, following the methodology developed by Condomines et al. (1999). While sampling, a core of hydrothermal deposits was extracted from the Maritaro hydrothermal deposits. This area features the most active surface hydrothennal activity (fumaroles, mud volcanoes, etc.). To distinguish radium abundance variations due to the occurrence of different preferential radium trapping sites from the radioactive decay of 2lOpb, we studied the chemistry and mineralogy of the core using x-ray diffraction and fluorescence. Results showed the occurrence of several secondary minerais such as clays (kaolinite) and sulfates (alunite) which are products of the hydrothennal alteration of siliciclastic sediments and/or volcanic rocks by acidic waters. The analysis of radium and lead e2~a from 0.502 to 1.514 dpm/g, 228Ra from 0.077 to 1.302 dpm/g, 210Pb from 0.204 to 0.734 d~m/g) showed a strong depletion as compared to the hydrothennal fluids of Los Azufres ( 26Ra from 0.1688 to 3.0989 dpm/g) and a 228Ral226Ra
and 210Pbp2~a close to secular equilibrium. The marked absence of radium can be explained
by adsorption surfaces on clays and sulfates being inhibited by a strong acidic environment with pH on or less. By applying simple chronological models, we can estimate the maximal age of20-50 years for the placement ofthe superficial Maritaro hydrothermal deposits. Key words: radium, hydrothermal deposits, Los Azufres, Maritaro, hydrothermal fluids
sédimentation dans les milieux lacustres et marins et pour les interactions entre le sédiment et l'eau (Appleby et Olfield, 1978; Appleby et aL, 1986). Cet isotope peut servir à déterminer une chronologie et des taux d'accumulation de sédiments durant les 100 dernières années. Le 21°Pb, radionucléide provenant de la décroissance du mU, peut être utilisé pour dater des dépôts hydrothermaux (Condomines et al, 2010). Rihs et al. (1997), Condomines et al. (1999) et Rihs et Condomines (2002) ont étudié des dépôts de travertins du Massif Central en France et ont noté des enrichissements importants en 226Ra et 228Ra (~ 2000 mBq il), ces deux isotopes provenant de la décroissance de l'uranium. Il faut noter que durant la précipitation des carbonates, le 2IOPb, qui est insoluble, est pratiquement absent dans le système (Rihs et aL, 1997). Après le dépôt des carbonates, si le système demeure fermé et le
222Rn est perdu, la détermination du rapport 21°Pb/226Ra dépendra seulement de la production in situ par décroissance de l,mU. Ces deux isotopes, 21°Pb et 226Ra, nous permettent donc de
dater ces dépôts sur une échelle temporelle d'un siècle. Le même résultat peut être atteint en utilisant le 228Ra. Le 228Ra décroit en 228Th et la détermination du rapport 228Thl228Ra permet de dater les dépôts jeunes ayant été mis en place entre 0 à 15 ans (Condomines et al., 1999). L'objectif de cette étude est de dater les dépôts hydrothermaux, et à travers eux, d'estimer l'intensité de l'activité thermique d'un champ géothermique. Pour cela une carotte a été prélevée dans les dépôts produits par les sources hydrothermales du secteur Maritaro qui se trouvent dans le champ géothermique de Los Azufres. Le champ géothermique de Los Azufres est le deuxième plus important au Mexique et se trouve dans la partie centrale de la Ceinture Volcanique du Mexique, dans la province de Michoacan (Gonza1ez-Partida et al. 2005). Il s'agit d'un système hydrothermal de haute enthalpie qui est relié à l'activité volcanique ignimbritique de la caldera de Santa Ines (Ferrari et al., 1991).
Le champ géothermique de Los Azufres est divisé en deux secteurs: Maritaro au nord et Tejamaniles au sud. Les sources hydrothermales de Maritaro se trouvent dans une section non-exploitée de la région au nord et sont caractérisées par nombreuses fumerolles et
volcans de boue. Par spectrométrie gamma, la carotte a été analysée pour les teneurs en 226Ra, 228Ra, et 21°Pb afin d'utiliser ces nuclides comme chronomètres (Condomines et al., 2010). Nous avons aussi étudié les fluctuations temporelles de 228RaJ226Ra afin de déterminer s'il était possible d'utiliser ces isotopes comme indicateurs d'activité paléo-géothermale, i.e. par la détermination de fluctuations des taux de déposition des sédiments hydrothermaux possiblement reliées aux variations du flux de fluides chauds ramenés à la surface. Étant que les isotopes du radium sont absorbés par des minéraux authigènes, une analyse complète de la minéralogie et de la chimiè de la carotte a donc été faite par XRF et XRD. Cela devrait permettre de vérifier si les variations des rapports isotopiques du radium sont liés à la minéralogie/chimie du sédiment ou sont liés aux processus de décroissance.
Les travaux présentés ici font partie d'un projet sur l'étude de la circulation des fluides géothermaux à Los Azufres et sur les variations d'enthalpie liées aux réinjections des fluides exploités. Un aperçu des travaux de terrain qui ont été effectués sur les eaux et les fumerolles du champ de Los Azufres est présenté en Annexe. Les travaux sur la carotte de Maritaro sont présentés sous forme d'un article à soumettre à Geochemical Journal à l'été 2011
RADIUM BEHAVIOR IN THE ACIDIC HYDROTHERMAL SPRINGS OF MARITARO, LOS AZUFRES GEOTHERMAL FIELD, MEXICO
Carolyne PICKLER!, Bassam GHALEB1, Daniele L. PINTI!, Alain TREMBLAY!, Victor-Hugo GARDUNO-MONROy2
GEOTOP and Département des Sciences de la Terre et de l'Atmosphère, Université du Québec à Montréal, CP 8888 Suce. Centre-Ville, Montréal, QC, H3C 3P8, Canada
Universidad Miehoacana de San Nicolas de Hidalgo, Instituto de Investigaciones Metalurgicas, Departamento de Geologîa y Mineralogia
210Pb in order to evaluate whether these isotopes could be used to establish a chronology of hydrothermal events, following the methodology developed by Condomines et al. (1999). To distinguish radium abundance variations due to the occurrence of different preferential radium trapping sites from the radioactive decay of 21OPb, we studied the chemistry and mineraIogy of the core. Results showed the occurrence of several secondary mineraIs such as clays (kaolinite) and sulfates (alunite) which are products of the hydrothermal alteration of siliciclastic sediments and/or volcanic rocks by acidic waters. The analysis of radium and lead
e
26Ra from 0.502 to 1.514 dpmlg, 228Ra from 0.077 to 1.302 dpmlg, 210Pb from 0.204 to 0.734 dpmlg) showed a strong depletion as compared to the hydrothermal fluids of Los Azufrese
26Ra from 0.1688 to 3.0989 dpmlg) and a 228RaP
26Ra and 21Opb/226Ra close to secular equilibrium. The marked absence of radium can be explained by adsorption surfaces on clays and sulfates being inhibited by a strong acidic environment with pH of 3 or less.1. Introduction
210Pb is a well-established dating tool used in the study of marine and lacustrine sedimentation and sediment-water interactions (e.g., Appleby and Olfield, 1978; Appleby et al., 1986). It can provide a relative chronology and sedimentation rates of recent sediments as weil as information on both vertical and lateral mixing. 210Pb is a radionuclide originating from the decay of the 238U series. The input of 210Pb in aquatic environments occurs mostly
from the atmosphere, where 210Pb derives from the decay of parent nuclide 222Rn from soils, whereas in deep marine environments it is derived from the decay of 226Ra contained in the water column. 210Pb in waters is readily adsorbed onto settling sediment particles, which subsequently accumulate on the seafloor. Hence, measured activities of 210Pb in sediments will be higher than those expected by the natural decay of 226Ra in the sediment (the so-called supported-2IOPb). The distribution with depth of the excess of 210Pb will be then directly related to the age and settling rate of the sediments.
210Pb can also be used for dating hydrothermal deposits (Condomines et al., 2010). Hydrothermal carbonate deposits from the Massif Central were extremely enriched in highly soluble 226Ra and 228Ra (~ 2000 mBq g'l; Rihs et al., 1997; Condomines et al., 1999; Rihs and Condomines, 2002). On the other hand, insoluble 210Pb is depleted and is practically absent when carbonates precipitate (Rihs et al., 1997). After deposition, if the system remains closed and 222Rn is lost from the system, the measurement of the disequilibrium ratio 210PbP26Ra should allow the dating of the deposit on timescales of 100 yrs. Similarly, 228Ra decays into 228Th and the 228Thl228Ra ratio should allow the dating of very young deposits, in the range O
lS years (Condomines et al., 1999).
On the basis of previous works, we sampled a core in the young hydrothermal deposits of the Maritaro hydrothermal springs located within the Los Azufres Geothermal Field (Mexico; Fig. 1). This field was explored in January 2009 for a complete gas survey of fumaroles, thermal springs and geothermal wells. The core was split into 2 cm sections and each section was analyzed for 226Ra, 228Ra and 210Pb by gamma spectrometry in order to use those nuclides as geochronometers and determine the rate of accumulation of the deposits.
Studying the 228Ra;226Ra fluctuations through time we would like to determine whether we
could use these isotopes as indicators of "paleogeothermal activity". Because radium isotopes are adsorbed onto authigenic minerai phases, a detailed mineralogical and chemical composition analysis of the core has been also carried out by X-Ray fluorescence and X-ray diffraction. This should allow us to check if radium isotopes and their fluctuations may be related to the mineralogy of the sediment rather than decay processes.
2. Geology of the study area
In January 2009, a ~50 cm long, 3.5 cm diameter core was taken at the Marîtaro hydrothermal springs (Fig. 2, Fig. 3). These springs are located within the Los Azufres geothermal field, the second most important geothermal ·field in Mexico (Pandarinath et a1., 2007), located in the central portion of the Mexican Vo1canic Belt, which is found in the eastem central part of the state of Michoacan (Fig. 1; Gonzalez-Partida et al., 2005). The Los Azufres field is a typical high-enthalpy hydrothermal system related to a vo1canic caldera collapse and displays intense fracturing (Ferrari et a1., 1991). The geothermal field is divided into two distinct regions: Maritaro, in the north, and Tejamaniles, in the south. The Maritaro hydrothermal springs are located in the northem region (Fig. 1). This region is characterized by a single-phase liquid reservoir with an average pressure of 90 bar and average temperature of 300°C (Gonzalez-Partida et a1., 2005). The Maritaro hydrothermal springs lie in a non exploited region of the Los Azufres geothermal field and contain numerous fumaroles and mud vo1canoes.
The geology of the Los Azufres geothermal system can be summarized as follows. The local basement, referred to as the Mil Cumbres andesite, is about 3000 m thick and dated between 18.1 and 5.9 Ma (Arellano et a1., 2005). This group of rocks is composed of phenocryst-poor, microlitic andesite, interstratified with rocks of andesitic to basaltic composition, basaltic lava flows, and subordinated dacitic rocks. This unit constitutes the main geothermal reservoir (Verma et a1., 2005). The Maritaro hydrothermal springs lie within this region (Fig. 1; Birkle et a1., 2001). Silicic vo1canism began shortly after the eruption of the last andesites. Three major eruptive centers have been identified: Agua Fria rhyolite, San
Andrés dacite, and Yerbabuena rhyolite. These rhyolites overlie the Mil Cumbres andesite and are frequently fractured, allowing the fluids to reach the surface (Verma et aL, 2005).
3. Analytical Methods
3.1 Core Description and Preparation
A 50 cm long, -3.5 cm diameter PVC tube was plunged into the ground at the previously shown location of the Maritaro hydrothermal springs (Figs. 2, 3). A visual examination of the core allowed us to distinguish several col or-distinct zones (Fig. 4). There are two zones of white deposits interpreted to be authigenic deposits. These zones are located at a depth of -13.5 cm to 16 cm and 19.5 cm to 23 cm from the top. Another zone containing sorne of these deposits is found from about 15 cm to 19.5 cm. Unlike the other two zones, this section contains several pebbles of less than 0.5 mm diameter. These detrital rock fragments reappear further down the core. A large lithic fragment was found from 26 cm to 29 cm. From -29 cm to 39 cm, there is a lighter grey homogeneous zone. This zone contains small amounts of the white deposits observed upward. As previously stated, the bottom of the core con tains several rocky zones, which are rather homogeneous. A dark grey rocky zone occurs from 39 to 47 cm. The bottom of core is finished with a -3cm thick brownish grey zone.
In the laboratory, the core was cut along its length using an electric saw. A fishing line was passed through the cut core to split the sediment core in two halves (Fig. 4). The core was sampled every two centimeters for chemistry, mineralogical content and Ra isotope determination. During sampling of one half of the core, we attempted to only remove sediment from its center to limit contamination. Each sample was put into a beaker and left to dry at ambient air for at least 24 hours. The sampled sediments were then reduced into powders with a mortar and pestle, and weighted.
3.2 Gamma Spectrometry
Gamma spectroscopy consists of the measure of the energy of gamma rays emitted by radioactive substances and is used for the measurement of environmental radionuclides such as l37Cs and 2IOPb, which can be used for dating or determining sedimentation rates (Adams and Gasparini, 1970; Appleby et al., 1986). The crushed sediment samples were put into vials fitted for the gamma-ray spectrometer. These vials can contain up to 8 g of sediment. The samples were left in the vials for at least 20 days to ensure the complete re equilibration between 226Ra and the short-lived daughters of the mU series and equilibration between 228Ra and its daughter 228Ac within the 232Th series (Zielinski and Budahn, 1998). The vials were put into a high-precision Germanium gamma-ray spectrometer (ORTEC® DSPEC jr. 2.0) at the Université du Québec à Montréal. Counting time was fixed at 3 to 4 days to provide adequate counts for the peaks of interest. Ionization, the key process by which a gamma-ray is detected, occurs within the spectrometer. This is where it gives up part or aIl of its energy to an electron. These now ionized electrons coll ide with other atoms and liberate more electrons. These liberated charges are directly collected (Adams and Gasparini, 1970). Their energy is measured and recorded by Ortec's Gamma Vision program as peaks in counts per minute. The software takes into account the background noise of the detector and corrects the results.
In this study, measurements were focused on the energy peaks of 6 isotopes: 210Pb (46 keV), 212pb (238 keV), 214pb (295 keV, 352 keV), 208TI (583 keV), 214Bi (609 keV), and 228Ac (338 keV, 911 keV). These isotopes were chosen as they are part of the decay chains of 238U and 232Th (Fig.5a,b), which comprise 224Ra, 226Ra, and 228Ra (Schmidt and Cochran, 2009). Since it is believed that equilibration has been reached in both decay series and due to the short half-lives between the isotopes being measured and the radium isotopes of interest,
. d ' h .. f 224R 226R d 228R 226R
we can use t he measure d Isotopes to etermme t e actlvlty 0 a, a, an a. a can be determined using 3 different measured peaks: the 295 keV peak of 214Pb, the 352 keV peak of 214Pb, and the 609 keV peak of 214Bi. 228Ra can be measured through the two measured peaks of 228Ac: 338 keV and 911 keV. The 583 keV peak of 208TI and the 239 keV peak of 212pb can be used to determine the 224Ra activity (Herranz et al., 2006). While three different peaks were measured and could be used to calculate the activity of 226Ra, only the
peak of 2J4Pb at 352 keV was used. It is berter to use this peak rather than that of 2J4Bi because corrections for the cascade-summing effect must be relied on to correctly determine the 214Bi peak. The 352 keV peak of 214pb is chosen over that at 295 keV due to its greater photon emission probability, 37.6% compared to 18.2% (Herranz et a1., 2006). For 224Ra, we chose to ca1culate its activity using the 212pb peak at 239 keV. This isotope is chosen over 208Tl due to its greater photon emission probability of 43.5%. The same reason dictated the choice of the 911 keV peak of 228Ac, with its photon emission probability of 26.6%, over the 338 keV of 228Ac to calcu1ate the activity of 228Ra (Herranz et a1., 2006). Using these 3 peaks, the activities of 224Ra, 226Ra, and 228Ra can be ca1cu1ated using equation:
peak]
(
[Ra
iSO]
=
cpm
(1)(efJ
xemm
xmass)
where [RaiSO
] refers to the activity of radium isotope being ca1cu1ated
e
24Ra, 226Ra, or 228Ra)in dpmlg, peak is the measured peak using the gamma spectrometer (2J2Pb, 214pb at 352 keV, or 228Ac at 911 keV), cpm is the counts per minute of the detector, eff is the detector efficiency, and emm is the photon emission probability of the isotope whose peak is being measured. The efficiency or "eff' as it is referred to in Eq. Cl) refers to the efficiencYof the detector at measuring the peaks present in the sample, which is ca1culated by running a 1rnown standard in the spectrometer and comparing the resu1ts to 1rnown values (Zielinski and Budahn, 1998).
3.3 X-Ray Fluorescence
X-ray fluorescence (XRF) was used to determine the chemical composition of the studied sediments (Table 1). An XRF spectrometer is an instrument used to perform chemical analyses of rocks, sediments, minerais, and fluids (ports et al., 2005). Prior to analysis, the sediment is crushed to ~20 !lm in size. Sediment samples are then pressed into a 3 cm diameter capsule. In some cases, the quantity of powder is not large enough to fill the en tire capsule and therefore another unrelated standard powder is put into the capsule and then covered with the sample. In this case, the sample should homogeneously cover the
exotic powder to ensure the analysis is not contaminated with elements from the other powder. The capsule was then passed through the S-4 XRF Pioneer® spectrometer at the Université de Québec à Montréal for analysis, which determined the average amount of elements in the entire sample ensuring a quantitative chemical analysis of the elements. The uncertainty associated with these results depends in large part on the preparation of the sample. It is estimated that the analytical error can represent up to 90% of the total error.
3.4 X-Ray Diffraction
X-ray diffraction (XRD) analysis is one of the primary techniques used to determine the mineralogical composition of rocks and sediments (Suryanarayana and Norton, 1998). The sediment samples from the core are crushed to about 20 /lm in size and several grams are put into the sample holder. Ifthe amount of sample is not sufficient enough to fill the holder, then glue is added prior to the addition of the sample, which is then put into the holder; taking care to ensure that it completely covers the glue. The sample was then put into a Siemens D5000 diffractometer at the Université du Québec àMontréal to determine the mineralogical content of the samples (Table 2). As in the case of X-ray fluorescence, 90% of the analytical error is attributed to the sample preparation technique, while the other 10% is attributed to the orientation of the mineraIs, which affect the peaks that are recorded.
3.5 Radium Purification and Thermal Ionization Mass Spectroscopy
Water from the wells and hydrothermal springs was collected using a bucket and then left in the bucket for a couple of minutes to cool, as most of the collected waters samples are near boiling point. The water was then poured into a 500 ml container using a funnel. The cap to the container was screwed on and the bottle was labelled with its location's name. The samples were later filtered in the lab with 0.15/lm filters to remove particulate. Radium was extracted from the waters according to the procedure outlined by Ghaleb et al. (2004). About 200 ml of the filtered water sample was poured into a 250 ml beaker. An enriched 228Ra spike was added to each weighed water sample. The minimum amount of spike in each sample is -60 fg. The co-precipitation described by Ghaleb et al. (2004) was performed on these samples. 100 /lI of 0.5M KMn04 was added to the sample. This resulted in the sample tuming a purplish colour. The pH of this new purple solution was tested using pH strips and
adjusted to a value of -8-9 by ad ding lM NaOH. 200)l1 of O.SM MnClzAHzO was finally added to start the precipitation MnOz, which is of a brownish colour. Most of the barium and radium contained in the samples is precipitated with the manganese dioxide, while the remaining liquid contains the calcium and part of the strontium. Ghaleb et al. (2004) explain that it is believed that barium and radium are incorporated onto the manganese dioxide by surface sorption and is pH sensitive. The solution is stirred and left to sit for at least an hour. This allows the precipitate to settle. After sitting, a large part of the liquid is poured out and discarded. The MnOz precipitate is recovered by centrifugation. The precipitate is washed with Milli-Q water, centrifuged, dissolved in 5-10 ml of 6M HCI and transferred to a 50 ml Teflon beaker. The solution is heated to 80°C. The reduction of MnOz to Mnz + then occurs
as evidenced by the graduaI disappearance of the brownish colour. When only a slightly brownish colour is left, a few milligrams of a reducing agent (lM absorbic acid) are added to the solution that instantly becomes colourless. The solution is then left to evaporate until it is completely dry. It is then redissolved in 2 ml of 3M HCI. The samples then go through 3 stages of chemical columns: column one gives an eluted fraction of radium and barium, column two gives an eluted fraction of radium and part of the barium, and column three gives simply radium. The final radium fraction is left to dry and then put on a single, zone-refined Re filament with 1 !llofTa-HF-H3P04 . The filament was put into the VG-Sector 54 thermal
ionization mass spectrometer at the Université du Québec à Montréal and the radium isotopes and background noise were measured and recorded using a Daly detector in peak jumping mode (Ghaleb et al., 2004).
4. Results
4.1. Chemistry and mineralogy
Major e1ements analyses carried out by X-ray fluorescence (Table 1) indicated that the deposits are mainly silicic and contain, in decreasing amount, Si (from 11.0 to 25.5 wt%), AI (from 6.5 to 17.7 wt%), S (from 0.1 to 9.6 wt%), and Fe (0.82 to 11.0 wt%). It should be noted that at 39 cm depth in sample 20 there is a calcium peak (8.8 wt%). This is significant as the calcium in the rest of the deposits range from 0.09 to 0.42 wt%. This sample is also of interest as it represents an increase in compositional diversity displaying significant quantities
of Ca (8.8 M%), K (1.6 wt%), and C (1.2 wt%). There is also a significant decrease in sulfur (0.1 wt%) while the others range from 0.95 wt% to 9.6 wt%. The iron concentration in the core increases with depth from 0.82 wt% at 13 cm up to 11.0 wt% at 43 cm. The iron peaks correspond to the appearance of pyrite in the core: the first peak at 19 cm corresponds to the first appearance of pyrite, while the second peak at 33 cm corresponds to the reappearance of pyrite, which was not present from 19 cm to 33 cm.
From a mineralogical perspective, the core displays several zones of varymg mineralogy (Table 2; Fig. 6). The first one is predominantly made-up of the sulfate mineraIs of the alunite group, which includes alunite (KAI 3(S04)z(OH)6) and natroalunite (NaAh(S04)z(OH)6) (occurring when sodium substitutes for potassium in the mineralogical structure of alunite), and extends from the surface to 25 cm depth (sample 13) (Nesse, 2000). Within this zone, there is the first appearance of pyrite and clinoptilolite ((Na,K,Cah 3Ah(AI,Si)zSiI3036·12(HzO)) at 19 cm (sample 10). From 27 cm to 29 cm, we find the second zone. This zone is primarily composed of kaolinite (AlzSizOs(OH)4) and the alunite group mineraIs. The third zone is found from 31 to 41 cm (samples 16 to 21) and is the most diverse of ail zones. This zone contains significant quantities of several mineraIs, which inc1udes those of the alunite group (from 5.8 to 11.7 wt%), pyrite (from 5.5 to 25.2 wt%), quartz (from 10.4 to 24.9 wt%), clinoptilolite (from 4.3 to 13.4 wt%), kaolinite (from 5.5 to 13.4 wt%), smectite (from 4.0 to 11.7 wt%), cristobalite (from 7.2 to 11.5 wt%), feldspars (from 4.2 to 11.4 wt%), and gypsum (CaS04·2HzO) (from 2.9 to 8.8 wt%). The final zone starts at 43 cm depth and continues until the end of the core (~50 cm depth). This group is predominately composed of feldspars and pyrite. In this zone, these mineraIs represent up to 60 wt% of the mineralogy of the sediment.
Several mineralogical trends are observed in the sediments of the core (Fig.6). The concentration of the alunite group mineraIs decreases with depth. In the first described zone, it represents 80-90 wt% of the sediments of the core. It then decreases to about 35-40 wt% in zone 2. Zone 3 shows a sharp decline in the alunite group mineraIs, from 50 wt% down to 5 wt%. The final zone, zone 4, contains very little of the alunite group mineraIs, 2-4 wt%. As previously explained, there is an observed trend between pyrite and the iron concentration
(Fig. 7). Pyrite appears for the first time at a depth of 19 cm and then quickly disappears. At 33 cm, pyrite reappears in the sediments and increases significant1y towards the end of the sediment core. It should be noted that the appearance of pyrite coincides with that of clinoptilolite. At 31 cm depth, pyrite also displays an anti-correlation with alunite, which could be accounted for since alunite is a secondary mineraI formed with sulfuric acid that itself could be formed during the oxidation of pyrite (Khalaf, 1990). The amount of feldspars increases with depth. They are first found in the sediments in the form of sanidine ((K,Na)(Si,AI)40s), a potassium feldspar, at 21 cm (sample Il) and at 29 cm (sample 15). Feldspars are also found in the sample around 37 cm depth and quickly increase in concentration. Towards the end of the sediment core (~50 cm), they represent ~35 wt% of the sediments. The same increase with depth trend is observed with quartz. For the first 29 cm, the quantity of quartz is minimal (0.09 to 6.3 wt%). Afterwards, it increases with depth from 3.86 wt% to a maximum of24.9 wt%.
Several correlations between chemical elements and mineraIs present in the core can be made. There is a correlation observed between phosphorus and alunite (Fig.8). Two hypotheses could be made for this correlation: 1) the adsorption of phosphorous by alunite and 2) phosphorus being derived from the aluminium-sulfate-phosphate mineraIs (Ozacar, 2003). Alunite also displays a correlation with strontium (Fig.9). This correlation is thought to be associated to the fact that during the alunitization process, alunite incorporates strontium into its crystalline structure (Stoffregen and Alpers, 1987).
4.2. Radium content
d " (224R 226R 22SR) . . d .
Three ra lUm Isotopes a, a, a were mvestlgate usmg gamma ray spectrometry (Table 3). When examining 224Ra against depth (Figure 10a), a significant peak is found at 37 cm depth. The isotope displays several trends: a decrease in activity up to 7 cm, an increase from 7 cm to 37 cm, and a decrease from 37 cm until the end of the core. Since 228Ra is part of the same decay chain
e
32Th) as 224Ra and we expect them to be at secu1ar equilibrium, the same trends should be observed with the 228Ra isotope (Schmidt and Cochran, 2009). To ensure that these isotopes are at secular equilibrium, the ratio of 224RaP2SRa was plotted against depth (Figure Il). This gave a line close to 1, whichindicated that the system is indeed near secular equilibrium. As expected, the same trends observed with 224Ra are observed with 228Ra (Figure lOb), with the exception that the first zone of decline from the surface continues only to 5 cm depth and this value is very minimal (0.077 dprn/g), which is much smaller than the minimum of 224Ra (0.297 dprn/g). While 224Ra and 228Ra display peaks at 37 cm, 226Ra has a peak at 33 cm. It displays several trends, which differ from those of the radium isotopes of the 232Th decay chain. The 226Ra activity decreases from the surface until 7 cm, it then increases until 17 cm, from there it decreases until 25cm, it then increases to an important maximum at 37 cm, and it then decreases until the end of the core (Figure lOc). When examining the ratio of 228Ra/226Ra (Figure 12), it is difficult to observe a clear trend but three zones were identified: a zone of decrease from the surface to Il cm, another zone of decreases from 13 to 35 cm, and a final zone of decrease from 37 cm to the end of the core. The 21OPb;226Ra activity ratio was also examined (Figure 13). It was noted that almost ail values were below 1 indicating that the age of the system can be calculated using the method developed by Condomines et al. (1999) but it should be noted that in our case, the ratios are not calculated on solely authigenic mineraIs but rather a mixture of authigenic and inherited material (Gauthier and Condomines, 1999).
Finally, we examined the mineraIogy in relation to the results obtained in order to check whether the fluctuations of Ra content with depth could be related to the capacity to be absorbed on certain mineraI phases. No such possible link could be inferred. There is no significant variation in the radium isotopes
e
26Ra and 228Ra). The same holds true for the radium isotopes in comparison to the mineralogy. No mineralogical variation is observed at the two peaks. However, this lack of relation is not surprising as Benes and Srejc (1986) previously noted that the adsorption affinity of the sediments for radium cannot be easily derived from their chemical or mineralogical compositions or other physical properties.5. Discussion
Condomines et al. (1999) used 226Ra, 228Ra, and their daughter nuclides to estimate the age of several young hydrothermal deposits in the French Massif Central. As discussed earlier, if the hydrothermal deposit is initially devoid of 2IOPb, trapped 226Ra should start to
produce 2IOpb. Measured 2IOpb;226Ra should thus increase with time, following the equation (Condomines et al., 1999):
(2)
Where 0 is the decay constant for 210Pb and t is the time. Using these ratios measured in authigenic mineraIs, the age of the hydrothermal deposit can be estimated (Figure 14). In our case, the ratios were calculated on a mixture of authigenic mineraIs and one of inherited and altered material, as a result, we can only calculate a maximal age. Using the estimated age of the hydrothermal deposit and the measured 21OPb;226Ra ratios, the initial 228Ra;226Ra ratio can be calculated. Having calculated these initial 228Ra;226Ra ratios, allows us to study the fluctuation of the ratio throughout the deposit (Condomines et al., 1999). This step cannot be accomplished in our case as we do not calculate a real age but only a maximal one.
Using the Condomines et al. 's (1999) method, we attempted to use radium as a geochronometer for the Maritaro hydrothermal springs and to study the fluctuation of the 228Ra/226Ra ratio through time. We also attempted to establish a link between the mineralogy, chemical composition, and radium isotopes.
Using equation (2), we were able to calculate maximal ages for the deposits of the hydrothermal springs (Figure 14). By plotting the range of these ages, it can be observed that the majority of the deposits lie within the 20-50 years age bracket (Figure 15). Although these ages are maximum ages, it allows us to conclude that the hydrothermal deposit is very young and was formed throughout the last century.
Condomines et al. (1998) demonstrated that in order to utilize the method, 2IOpb should increase with depth as 226Ra decays and produces it. The measured 21OPb;226Ra ratios (Figure 13) of the Maritaro hydrothermal springs are aIl around 0.6 and do not exhibit this trend. Furthermore, the totalamount of Ra is extremely low compared those usually measured in hydrothermal deposits (Rhius et al., 1997; Condomines et al., 1998).
The low Ra content could be the result oftwo possible scenarios:
1- The fluids are depleted in 226Ra;
2 - The 226Ra was not incorporated into the authigenic minerais and remained in the liquid phase and was lost from the system or was incorporated in such a small amount in comparison to the other elements present that it cannot be measured;
The first hypothesis can be immediately discarded. Indeed, as reported in Table 4, we measured radium isotopes in three geothermal wells of the Los Azufres, AZ2, AZ28 (located
near Maritaro) and AZ33 and in five hot springs (Bagnes, Chiflador, Currutaco in the south
and Araro in the north). Results show that 226Ra activity range from 1902± 13 to 16592±307 mBq/1 for the springs and from 2810±15 to 51648±358 mBq/l for the geothermal wells. These figures clearly indicated that the fluids are enriched in 226Ra and thus the low radium content in the deposits of Maritaro cannot be due to depletion at the source. Though the amount of radium in the thermal springs and fumaroles is less than in the geothermal brines at depth, it is still present in large amounts, so precipitation of radium at the subsurface, which would leave final fluids depleted in it, can be ruled out.
The 226Ra could not have been retained into mineraI phases in the deposits. It should be noted that the studied deposits were silicic at the origin (as indicated by the increased presence of quartz and feldspars at depth), possibly rhyolitic. Occurrence of alunite and kaolinite seems to indicate that rather than deposited from hydrothermal fluids, the studied sediments have been just strongly altered by acidic, sulfur-rich fluids. Yet, sulfates are likely precipitateà during the process of alteration and radium shows strong affinities for sulfates (particularly barite). Dickson and Herczeg (1992) measured radionuclides from thermal springs in Australia and clearly showed that alunite-rich bands contained large amounts of Ra thus radium should also have been incorporated in our deposits.
Radium is known to be readily adsorbed onto clays and minerai oxides present in soils, especially near neutral and alkaline pH conditions (Ames et al., 1983; Benes and Strejc, 1986; EPA, 2004). In addition, studies of adsorption and desorption indicate that radium is
essentially completely reversibly adsorbed. Particularly clay minerais and sulfates (barium sulfate) are very good trapping sites of radium in sediments. In addition to the presence of alkaline earth sulfates and metal oxides which influence the sorption of radium, there are a number of other factors that can affect the sorption of materials in general. For example, the affinity of an element for ion exchange relative to other members of its chemical group increases with increasing atomic weight. Therefore, the sorption of radium is the strongest of ail the alkaline earth metals. Secondly, given that the number of sites at which ions may be adsorbed are limited, the adsorption of any particular species decreases as the concentration of competing ions increases. In the specific case of radium, its adsorption has been shown to be strongly dependent on ionic strength and concentrations of other competing ions (EPA, 2004). Thirdly, the pH of the system also has a strong effect on the adsorption of cationic species like radium. When an ion is adsorbed onto soil it typically releases a hydrogen ion (H+). This release is favored under alkaline conditions and inhibited under acidic conditions. Thus, radium will become increasingly mobile in acidic soils and waters. Maritaro effluents are strongly acidic with measured pH of 3.2 (Birkle et al, 2001). Earlier work of Benes and Strejc (1986) showed that for pH lower than 6 the sorption capacity of several minerais drop dramatically to become mostly nil at pH around 3. Thus, the anomalous depletion of radium in our core could be explained by the occurrence of acidic fluids at Maritaro. Though able to create secondary clay minerais and sulfates such as kaolinite and alunite, i.e. good adsorbers, these fluids acidified the system too much hence inhibiting the adsorption of radium.
As previously stated, we were not able to calculate a real date for the springs and therefore could not use Condomines et al.'s (1999) method to determine the initial 228Ra/226Ra ratios and therefore study the fluctuations of 228Ral226Ra ratios through time but the fluctuations of the ratio can be examined through depth. The measured 228Ral226Ra ratios range from 0.685±0.091 to 1.513±0.185 with one value at 5 cm depth at 0.122±0.102, which is considered an anomaly being the only point where the 224RaP28Ra ratio departs significantly from unity (Fig. Il). These ratios could indicate how their parents, 232Th and
238U, behave in the hydrothermal springs. There is no clear trend observed and therefore no
6. Conclusions
The aim of the study was to analyze the 226Ra, 228Ra and 210Pb in order to test whether these isotopes could be used to calculate a chronology of hydrotherrnal events, following the methodology developed by Condomines et al., (1999). Unfortunately, the very small amount of radium detected and the secular equilibrium attained by the system do not allow us to establish a chronological framework. We are however able to deterrnine a maximum age for the deposits of about 20-50 years. We were also able to clearly show, as demonstrated in previous laboratory experiments (Benes et Streic, 1986), that at very strong acidic conditions (pH<3) the radium adsorption is completely inhibited on clay and sulfate mineraIs. Thus only on hydrothermal deposits deposited at more neutral or alkaline conditions, such as carbonates of Massif Central (Rihs et al, 1997), the methodology of Condomines can be successfully applied.
7. Acknowledgements
We would Iike to thank the Comision Federal de Electricidad du Mexique for allowing us to sample the wells and springs of the Los Azufres Geothermal Field and the Groupe du Travail Québec-Mexique for funding.
8. References
Adams, lA. and P.Gasparini. 1970. "Gamma-Ray Spectrometry of Rocks". New York: Elsevier Publishing, p.23-67.
Appleby, P. G., and F. Oldfield. 1978. «The calculation of lead-210 dates assuming a constant rate of supply of unsupported 21 OPb to the sediment». CATENA. no 5, p.1-8. Appleby, P. G., P. J. Nolan, D. W. Gifford, M. J. Godfrey, F. Oldfield, N. l Anderson and R. W. Battarbee. 1986. «210Pb dating by low background gamma counting, Hydrobiologia». vol 143, no 1, p.21-27.
Arellano, V.M., M.A. Torres and R.M. Barragan. 2005. "Response to Exploitation of the Los Azufres (Mexico) Geothermal Reservoir". Proceedings World Geothermal Congress. Antalya, Turkey, p.1-7.
Benes, P. and P. Strejc. 1986. "Interaction of radium with freshwater sediments and their mineraI components". Journal of Radioanalytical and Nuclear Chemistry. vol 99, pA07-422. Birkle, P., B. Merkel, E. Portugal and I.S. Torres-Alvarado. 2001. "The origin of reservoir fluids in the geothermal field of Los Azufres, Mexico - isotopical and hydrological indications". Applied Geochemistry. vol 16, p.1595-1610.
Condomines M., C. Brouzes and S. Rhis. 1999. «Radium and its daughters in hydrothermal carbonates from Auvergne (French Massif Central): origin and dating applications». Comptes Rendus de l'Academie des Sciences Series liA Earth and Planetary Science. vol 328, p.23 28.
Condomines M., S. Rihs, E. Lloret and lL. Seidel. 2010. «Determination of the four natural Ra isotopes in thermal waters by gamma-ray spectrometry». Applied Radiation and Isotopes. vol 68, p.384-391.
Dickson, B. 1. and A.L. Herczeg. 1992. "Deposition of trace elements and radionuclides in the spring zone, Lake Tyrrell, Victoria, Australia". Chemical Geology. vol 96, p.151-166. Ferrari, 1., V.H. Gardufio, G. Pasquarè and A. Tibaldi. 1991. «Geology of Los Azufres Caldera, Mexico, and its relationships with regional tectonics». Journal of Volcanology and Geotherma1 Research. vol 47, no 1-2, p. 129-148.
Gauthier, P.G. and M. Condomines. 1999. "210Pb-226Ra radioactive disequilibria in recent lavas and radon degassing: interferences on the magma chamber dynamics at Stromboli and Merapi volcanoes". Earth and Planetary Science Letters. vol 172, p.111-126.
Ghaleb, B., E. Pons-Branchu and P. Deschamps. 2004. «Improved method for radium extraction from environmental samples and its analysis by thermal ionization mass spectrometry». Journal of Analytical Atomic Spectrometry. vol 19, p.906-9l0.
Gonzâlez-Partida, E., P. Birkle and I.S. Torres-Alvarado. 2000. "Evolution of the hydrothermal system at Los Azufres, Mexico, based on petrologic, fluid inclusion and isotopic data". Journal ofVolcanology and Geothermal Research. vol 104, p.277-296.
Gonzalez-Partida, E., A Carrillo-Chavez, G. Levresse, E. Tello-Hinojosa, S. Venegas Salgado, G. Ramirez-Silva, M. Pal-Verma, J. Tritlla, and A Camprubi. 2005. «Hydro geochemical and isotopic fluid evolution of the Los Azufres geothermal field, Central Mexico». Applied Geochemistry. vol 20, p.23-39.
Herranz, M., R. Idoeta, A. Abelairas, and F. Legarda. 2006. "Radon fixation for determination of 224Ra, 226Ra and 228Ra via gamma-ray spectrometry". Radiation Measurerrients. vol 41. pA86-491.
Khalaf, F., 1990. "Diagenetic alunite III clastic sequences, Kuwait, Arabian Gulf'. Sedimentology. vol 37, p.155-164.
Nesse, W. D. 2000. Introduction to Minera/ogy. New York: Oxford University Press, p.342.
Pandarinath, K., P. Dulski, I.S. Torres-Alvarado and S.P. Verma. 2008. "Element mobility during the hydrothermal alteration of rhyolitic rocks of the Los Azufres geothermal field, Mexico". Geothermics. vol 37, p.53-72.
Ports, P.J., AT. Ellis, P. Kregsamer, C. Streli, C. Vanhoof, M. West, and P. Wobrauschek. 2005. "Atomic spectrometry update. X-Ray fluorescence spectrometry". Journal of Analytical Atomic Spectrometry. vol 20, p.1124-1154.
Ozacar, M. 2003. "Adsorption of phosphate from aqueous solution onto alunite". Chemosphere. vo151, no 4, p.32l-327.
Rihs, S., M. Condomines and Ch. Fouillac. 1997. «U- and Th-series radionuclides in C02 rich geothermal systems in the French Massif Central». Journal of Radioanalytical and Nuclear Chemistry. vol 226, p.149-l57.
Rihs, S. and M. Condomines. 2002. «An improved method for Ra isotope (226Ra, 228Ra, 224Ra) measurements by gamma spectrometry in natural waters: application to C02-rich thermal waters from the French Massif Central». Chemical Geology. vol 182, pA09-421.
Schmidt, S. and J.K. Cochran 2009. "Radium and radium-daughter nuclides in carbonates: a brief overview of strategies for determining chronologies". Journal of Environmental Radioactivity. vol 101, no 7, p.530-537.
Stoffregen, R.E. and C.N. Alpers. 1987. "Woodhouseite and svanbergite in hydrothermal ore deposits: products of apatite destruction during advanced argillic alteration". Canadian Mineralogist. vol 25, p.201-211.
Suryanarayana, C. and M.G. Norton. 1998. X-Ray Diffraction: A Practical Approach. New
York: Plenum Press, p.80-84.
Verma, S.P., I.S. Torres-Alvarado, M. Satir, and P.F. Dobson. 2005. "Hydrothermal alteration effects in geochemistry and Sr, Nd, Pb and 0 isotopes of magmas from the Los Azufres geothermal field (Mexico): A statistical approach". Geochemical Journal. vol 39. p.141-163.
Zielinski, R.A. and J.R. Budahn. 1998. "Radionuclides in fly ash and bottom ash: improved characterization based on radiography and low energy gay-ray spectrometry". Fuel. vol 77, no 4, p. 259-267.
US~ 19"50' 19'49 + '""---j 2'89 19"4T + ...t'=I--"-l'rt--~ ...t"""'"C-t--\----12.B8 + 19'4!> 100'38"
1000m lAF Los Azufres Faull "san Andres" Decile
• Wells o Reinjectlon wells
o
o
Sedimentso
"Agua Fria" Rhyoliteo
"Yerbabuena" Rhyoliteo
"Mil Cumbres" AndesileFigure 1. Location of the Maritaro hydrothennal springs within the Los Azufres Geothennal Field and Mexico
5
Legend
D
Sample Arear
1m
Figure 2. Picture of hydrothennal deposit in the Maritaro hydrothennal springs where the core was extracted
• Sam pIed Region
20
m
lJ~u 234U U 92 4.47·109 yr It 2.45·1 05yr / 234Pa/ Pa
l
91 "" 1.17min / 234Th 90 24.1 d 7.S4·104yr Th 23°Th Acl
89 226Ra Ra 88 1600 yr Fr 87l
Rn 222Rn ~ 86 3.82 d/
At 85l
Po lI~po lI4po LIUPO
84 Bi 83 Pb 82 3.04 min
l
/
214 Pb 26.9 min l'4Bi if 19lmin~
/ 1.64}0-4s~
/IJf
21UPb '/ 22.6 yr/
l,uBilJf
S.p1 d~
/
Jf 138.4d 1~
'" lU6Pb Tl 2lOTI 206TI 81 1.3 min 4.20minFigure Sa. Decay cham of'D~'U, where vertical arrows represent a decay and diagonal ones represent ~-decay. Half-Iives are indicated under each isotope.
U 92 Pa 91 LJLTh LL~Th Th 90 1.40·1010yr
~
1.9 yr/
LLlSAc Acl
/
,
89 • 6.15 hr LL~Ra LL4Ra Ra 88 5.76 yr 3.66 d Frl
87 LLURn Rn 86 55.6 s Atl
85 LI(,PO L1LpO Po 84 0.15 s jf 3'1O-7s 1 1 1 L1LBi 1 Bi~
~
83 60.5 Fin Pb 2l2Pb rf 2°~Pb"/
~
82 10.6 hr/ '
/"
LU~Tl TI 81 3.1 minFigure 5b. Decay cham of LjL·Th, where vertical arrows represent a. decay and diagonal ones
"Tj <iQ" c:: @ 0\
3:
S" 1 1 1'1:
l 0% 1 1 20% 40% " 60% 80% 100%~
0" ~ o >-+, ET (1) () o @ : -1 9 " 11 [~:
f
1 19 L-"
.[23J'
..c:: -25 ~ C271
29 31J
33. " 1 " 1 1 Il Il 1 1 1 1 1 1 1 1'
,
l :'
•
:
'
, o Gypsum o Kaoliniteo
Quartz DAJunite Group • Cristobaliteo
Zeolites [] Pyriteo
Feldspars DSmeclite::
39"
"
'
,":!
' • -, 1 _. j 1 41j
"
43 Il 45 il! 47 Il 1 1 _ 1,
1 1 .=
1.'4:
.1 1 1 1 : j 1(%) 10 20 30 40 50 60 5 15 20 Ê ~ s:. 25 Q. oG) 30 35 40 45 50
5 (%) 10 20 30 40 10 15 20
-
E.e
..c-
25 C CI) o 30 35 40 45 505 (%) 20 40 60 ao 100 10 15 20 E ~ ..c::
...
25 C Cl) C 30 35 45 50124Ra (dpmlgl 218Ra (dpmlg) 226Ra (dpmlg) 0000 0500 1000 1000 2.000 0.000 0500 1.000 1.500 2.000 0000 051)<) 1000 1500 2000 ot---'---'---'---~ 0 0 10
\
5 10 (b) 10{
(c) 15 20 Ê ~ 15 20 Ê ~f
15 20 Ê ~ ~..
25 c. ~ Cl ~25..
c. al Cl~
~ 25 0 ~ Cl 40 35 45 30 30 35 40 45):
;;
30 35 40 45 50 50 50Figure IOa. 224Ra vs. depth
Figure lOb. 228Ra vs. depth
224RaJ228Ra 0.000 0.500 1.000 1.500 2.000 0 - i 5 10 15· - i
2---;
20 E ~ .c: 25 ... Q. QI~
C 30 35~
4
40 45~----;
50228Raf26
Ra 0.500 1.000 1.500 2.000 0.000 O-j---'----~---~----' 5 10 15 20 E ~ oC 25...
C C!) a 30 35 40 45 500.000 0.500 1.500 2.000 o -j ' - -_ _---.L - ' - - -_ _- - - ' 5 ,---t
~--1
7~
10 15~
20~
E -J::. 25 Q. QI ~"t(
0~~
30 "-l 35 f-\~ ~ 40 45 501.40
1.20
1.00
tUa:
0.800
U) C\t~
Q. 00.600
,..
C\t0.400
0.200
0.00 +--...- ...~-or----r--
...-~,...--r--...
o
20
40
60
80
100
120
140
160
Time (y)
Figure 14. Caiculated dates of the sediments from the core of the Maritaro hydrothermal springs caiculated using the method of Condomines et al. (1999) represented by the blue points and the 2lOpb vs. depth curve as caiculated by Condomines et al. (1999) represented by the red line
o
Age 210Pb 17.00
·
·
6.00
-
~··
··
1 - - 5.00
·
·
·
-
4.00
c:
::Jo
·
·
·
·
o
3.00
2.00
-
-··
·
·
·
·
-1.00
-
f - - - -··
··
0.00
1 1 1 1 1 1 T T 1 T T 1o
20
40
60
80
100
Range
Figure 15. Range of calculated ages present in the sediments of the core obtained from the Maritaro hydrothermal springs
Samp1c Dcpth (cm) 1
~%)
1 S'(~o)
1 AI (%) 1~%)
1 Fe (%) 1~%)
Ir
(~o)
1 Na (%) 1 Mg (%) 1 Ca (%) 1 Sr (%) 1 Ba (%) 1 f%) 1 1 55.90 15.50 15.90 6.62 2.19 1.06 0.77 1.24 0.20 0.23 0.04 0.04 0.13 2 3 55.30 22.20 14.10 3.86 1.42 0.79 1.00 0.72 0.17 0.13 0.04 0.06 0.11~
(D 3 5 55.50 25.40 13.50 2.03 1.29 0.41 1.00 0.34 0.21 0.11 0.03 0.06 0.06 4 7 55.80 22.80 13.40 2.49 1.26 0.54 0.73 0.40 0.25 0.09 0.04 0.06 0.06n
::r (D 5 9 55.70 22.10 15.00 3.29 1.18 0.67 0.72 0.62 0.25 0.13 0.04 0.09 0.08 3o'
6 Il 55.80 21.90 15.80 2.83 1.26 0.65 0.65 0.51 0.27 0.11 0.03 0.11 0.07a
(D (D 7 13 55.60 Il.00 17.70 9.60 0.82 1.42 0.44 2.62 0.09 0.21 0.08 0.05 0.21 3 (D ::1 8 15 55.10 18.00 15.80 6.00 1.15 1.00 0.79 1.55 0.12 0.19 0.05 0.05 0.16 fij '"0 9 17 55.30 21.70 14.80 3.83 1.18 0.93 0.84 0.78 0.12 0.16 0.06 0.06 0.13 @ ~ 10 19 54.80 20.90 16.00 3.24 2.36 0.85 0.71 0.34 0.31 0.14 0.05 0.09 0.18 ::1...
S' Il 21 55.40 16.60 16.30 6.35 1.34 1.44 0.65 1.30 0.10 0.18 0.08 0.07 0.15Er
(D 12 23 55.60 20.20 15.20 3.96 1.83 0.92 0.79 0.77 0.17 0.17 0.05 0.05 0.148
@ 13 25 55.40 24.90 13.50 1.97 1.75 0.69 0.91 0.16 0.29 0.11 0.03 0.04 0.11 14 27 55.30 25.50 14.60 0.95 1.78 0.38 0.86 0.21 0.15 0.09 0.02 0.02 0.06 15 29 55.40 24.40 15.00 1.34 1.86 0.44 0.82 0.21 0.21 0.09 0.02 0.03 0.07 16 31 55.40 21.60 15.60 2.99 1.79 0.84 0.75 0.22 0.34 0.13 0.06 0.07 0.15 17 33 54.70 23.40 14.00 2.56 2.82 0.60 0.78 0.18 0.37 0.17 0.04 0.10 0.11 18 35 54.50 24.30 13.90 2.07 2.92 0.45 0.89 0.11 0.39 0.15 0.03 0.08 0.08 19 3.7 54.20 22.90 14.20 2.22 4.07 0.33 0.98 0.08 0.50 0.20 0.03 0.07 0.09 20 39 52.80 23.90 6.53 0.10 2.40 1.60 0.42 1.04 0.98 8.81 0.03 0.03 0.07 21 41 53.10 22.90 12.00 3.53 5.57 0.59 0.85 0.21 0.69 0.33 0.03 0.04 0.07 22 43 48.40 19.60 9.42 9.13 11.00 0.51 0.57 0.29 0.60 0.41 0.01 0.03 0.04 23 45 49.10 21.50 8.29 8.41 10.10 0.53 0.64 0.33 0.56 0.40 0.01 0.03 0.04 24 47 50.20 20.30 7.74 8.76 10.30 0.58 0.57 0.40 0.56 0.40 0.01 0.03 0.06Sample Depth Gypsum Kao1 Quartz Alunite Natro- Crist-Natro C1inopti Pyrite Sani- Smec-Felds (cm) (%) inite (%) (%) alunite oba1ite lite lolite (%) dine tite pars V%) (%) (%) (%) (%) (%) (%) (%)
;'
1 1 4.37 7.34 2.02 7.42 78.83 -0 <r N 2 3 1.15 2.41 3.72 9.75 82.97 -~ 3 5 3.13 5.39 6.35 12.94 72.20 -S' (Il ~ 4 7 1.27 10.42 1.70 9.60 77.00 -0" ~ 5 9 0.70 10.64 0.33 7.96 80.36 -o....,
6 11 1.89 8.25 0.09 6.83 82.95 -st' (Il 7 13 0.82 2.88 1.56 3.07 91.67 -a oa
8 15 0.43 1.62 2.93 38.04 55.41 1.57 -9 17 1.35 16.28 2.54 5.53 70.74 -3.57 -10 19 1.07 6.54 0.77 12.39 44.06 10.46 -20.43 4.28 -11 21 0.60 5.55 0.34 8.48 73.50 1.33 -0.59 9.63 -12 23 1.00 8.21 1.02 19.86 64.18 3.96 -1.76 -13 25 -17.41 0.25 21.57 39.31 21.46 -14 27 -34.73 0.18 13.23 22.18 29.86 -15 29 6.95 36.55 3.86 10.74 35.80 -6.10 -16 31 -12.93 10.36 20.30 37.96 7.96 -6.30 -4.17 17 33 2.89 7.13 17.90 12.48 31.51 7.45 1.09 7.94 6.83 -4.00 -18 35 4.49 13.40 15.35 10.70 18.64 10.77 -10.90 5.68 -5.56 -19 37 5.78 12.10 22.37 4.56 7.59 7.20 -4.34 10.86 -8.42 6.96 20 39 7.18 7.80 24.85 1.55 4.24 11.46 1.63 13.42 7.88 -7.10 11.43 21 41 8.83 5.46 19.60 -9.95 8.37 -6.23 25.17 -11.65 -22 43 5.43 2.25 9.06 3.73 -3.49 5.62 4.64 54.40 -4.41 6.97 23 45 6.29 2.52 6.08 2.87 -3.80 2.31 2.19 35.00 -3.20 35.74 24 47 5.38 1.91 15.95 3.06 1.38 3.76 2.71 2.05 26.59 -2.61 34.61Table 3. 224Ra,226Ra,228Ra and 21°Pb in the core Sample 1 1 1.010 0.106 0.684 0.099 0.743 0.074 2 3 0.876 0.121 0.481 0.124 0.819 0.109 3 5 0.122 0.102 0.690 0.161 4.620 3.835 4 7 0.828 0.193 0.878 0.182 0.714 0.164 5 9 0.730 0.150 0.731 0.154 1.036 0.209 6 11 0.774 0.165 0.513 0.135 0.744 0.158 7 13 1.099 0.166 0.355 0.139 0.898 0.125 8 15 1.167 0.158 0.830 0.162 0.784 0.100 9 17 0.966 0.141 0.696 0.130 0.816 0.115 10 19 0.931 0.169 0.423 0.152 0.973 0.169 11 21 1.206 0.182 1.000 0.165 0.840 0.119 12 23 1.161 0.214 0.760 0.187 0.958 0.166 13 25 0.914 0.298 0.643 0.203 1.357 0.427 14 27 1.244 0.253 0.603 0.224 0.831 0.158 15 29 0.853 0.113 0.665 0.109 0.913 0.117 16 31 0.913 0.108 0.399 0.107 0.583 0.069 17 33 0.685 0.091 0.485 0.087 0.962 0.125 18 35 0.736 0.107 0.479 0.105 1.472 0.207 19 37 1.281 0.116 0.495 0.099 1.051 0.088 20 39 1.298 0.138 0.647 0.111 0.855 0.085 21 41 1.513 0.185 0.614 0.159 0.852 0.090 22 43 1.093 0.128 0.312 0.106 0.898 0.099 23 45 0.728 0.150 0.327 0.132 U81 0.237 24 47 1.154 0.160 0.403 0.136 0.782 0.100
Table 4. 226Ra values in the waters of the Los Azufres geothermal wells
Locali T e
AZ28 Weil 15
Araro North Spring 21
AZ33 Weil 358 AZ2 Weil 307 Ba es2 Spring 82 Currutaco Spring 307 Chiflador Spring 13 Ba es 2 Spring 2437
déterminer s'ils pouvaient être utilisés pour déterminer la chronologie des événements hydrothermaux des dépôts de Maritaro dans le champ géothermique de Los Azufres par la méthode de Condomines et al. (1999). Cette méthode utilise le rapport de 21°PbP26Ra pour établir une chronologie des dépôts hydrothermaux. La faible quantité mesurée de radium, le fait que les dépôts soient composés d'un mélange de minéraux authigènes, matières altérées et matières héritées et que l'équilibre séculaire ait été atteint, ne permettent pas de déterminer une chronologie exacte, mais nous permet d'estimer un âge maximum pour les dépôts de 20 à
50 ans. Cette étude nous a aussi permis de confirmer les études de Benes et Streic (1998) montrant que dans des conditions très acide (pH<3), le radium ne peut pas être complètement absorbé sur des minéraux de sulfates et d'argiles. On peut donc conclure qu'on peut utiliser la méthodologie de Condomines et al. (1999) seulement sur des dépôts hydrothermaux ayant été formés sous des conditions de pH neutre ou alcalin. Finalement, nous n'avons trouvé aucun lien entre la composition minéralogique et chimique des sédiments analysés et les isotopes du radium, indiquant une absence de contrôle minéralogique dans la distribution de ces radionucléides dans les sols.
DONNÉES STRONTIUM
En janvier 2009, nous avons échantillonné les eaux de 6 puits du champ géothermique Los Azufres (AZl, AZ9, AZ22, AZ28, AZ51, et AZ62) et 2 sources hydrothermales (Araro Nord et Maritaro) (Fig.A.l ).
'r---l·'r~
fO
• w"