Methodology to determine the extent of anaerobic
1digestion, composting and CH4 oxidation in a
2landfill environment
3Lizanne Obersky a, *, Reza Rafiee a,d, Alexandre R. Cabral b, Suzanne D. Golding c, William P.
4
Clarke a, *
5
a Centre for Solid Waste Bioprocessing, Schools of Civil and Chemical Engineering,
6
The University of Queensland, St. Lucia, Queensland 4072, Australia 7
b Geoenvironmental Group, Dept. of Civil Engineering,
8
University of Sherbrooke, Sherbrooke, Quebec J1K 2R1, Canada 9
c Earth and Environmental Sciences,
10
The University of Queensland, St Lucia, Queensland 4072, Australia 11
d Department of Environmental Sciences, Faculty of Natural Resources
12
University of Tehran, Karaj, 31536, Iran 13
*Revised Manuscript (clean copy) Click here to view linked References
Obersky, L.; Rafiee, R., Cabral, A.R.; Golding, S.D. and Clarke, W.P. (2018). Methodology to determine the extent of anaerobic digestion, composting and CH4 oxidation in a landfill environment. Waste
* Corresponding authors 14 L. Obersky 15 Tel: 0061 (0)7 336 56464 16 Fax: 0061 (0)7 3365 4599 17 E-mail: [email protected] 18 W.P. Clarke 19 Tel: 0061 (0)7 336 56464 20 Fax: 0061 (0)7 3365 4599 21 E-mail: [email protected] 22
Highlights: 1
Composting, digestion and CH4 oxidation rates were measured in the top 1.6m of two
2
soil capped landfill profiles. 3
Anaerobic and aerobic activity observed simultaneously in a lift of waste for 18 months 4
after placement of interim cover. 5
Composting accounts for 30% of waste degradation for an extended period. 6
Carbon mass balance is improved with stable isotopes (δ13C-CO2, δ13C-CH4).
7
TOC Visual Abstract: 8
9 *Highlights
Abstract: 23
An examination of the processes contributing to the production of landfill greenhouse gas 24
(GHG) emissions is required, as the actual level to which waste degrades anaerobically and 25
aerobically beneath covers has not been differentiated. This paper presents a methodology to 26
distinguish between the rate of anaerobic digestion (rAD), composting (rCOM) and CH4 oxidation
27
(rOX) in a landfill environment, by means of a system of mass balances developed for molecular
28
species (CH4, CO2) and stable carbon isotopes (δ13C-CO2 and δ13C-CH4). The technique was
29
applied at two sampling locations on a sloped area of landfill. Four sampling rounds were 30
performed over an 18 month period after a 1.0m layer of fresh waste and 30-50 cm of silty clay 31
loam had been placed over the area. Static chambers were used to measure the flux of the 32
molecular and isotope species at the surface and soil gas probes were used to collect gas samples 33
at depths of approximately 0.5, 1.0 and 1.5m. Mass balances were based on the surface flux and 34
the concentration of the molecular and isotopic species at the deepest sampling depth. The 35
sensitivity of calculated rates was considered by randomly varying stoichiometric and isotopic 36
parameters by ± 5% to generate at least 500 calculations of rOX, rAD and rCOM for each location in
37
and composting were equally dominant at both locations. Average values of rCOM: ranged from
39
9.8 to 44.5 g CO2 m-2 d-1 over the four sampling rounds, declining monotonically at one site and
40
rising then falling at the other. Average values of rAD: ranged from 10.6 to 45.3g CO2 m-2 d-1.
41
Although the highest average rAD value occurred in the initial sampling round, all subsequent rAD
42
values fell between 10 and 20 g CO2 m-2 d-1. rOX had the smallest activity contribution at both
43
sites, with averages ranging from 1.6 to 8.6 g CO2 m-2 d-1. This study has demonstrated that for
44
an interim cover, composting and anaerobic digestion of shallow landfill waste can occur 45
simultaneously. 46
Keywords: Aerobic degradation; methane oxidation; composting; anaerobic digestion; mass and 47
isotope balances; landfill. 48
Highlights: 49
Composting, digestion and CH4 oxidation rates were measured in the top 1.6m of two soil
50
capped landfill profiles. 51
Anaerobic and aerobic activity observed simultaneously in a lift of waste for 18 months after 52
placement of interim cover. 53
Composting accounts for 30% of waste degradation for an extended period. 54
Carbon mass balance is improved with stable isotopes (δ13C-CO
2, δ13C-CH4).
1. INTRODUCTION 56
Composting in landfilled waste is known to occur at least to the extent supported by O2 that is
57
entrained with waste as it is placed in a landfill (Bookter and Ham, 1982, Komilis et al., 1999) .
58
However, the actual level to which waste composts beneath covers has not been measured. All 59
waste in a landfill lies at some stage directly beneath a soil cover. As this study demonstrates, 60
neglecting aerobic activity can lead to inflated predictions of CH4 production and greenhouse
61
emissions, particularly in cases where interim soil covers, which minimises odour, eliminates 62
access to vermin and prevents windblown debris, but cannot eliminate atmospheric O2 diffusion
63
to the waste layer; thus, supporting aerobic processes for an extended period of time. 64
In a column study by Kallel et al. (2006) using municipal solid waste there was diffusion of 65
O2 observed through the waste bed. There is further evidence in landfill field trials that O2 can
66
reach the waste mass, due to natural gas transport. For example, in a landfill constructed on an 67
old quarry site in the United Kingdom, O2 levels at 10 v/v% were observed at depths of 20 m
68
(Barry et al., 2004). At the Fiflholt landfill, in Iceland, where a final cover of 1-1.2 m (15-25 cm 69
mulch under 1 m of sandy soil) for mature cells spanning 6-10 years, atmospheric O2 and N2
70
were observed 80 cm in the waste (Kjeld et al., 2014), with O2 concentrations reaching 0.75 –
71
16.25 v/v% (average of 8.14 v/v%) and, for N2, 5.85 – 73.40 v/v% (average of 46.1
72
v/v%).1v/v%)80 cm into the waste layer (Kjeld et al., 2014). 73
In fact, continuous O2 migration through the surface may sustain aerobic degradation of both
74
the organic fraction of the cover soil and within shallow waste materials. Aerobic degradation 75
might occur at a uniform depth in a homogeneous fine medium, but given the heterogeneity of 76
buried waste (i.e. bagged waste or large objects) zones of aerobic and anaerobic activity will 77
likely be highly variable. This gives rise to mixed regions of composting and anaerobic digestion 78
within the uppermost layers of the waste mass. 79
Previous studies have developed carbon mass balances to define methane oxidation behaviour 80
in landfill soil covers (Christophersen et al., 2001, Einola et al., 2009, Pedersen et al., 2011). 81
These calculations require an estimation of gas fluxes exiting the surface (CH4, CO2), and
82
upward fluxes from the underlying waste mass that migrates into the cover (CH4 and CO2)
83
(Bogner and Spokas, 1993, Gebert et al., 2011, Scheutz et al., 2011). However, gas fluxes at the 84
base of the control volume cannot be measured physically without disturbing the system. This 85
can be overcome by assuming the fluxes of CH4 and CO2 are proportional to the concentration of
86
these gases at the base of the cover and that total carbon flux is conserved through the soil cover. 87
The carbon flux is not conserved however if composting is significant. For the purposes of 88
distinguishing composting and methane oxidation others have proposed measuring the rate of 89
composting in separate aerobic incubations of the soil (Scheutz et al., 2011). Instead, the same 90
mass balance approach can be extended to incorporate both composting and anaerobic reactions 91
within the landfill. The determination of the simultaneous rates of anaerobic digestion, CH4
92
oxidation, and composting in landfill has not been presented in the literature. The logical 93
extension of the carbon balance method would be to develop a method based on mass balances 94
of O2, CO2 and CH4 (Rafiee et al., 2017). In practice however, it is problematic to measure the O2
95
flux into the landfill cover with conventional methods. 96
Preliminary findings by Bogner et al. (1996) highlighted the potential use of stable isotopes to 97
characterise aerobic and anaerobic mechanisms in landfills. Bogner et al. (1996) concluded that 98
CH4 oxidation was the most significant aerobic process, but that it was still plausible for the
99
composting of organic matter to occur in parallel. Stable isotopes have since been applied 100
extensively in landfills to analyse CH4 oxidation (Cabral et al., 2010, Cabral and Capanema,
101
2012), with different soil types (Chanton and Liptay, 2000), climatic zones (Chanton et al., 102
2010),soil texture and porosity (Gebert et al., 2013) and modes of gas transport (De Visscher et 103
al., 2004). 104
It is hypothesised that the rate and extent of anaerobic digestion, CH4 oxidation and
105
composting within the soil cover and the fresh waste immediately below the cover can be 106
determined by the combination of stable isotope and mass balances for carbon species (CH4 and
107
CO2). This is readily obtained from surface flux measurements and sampling of gas and isotope
108
composition through the soil and waste profile to a nominated depth in the field environment. 109
This paper documents the rates of activity derived 4 to 18 months after a layer of fresh waste was 110
placed, compacted and subsequently covered with an interim soil layer of thickness (30 - 50 cm). 111
The calculated rates are lumped values for the combined soil layer and shallow waste zone. 112
Whether this measured activity occurs in the soil or the shallow waste is not distinguished. 113
2. MATERIALS AND METHODS 114
2.1 Description of field site 115
The experimental site was located on a sloped edge (3:1 vertical to horizontal) of a municipal 116
solid waste landfill in Ipswich, Queensland, Australia (27°39'32.18"S, 152°49'39.77"E). A fresh 117
waste lift was placed over this area in August-September 2014 and was progressively covered 118
with 30-50 cm of silty clay loam (interim cover) as the waste was placed. The lift was placed 119
above pre-existing landfill lifts deposited from 2008 to 2009. Five sampling locations were 120
selected at varying distances from the crest of the slope (Figure 1). 121
122
Figure 1. Plan and elevation schematic of field site and installed equipment 123
2.2 Field sampling and gas analysis 124
At each selected site, gas samples were collected from a static chamber and nest of soil gas 125
probes. Gas fluxes (CH4 and CO2), gas composition profiles (CH4, CO2, N2, O2) and isotopic
126
abundance profiles (δ13C for CH4, CO2 and δ2H – CH4) were monitored in four sampling
127
campaigns, performed 4 to 18 months after the waste and interim cover were placed. One 128
sampling campaign was performed in each of the four climatic seasons. 129
Gas sampling probes were constructed of stainless steel (SS) 12 mm internal diameter tubes. 130
The top of each spear was fitted with a septa and aluminium crimp and a conical tip at the base. 131
Samples were drawn through four perforated holes at the tip of the spear. Probes were installed 132
at four depths at site 1 (0.57, 0.62, 1.35, and 1.84 m) and site 5 (0.71, 1.05, 1.30, and 1.57 m). At 133
sites 2, 3 and 4 only one probe was installed to track gas composition within the waste (1.65 m at 134
site 2; 1.33 m at site 3 and 1.51 m at site 4). 135
A short-circuiting test was performed using helium as a tracer gas with a Laco Technologies 136
Gas Check G3 leak detector and 3L aluminium shroud placed as a collar over each probe , 137
sealing a radius of 150mm ground surface around the probe (see Supplementary materials, 138
section A.1). The dilution factor due to short-circuiting was calculated by the concentration of
139
helium detected in the gas probe sample divided by the helium concentration in the shroud. 140
Based on soil probe guidelines, dilution values less than 5-10% indicate negligible short-141
circuiting (Ma et al., 2012).
142
The static chambers were fabricated with SS 316 and had a conical geometry (15L, height of 143
0.2m, cross-sectional area of 0.28m2) designed to prevent the formation of stagnant headspace 144
zones (Dever, 2006). Each static chamber was seated on a circular anchor plate that was 145
hammered into the cover soil, which ensured samples were collected from the same locations 146
throughout the study period. A CO2 infrared gas analyser (EGM-4, PP Systems) system was used
147
to measure CO2 concentrations on site during static chamber experiments. To avoid creating a
148
vacuum in the chamber, gas that was drawn through the EGM-4 was circulated back into the 149
chamber. The flux of the gas species was calculated from the concentration data (C in ppmv) 150
plotted versus sampling time (t in minutes). The CH4 and CO2 data typically observed a linear
151
relationship, with the rate of accumulation of each species (dC/dt) in the chamber expressed as 152
the slope of the fitted line. The gas fluxes were calculated as: 153
F [g/m2d] = PVMU/ATR (dC/dt) (1)
154
where P = chamber pressure [atm]; V = chamber volume [L]; M = molar mass [g/mol]; U = 155
0.00144 [L min/μL d]; A = chamber area [m2]; R = 0.08205 [atm L/mol K]; T = chamber 156
temperature [K]; dC/dt = concentration of gas [ppmv] per unit time [min]. 157
The slope of the fitted line (dC/dt) was determined by linear regression of the measured 158
concentrations versus time sampled. Gas fluxes were considered to be reportable if there was a 159
95% confidence (p<0.05) in the correlation between the gas concentrations and time, in a similar 160
fashion to other studies (Barlaz et al., 2004, Abichou et al., 2006, Bogner et al., 2011). 161
All gas samples were collected using gas-tight syringes (SGE Australia) and stored in serum 162
bottles (30mL and 50mL sizes) sealed with 20 mm butyl rubber septa (Rubber BV) and 163
aluminium crimps rather than the commonly used evacuated vials. Gas samples were large 164
enough to first flush the bottle before filling with the sample based on recommendations by 165
Sturm et al. (2015) (see Supplementary materials section A.2, Table S.2 for flush and injection 166
ratios for each sampling type). Eby et al. (2015) identified that serum bottles provide the best 167
reliability for isotope sampling, with minimal fractionation effects during storage and transport. 168
Molecular gas composition was analysed by gas chromatography (GC) using three replicate 169
injections into a Shimadzu GC-8A FID with 100/120 mesh ShinCarbon ST micropacked column 170
for CO2 and CH4 analysis and three replicate injections into a Shimadzu GC-8A TCD with
171
80/100 mesh Mole Sieve 5A column for O2 and N2 analysis. Calibration for both GCs was
172
performed using external gas standards obtained from British Oxygen Company (BOC). 173
The isotopic abundances for all samples were determined in the Stable Isotope Geochemistry 174
Laboratory, University of Queensland, using an Isoprime/Agilent Gas Chromatograph-175
combustion-isotope ratio mass spectrometer (GC-c-IRMS). The δ13C and δ2H values (per 176
mil, ‰) were normalised to the Vienna Pee Dee Belemnite (VPBD) and VSMOW scales 177
respectively, following a 2-point normalisation for δ13C and δ2H using a combination of 178
international reference gases (Oztech: δ13CO2: -40.75‰, -3.59‰ and δ2H: -125‰, -365‰) and
179
laboratory CH4 and CO2 standards. The reproducibility for δ13C is ± 0.3 ‰ and for δ2H ± 4.0 ‰
at one standard deviation. Additional details on the analytical equipment, procedure and 181
calibration can be found in (Baublys et al., 2015). 182
2.3 Determination of isotopic parameters for key processes 183
Microorganisms typically metabolise the lighter isotopic forms of key substrates, which gives 184
rise to preferential effects called isotopic fractionation. The degree to which lighter isotopic 185
forms are preferentially metabolised is characteristic for each biochemical process (Kendall and 186
McDonnell, 2012). The characterisation of fractionation factors is usually performed via the 187
Rayleigh approach by closed system incubations with samples at field conditions (Coleman et 188
al., 1981, Liptay et al., 1998). 189
The fractionation factor for CH4 oxidation has been shown to be dependent on temperature
190
(Scheutz et al., 2009). A correlation for the effect of temperature on the degree of fractionation 191
for CH4 oxidation in a clay soil was developed by Chanton and Liptay (2000):
192
(2) 193
where is the adjusted fractionation factor, T is the temperature of the cover .
194
In anaerobic digestion, this process is described by two parameters: the apparent fractionation 195
factors for stable carbon and hydrogen isotopes (Whiticar, 1999) . The isotopic composition of 196
the biogas produced will depend on the isotopic composition of the organic solids and the 197
preferential uptake by the dominating methanogenesis pathway. The fractionation factor for the 198
anaerobic digestion reaction in terms of the carbon system is: 199
(3) 200
where
and are the stable isotopes of 13C in CO2 and CH4 produced by the
201
anaerobic region of the ecosystem. In this study, gas sampled at the deepest depth, which marked 202
the base of the control volume were used to calculate .
203
In contrast, composting organisms have no preferential bias towards 12C or 13C (O'Leary, 1981, 204
Corbett et al., 2013). Therefore, the ratio of 13C-CO2 and 12C-CO2 in the gas produced from
205
composting reflects the ratio of these isotopes in the organic carbon substrate (O'Leary, 1981, 206
Corbett et al., 2013).It is difficult to determine the direct measurement of the organic carbon 207
signature in waste due to heterogeneity. Instead, waste was sampled from the fresh lift at the 208
field site and incubated under composting assay conditions, with the carbon isotopic composition 209
of headspace gas CO2 sampledfrom three incubations (33) as described by Rafiee et al. (2017).
210
2.4 Mass and isotope balances 211
The control volume for the mass balance includes the soil cover and the top 1.6 m of waste 212
beneath the cover as presented in Figure 2. Despite the landfill being a complex system with an 213
array of biochemical processes, to gain an insight into aerobic and anaerobic degradation, this 214
was simplified. Three different reactions are proposed to occur in these layers, namely anaerobic 215
digestion (rAD), CH4 oxidation (rOX) and composting (rCOM). Anaerobic digestion was treated as
216
a lumped process, rather than a combination of by acetoclastic and hydrogenotrophic 217
methanogenesis mechanisms, as it was desired to identify the overall rate of anaerobic activity. 218
In addition, the composting activity described by the mass balance is predominately related to 219
the aerobic degradation of the waste, with the contribution of soil respiration considered to be 220
minimal. At this particular landfill, the interim soil cover was composed of relatively sterile and 221
coarse material. Furthermore, CO2 uptake by photosynthesis was not addressed in this
222
formulation because the interim cover at this landfill site had no to limited vegetation present. 223
The described rates (rAD, rOX and rCOM) have been previously estimated in laboratory reactors
224
that contained packed beds of waste overlain with soil sourced from the same landfill (Rafiee et 225
al., 2018). These rates were determined from the measurement of the net fluxes of CH4, CO2, O2
226
and 13C-CO
2 with mass balances for each of these four components. The mass balance equations
227
comprised an overdetermined system for the 3 unknowns, rAD, rOX and rCOM. Therefore, the rates
228
were estimated as fitting parameters, optimised by Excel Solver ® with the Generalised 229
Reduction Gradient nonlinear algorithm to minimise the Root Mean Square Error, with the 230
constraint that all rates were positive. 231
232
Figure 2. Required data to estimate rAD, rOX and rCOM over control volume
233
O2 uptake cannot be measured in the field, because drawdown in O2 cannot be measured
234
within static chambers. Instead, balances were developed for the molecular (CH4 and CO2) and
235
isotope species (13C-CO2 and 13C-CH4). The surface fluxes measured by the static chamber
236
measured gas fluxes reflect reaction rates at the time, with negligible mass transfer delays. 238
Therefore, the steady state condition was assumed for the mass balances. The general mass 239
balance equation is (Eq. 4): 240
(4) 241
where is the flux of species i into the fresh lift base of waste [g m-2 d-1], is the flux of 242
species i at the surface of the cover [g m-2 d-1] and is the net generation rate of species 243
i as a result of n reaction processes, rate [g m-2 d-1] describes the n reactions that species i is 244
either produced or consumed in, with referring to the stoichiometric coefficient of species 245
affiliated with the specific reaction. 246
Reaction rates were expressed in terms of CO2 [g CO2 m-2d-1] as it is a common product in the
247
three reaction processes. The dissolution of CO2 due to moisture was not an effect as at steady
248
state conditions the water would be saturated with CO2. The normalised stoichiometric
249
coefficient can be expressed on a mass basis (Eq 5): 250
(5) 251
where ai is the stoichiometric coefficient of species i [mol]; is the stoichiometric
252
coefficient of CO2 [mol]; MWi is the molecular weight of species i [g]; is the molecular
253
weight of CO2 [g]. The normalised stoichiometric equations for the three reactions are:
254
Anaerobic digestion: (6)
255
CH4 oxidation: (7)
Composting: (8) 257
For the development of isotope balances, the fractional abundance (F) notation was used (Fry, 258
2003). For example, 13F designates the fractional abundance of 13C = 13C/ (13C + 12C). This can 259
also be defined in terms of the δ notation and isotopic ratios (R), as follows (Eq. 9): 260
(9) 261
Carbon isotopic balances (eq. 10) were developed in a similar way to standard mass balances 262
(Eq 4), with isotopic flows in (13F
in,i) and out (13Fout,i) of the system defined by gas samples
263
collected at these points. An additional consideration for each biochemical reaction (rj) is
264
whether there is an associated isotopic value (13F
reaction) or fractionation factor ( ) to
265
account for the consumption or production terms. 266
(10) 267
The flux into the base of the control volume cannot be measured directly. Conservation of 268
carbon flux through the control volume cannot be assumed, as in calculation for CH4 oxidation in
269
soil covers, because gaseous carbon is generated from the compositing and anaerobic digestion 270
reactions. The carbon flux at the base of the control volume could be calculated as a complex 271
function of the total carbon flux at the base, and the rates of reaction that yield gaseous carbon 272
within the control volume, rAD and rCOM.
273
Instead, a formulation is proposed which considers that the flux of each component at the base 274
of the control volume expressed as a mass fraction (X) and a total mass flow of landfill gas, (JLFG,
12
rCOM and JLFG, BASE from the four mass balances. Solutions are considered only when rAD, rOX and
277
rCOM > 0. The full set of equations is:
278 (11) 279
where all terms have been previously defined. 280
2.5 Model application 281
The field observations and input parameters required to apply mass balances are summarised 282
in Tables 1 and 2. It is difficult to obtain precise stoichiometries of biochemical processes in a 283
dynamic and heterogeneous environment like a landfill. For the reaction stoichiometries of 284
composting, anaerobic digestion and CH4 oxidation, averages were adopted from the proof of
285
concept laboratory study by Rafiee et al. (2017). The average stoichiometries and Fsolid applied in
286
the model are shown in Table 2. For the application of the model, the field data obtained from 287
Sites 1 and 5 was utilised. 288
To determine the uncertainty in the calculated rates and test the robustness of the model, a 289
±5% perturbation was applied to the all model parameters (reaction stoichiometries , 290
and isotopic terms of Fsolid for composting, and fractionation factors αAD and αOX). In
291
particular, with the sensitivity analysis conducted, the two pathways of methanogenesis were 292
considered by performing mass balances with a range of isotopic fractionation factors for 293
anaerobic digestion that covered both the hydrogenotrophic and acetoclastic pathways. 294
A uniform distribution population for each parameter was generated using SIMLAB® with 295
500 entries per parameter (Supplementary materials, section A.3). Combinations of perturbated 296
values were chosen randomly, from the uniformly distributed populations of each model 297
parameter over the ±5% range to equally weight extreme and mean values. 298
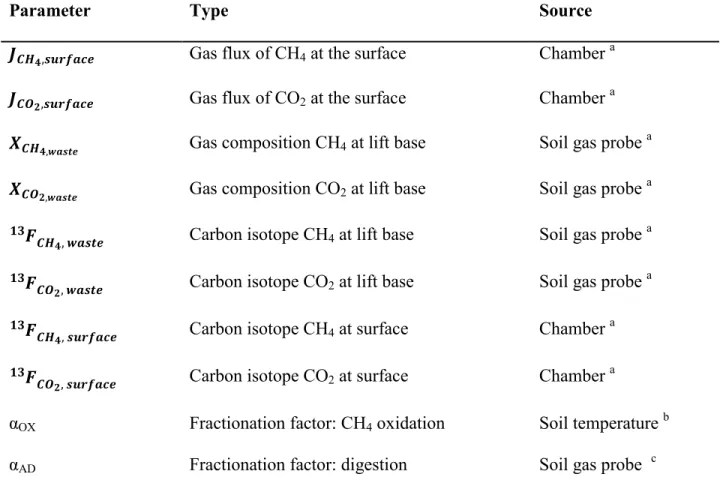
Table 1. Field observations and independently determined parameters utilised in mass balance 299
Parameter Type Source
Gas flux of CH4 at the surface Chamber a Gas flux of CO2 at the surface Chamber
a
Gas composition CH4 at lift base Soil gas probe a
Gas composition CO2 at lift base Soil gas probe a
Carbon isotope CH4 at lift base Soil gas probe a
Carbon isotope CO2 at lift base Soil gas probe a
Carbon isotope CH4 at surface Chamber a
Carbon isotope CO2 at surface Chamber a
αOX Fractionation factor: CH4 oxidation Soil temperature b
αAD Fractionation factor: digestion Soil gas probe c
a obtained by gas sampling; b defined by clay-temperature regression equation (Eq. 2) c defined
300
by apparent fractionation factor equation (Eq. 3) for carbon based on probe 4 data 301
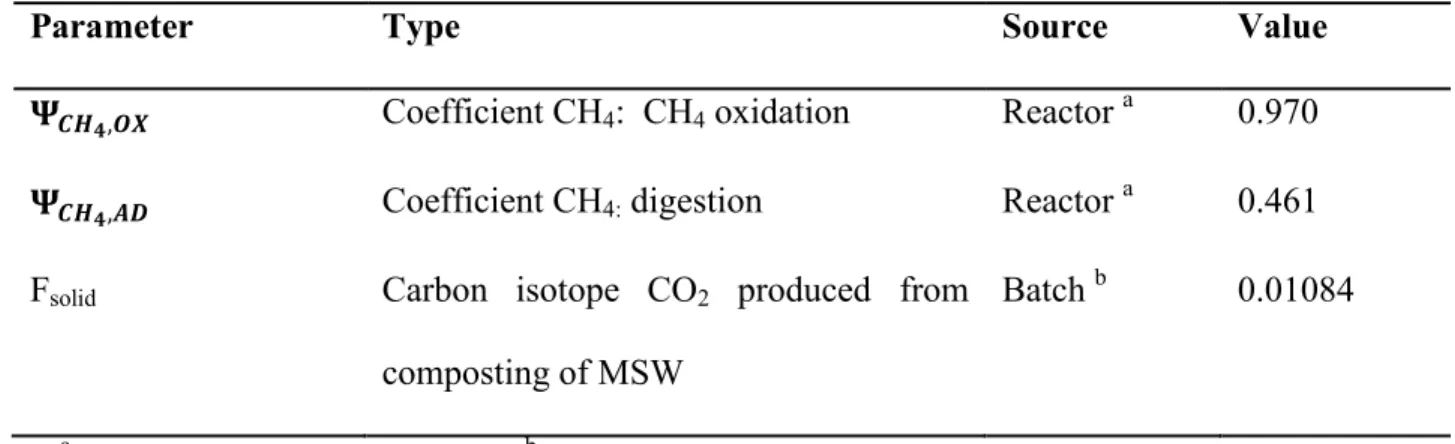
14 Table 2. Average values of stoichiometric parameters applied in the mass balance model 302
Parameter Type Source Value
Coefficient CH4: CH4 oxidation Reactor
a 0.970
Coefficient CH4: digestion Reactor a 0.461
Fsolid Carbon isotope CO2 produced from
composting of MSW
Batch b 0.01084
a Based on (Rafiee et al., 2018); b Based on (Rafiee et al., 2017).
303
3. RESULTS AND DISCUSSION: 304
3.1 Differentiation of activity types based on isotopic data 305
Table 3 summarises the variations with time of molecular and isotopic gas compositions at the 306
soil surface and at the deepest spear in the waste, i.e. 1.84 m and 1.57 m depth from the top of 307
the waste layer at site 1 and site 5, respectively. Compositional data from sampling probes were 308
corrected by the dilution factors from short-circuiting testing as described (Table S.1 309
Supplementary materials). Overall, the impact of short-circuiting, ranged from 1-15%, which
310
was accounted for in analyses. Given the packing density of the waste at the facility, settlement 311
of the waste mass was anticipated to be minimal and as such the conditions of the soil gas probes 312
were not expected to deteriorate in the remainder of the experimental study. 313
The predominant reactions within the control volume can be interpreted directly from the data 314
in Table 3, where the boundary conditions at the base of the waste lift and at the surface of the 315
landfill are examined. The compositional gas trends within the waste at both sampling sites are 316
similar. The isotopic abundance varied between approximately-55.4‰ to -59.5‰ (13δC-CH4) and
317
-279‰ to -306‰ (2δH-CH4), which is comparable to expected ranges for deep landfill
environments (Hackley et al., 1996, Chanton et al., 2005). This seems to indicate that anaerobic 319
digestion was the predominant activity within the waste zone of the control volume (Whiticar et 320
al., 1986, Whiticar, 1999). For static chamber samples obtained at the soil surface, the molecular 321
composition had relatively equal CH4 and CO2 volume fractions. The emitted value of δ13C-CH4
322
varied by less than 15% at both sites which would imply constant fractionation associated with 323
anaerobic digestion(Chanton et al., 2007). 324
The 13δC-CO2 values at both monitored sites revealed some additional information about
325
processes within the control volume. The emitted δ13C-CO2 values from the soil surface evolved
326
from -1.1 ‰ to +12.0 ‰, while δ13C-CO
2 values from the waste layer remained within a
327
narrower range, i.e. between 15.1 and 18.2 ‰ across the two sites and over all sampling events. 328
These isotopic shifts are consistent with results reported by Baedecker and Back (1979) and 329
(Hackley et al., 1996) who found that δ13C-CO
2 values for young (<1 – 2 years), intermediate (2
330
– 7 years) and mature (7 – 12 years) landfill cells ranged from -5.1 ‰ to +12.4 ‰, +15‰, and 331
+16 ‰ to +12.4 ‰, respectively. It was expected that that the δ13C-CO2 signature for freshly
332
landfilled organic waste would reflect values ranging from -10 ‰ to -30 ‰, which are typical of 333
terrestrial plants (O'Leary, 1981, Corbett et al., 2013). Once methanogenesis is well established, 334
constant input of isotopically heavy 13C-CO2 causes an increase in the δ13C-CO2 signature from
335
the initial values that are representative of composting alone (Hackley et al., 1996) .The increase 336
with time in δ13C-CO
2 values suggests that there is a diminishment in the proportion of aerobic
337
activity and an establishment of anaerobic digestion. 338
16 Table 3. Gas composition at mass balance boundaries: the soil surface and within the waste*
339
Campaign Layer Site 1 Site 5
CO2 [%] CH4 [%] δ13C-CO2 [‰] δ13C-CH4 [‰] δ2H-CH4 [‰] CO2 [%] CH4 [%] δ13C-CO2 [‰] δ13C-CH4 [‰] δ2H-CH4 [‰] Jan’15 Surface 0.32 0.33 6.3 -54.5 n.d 0.37 0.41 -0.5 -49.7 n.d Waste 13.4 34.0 n.d n.d n.d 25.9 38.3 16.6 -55.4 n.d Sept’15 Surface 0.41 0.45 0.7 -59.0 n.d 0.15 0.12 -1.1 -67.4 n.d Waste 33.9 50.2 15.1 -59.4 -305 34.5 50.4 18.2 -59.3 -282 May’16 Surface 0.29 0.39 4.3 -55.2 n.d 0.24 0.32 9.7 -57.0 n.d Waste 31.8 47.4 16.5 -59.5 -306 34.2 48.0 17.6 -59.1 -283 June’16 Surface 0.20 0.15 9.1 -54.0 n.d 0.23 0.22 12.0 -55.2 n.d Waste 34.5 52.9 16.8 -59.5 -305 35.2 50.3 17.0 -59.0 -279
*Results presented here reflect the boundary conditions utilised for the mass balance model at the bottom of the waste lift (spear 4) and at the landfill surface 340
(static chamber). The measurement of gas concentrations from the waste layer are average values of three replicates from spear 4 depth; surface measurements
341
are average values of duplicates for static chamber experiments; depth 0m = surface of landfill. For additional data relating to the spear profiles at study site refer
342
to Supplementary materials section A.6 for O2 gas composition and precision indicated in Supplementary materials section A.6, full gas composition and 343
precision presented in thesis; precision for δ13C ±-0.3‰, δ2H±-3‰ at 1 standard deviation. The standard deviation in the relative error of CO2, CH4 was less than 344
10%.
3.2 Evolution of surface gas fluxes 346
The CH4 and CO2 flux trends at sites 1 and 5 are summarised in Table 4. All CH4 gas fluxes,
347
with the exception of the June’16 measurement at site 1, can be classified as high (i.e. fluxes >25 348
g CH4 m-2d-1, based on the classification system proposed by Abichou et al. (2006). The CO2
349
fluxes are around 100 g CO2 m-2 d-1 during the entire monitoring period.These persistently high
350
levels of CO2 gas flux could be indicative of aerobic behaviour within the waste mass. In
351
particular, the CO2 gas flux observed in Jan ’15 (221 g CO2 m-2 d-1) is characteristic of windrow
352
composting facilities (250 – 2900 g CO2 m-2 d-1; (Andersen, 2010) ). The only other study that
353
has monitored the evolution of gas composition from a freshly placed waste layer was performed 354
by Bogner et al. (2011), who suggested that the CO2 fluxes observed from soil covered fresh
355
waste (50 - 250 g CO2 m-2 d-1) was indicative of aerobic respiration activity occurring.
356
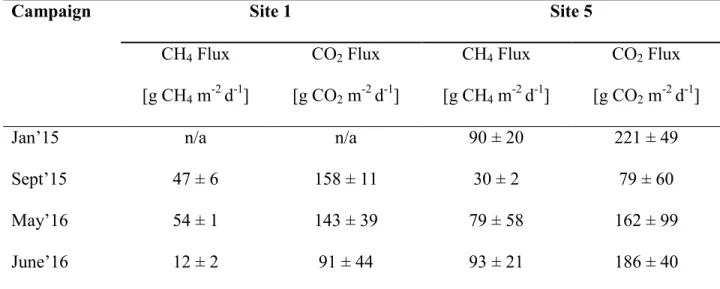
Table 4. Summary of gas fluxes at primary locations for model 357
Campaign Site 1 Site 5
CH4 Flux [g CH4 m-2 d-1] CO2 Flux [g CO2 m-2 d-1] CH4 Flux [g CH4 m-2 d-1] CO2 Flux [g CO2 m-2 d-1]
Jan’15 n/a n/a 90 ± 20 221 ± 49
Sept’15 47 ± 6 158 ± 11 30 ± 2 79 ± 60
May’16 54 ± 1 143 ± 39 79 ± 58 162 ± 99
June’16 12 ± 2 91 ± 44 93 ± 21 186 ± 40
Note: ± denotes the 95% confidence interval based on non-zero flux hypothesis test similar to 358
Barlaz et al. (2004). 359
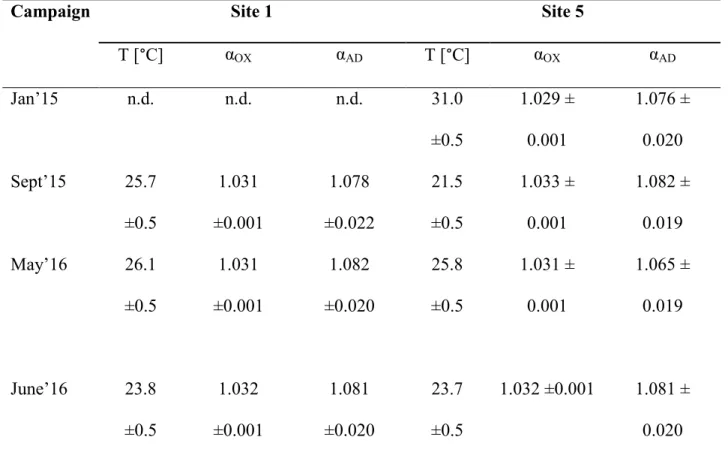
18 3.3 Isotope fractionation factors based on heuristics from field data
360
The fractionation factors for CH4 oxidation and anaerobic digestion, OX and AD are listed in
361
Table 5. Values of OX were calculated using Eq 2, which is a function of temperature only. OX
362
for Jan ’15 was significantly lower than other values, due to the much higher temperature 363
prevailing in Jan ’15 (31.0 °C). For the process of anaerobic digestion, calculation of the 364
Whiticar (1999) apparent carbon fractionation factor (αAD), expressed in Eq 3, revealed that, at
365
site 1 and 5, the dominant methanogenesis pathway was CO2 reduction (hydrogenotrophic),
366
rather than acetoclastic methanogenesis as αAD > 1.065.
367
Table 5. Fractionation factors used in the mass balance model 368
Campaign Site 1 Site 5
T [°C] αOX αAD T [°C] αOX αAD Jan’15 n.d. n.d. n.d. 31.0 ±0.5 1.029 ± 0.001 1.076 ± 0.020 Sept’15 25.7 ±0.5 1.031 ±0.001 1.078 ±0.022 21.5 ±0.5 1.033 ± 0.001 1.082 ± 0.019 May’16 26.1 ±0.5 1.031 ±0.001 1.082 ±0.020 25.8 ±0.5 1.031 ± 0.001 1.065 ± 0.019 June’16 23.8 ±0.5 1.032 ±0.001 1.081 ±0.020 23.7 ±0.5 1.032 ±0.001 1.081 ± 0.020 Note: Temperature values presented were maximums measured at each monitoring location 369
with a portable temperature probe. Error was propagated for calculated fractionation factors. 370
3.4 Model application to uppermost layer of waste 371
Figure 3 presents the distribution of solutions for rAD, rOX and rCOM for sites 1 and 5, from 4-18
372
months after waste placement. The rates are expressed in terms of CO2 production [g CO2 m-2 d
-373
1]. Outliers (indicated by the symbol ‘+’ in Figure 3) were defined as lying outside of ±2.698σ of
374
the overall mean value for each rate, for the 500 simulations. The summary statistics for rOX,
375
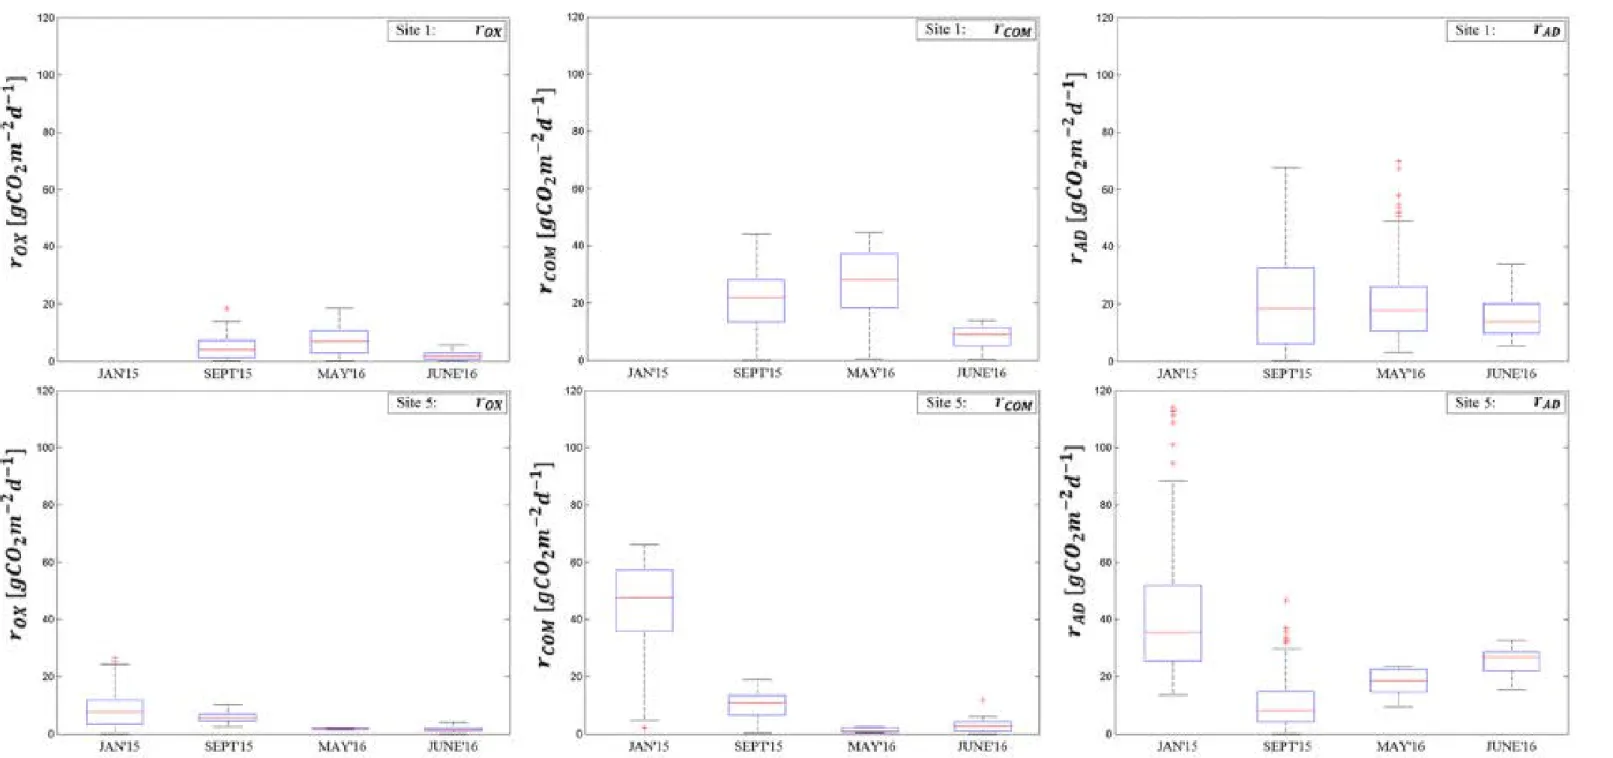
rCOM, rAD and JLFG, BASE are shown in Tables 6-8.
Figure 3. Distribution of rOX, rCOM and rAD predicted by the mass balance method for (a) Site 1 and (b) Site 5. No data was collected for Site 1 in January 2015. Outliers indicated by “+’ defined by the ±2.698σ
377
constraint. 378
The results in Figure 3, Tables 6 and 7 clearly indicate that CH4 oxidation (rOX), whose average
379
rates ranged from 1.6 to 8.6 g CO2 m-2 d-1, was the least important of the three reactive processes.
380
rAD spanned averages from 10.6 to 45.3 g CO2 m-2 d-1 at site 5 and is less pronounced at site 1.
381
The lower level of rAD behaviour in site 1 was anticipated, since site 1 is located close to the crest
382
of the landfilled slope, where it is more likely that desiccation cracks provided a pathway for O2
383
migration into the waste mass, therefore sustain aerobic activity. 384
It is difficult to make comparisons with CH4 oxidation efficiencies determined in landfill cover
385
systems, as this depends on the CH4 load entering the cover, the age of the waste lift and the
386
geophysical characteristics of the cover. The rOX values predicted by the mass balance technique
387
can be expressed in units of CH4 consumption (g CH4 m-2d-1), by using the average
388
stoichiometric ratio . This results in a CH4 consumption rate at site 1 and 5 spanning
389
from 0 – 4.7 g CH4 m-2d-1. It is encouraging that the CH4 oxidation rates predicted by the mass
390
balance are similar to those found by Einola et al. (2009) (2.7- 4.8 g CH4 m-2d-1) for a bio-cover
391
with peat and sludge compost (40:60v/v%) submitted to low biogas loads of 0.7 – 2.7 g CH4 m
-392
2d-1.
393
The CH4 load to the base of the control volumes were estimated from the predicted inlet gas
394
flux average (JLFG, BASE) and the measured gas composition at the base of the waste lift (Table 3).
395
The CH4 loads for sites 1 and 5 ranged from 31 to 98 g CH4 m-2d-1, which was similar in nature to
396
flux activity described in daily and intermediate covered waste in other studies Bogner et al. 397
(2011). Since the mass balance method was applied to the shallowest layer of waste on a lift, it is 398
understandable that the oxidation capacity of the system is poor (0-40%) when rOX is evaluated
399
against the initial CH4 load.
22 For both sites, the mass balance model indicated that the aerobic activity diminished towards 401
the end of the trial, with rAD becoming a more dominant process. rCOM had a unique trend at each
402
location. At site 1, composting was more pronounced towards the middle of the monitoring 403
period (between Sept’15 and May’16), and peaked with a mean of 27.1 g CO2 m-2 d-1 17 months
404
after waste placement (May’16). There was a rapid decrease in rCOM during the last monitoring
405
month (June’16), with the average composting rate decreasing to 8.1 g CO2 m-2 d-1.
406
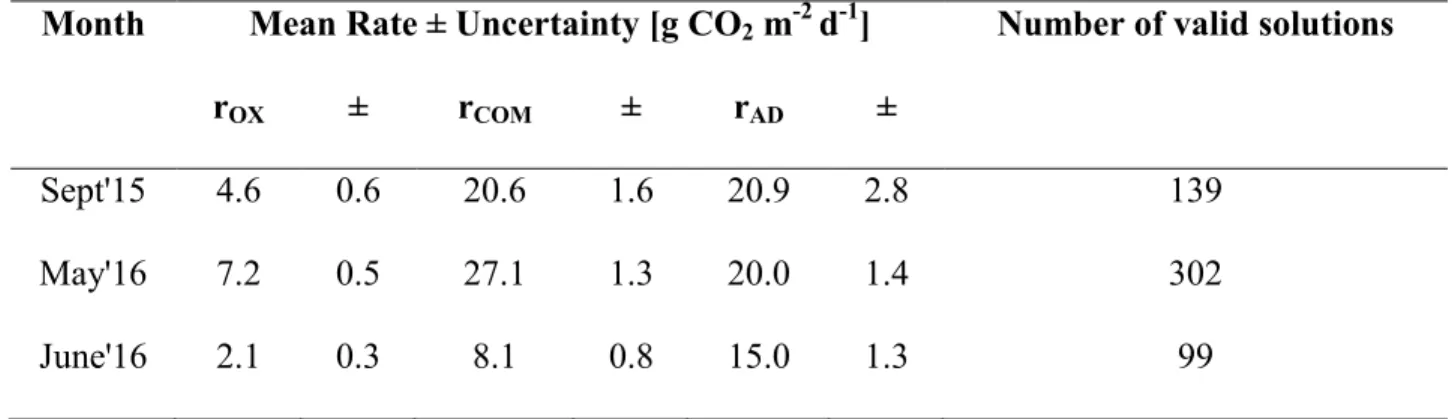
Table 6. Summary of rOX, rCOM and rAD values calculated for Site 1
407
Month Mean Rate ± Uncertainty [g CO2 m-2 d-1] Number of valid solutions
rOX ± rCOM ± rAD ±
Sept'15 4.6 0.6 20.6 1.6 20.9 2.8 139
May'16 7.2 0.5 27.1 1.3 20.0 1.4 302
June'16 2.1 0.3 8.1 0.8 15.0 1.3 99
Table 7. Summary of rOX, rCOM and rAD values calculated for Site 5
408
Month Mean Rate ± Uncertainty [g CO2 m-2 d-1] Number of valid solutions
rOX ± rCOM ± rAD ±
Jan'15 8.6 1.0 44.5 2.4 41.9 3.5 170
Sept'15 5.9 0.3 9.8 0.7 10.6 1.4 145
May'16 1.8 0.3 1.3 0.8 18.0 5.0 5
June'16 1.6 0.4 3.1 1.2 45.3 30.3 18
At site 5, rCOM had a maximum average of 44.5 g CO2 m-2 d-1, 4 months after waste placement
409
(Jan’ 15) and decreases exponentially with time, levelling off at 1.3 g CO2 m-2 d-1 from May’ 16.
This is consistent with the source of O2 being dominated by air that was entrained with the waste
411
at placement. The residual level of rCOM after May ’16 could be indicative of composting as the
412
result of ongoing O2 migration through the soil cover into the waste layer.
413
The predicted JLFG, BASE values are all positive (Supplementary materials, section A.5, Figure
414
S.6), which is anticipated as the pre-existing waste lifts would likely be contributing a gas
415
production flux of CO2 and CH4 from anaerobic digestion. Site 1 appears to have consistent
416
average JLFG, BASE values, with site 5 observing no clear trends in behaviour. The number of
417
solutions that were retained towards the end of the analysis declined because rOX and rCOM
418
became relatively small compared to rAD, leading to a high proportion of solutions to the mass
419
balances that violate the constraint of rAD, rOX and rCOM > 0. Furthermore, the actual reactions
420
occurring in the waste and in the soil, are likely to vary from the assumed stoichiometry. This 421
effect will be more pronounced for composting and anaerobic digestion where the amount of O2
422
consumed in composting (de Bertoldi et al., 1983) and the production ratio of CH4/CO2 in
423
anaerobic digestion will be different for fats, carbohydrates and protein (Mata-Alvarez et al., 424
2000). 425
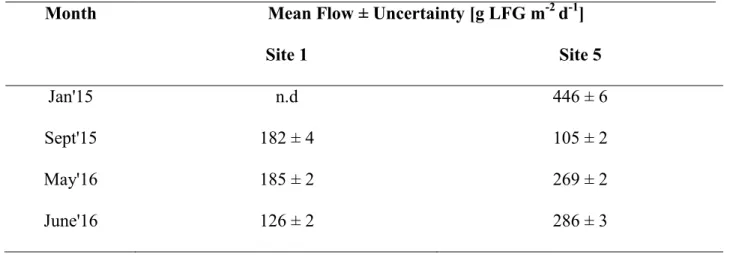
Table 8. Summary of JLFG, BASE average values calculated for Site 1 and 5
426
Month Mean Flow ± Uncertainty [g LFG m-2 d-1]
Site 1 Site 5
Jan'15 n.d 446 ± 6
Sept'15 182 ± 4 105 ± 2
May'16 185 ± 2 269 ± 2
24 427
3.5 Supporting evidence of ongoing aerobic activity at field site 428
Despite the differences in location on the working face and waste composition, the mass 429
balance calculations presented herein revealed that aerobic activity forms a large proportion of 430
early phase activity (4-18 months) in the uppermost layer of waste at this landfill site. It is 431
particularly noteworthy that the results in Figure 3 clearly indicate that anaerobic activity can 432
occur simultaneously with aerobic reactions, such as CH4 oxidation and composting and that
433
these processes continue to co-exist for an extended time (12-18 months). For site 5, a 434
comparable magnitude of rCOM and rAD is present for the first 12 months to (Sept’15). The
435
average values for rCOM and rAD for site 1 suggest that composting and anaerobic digestion are
436
ongoing at similar rates 18 months after waste placement. This ongoing level of aerobic activity 437
within the waste layer may reflect the difficulty of compacting soil covers on landfill slopes. 438
Indeed, O2 levels were consistently observed at 2-5 v/v% at points in the soil cover and waste
439
layers from January 2015 to September 2016, at all sampling locations (Obersky et al., 2015) .
440
For the last two months of monitoring, the trends in O2 were examined dynamically, with full
441
distribution presented in Supplementary materials, section A.6. Site 5 had reduced levels of O2
442
ingress to 0.4 - 0.6 v/v% and these appeared to stabilise. In contrast, site 1 had variable levels of 443
O2, with fluctuations from 0.53 – 1.50 v/v% across the May and June 2016 campaigns. Given
444
this supply of O2 into the shallow waste, it is plausible that ongoing composting could occur in
445
parallel with anaerobic digestion, for a sustained period (>18 months). 446
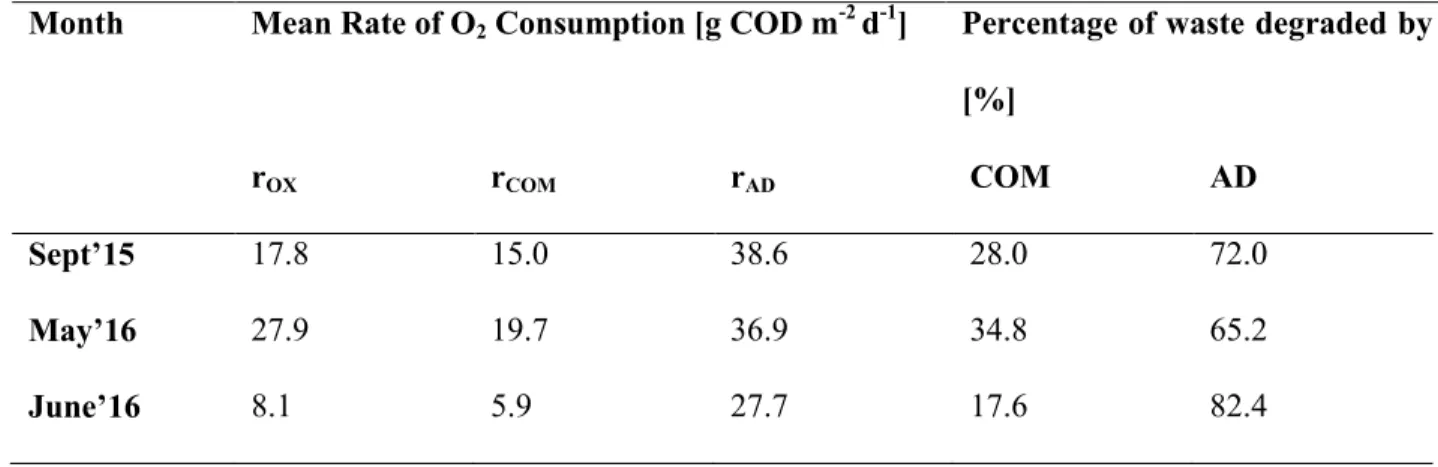
The contribution of composting and anaerobic digestion to the degradation of the shallow waste 447
can be converted to a chemical oxygen demand (COD) basis rather than CO2 basis (g CO2 m-2 d
1) as indicated in Table 9 and 10 below.
26 Table 9. Composting and anaerobic digestion degradation of waste for Site 1
450
Month Mean Rate of O2 Consumption [g COD m-2 d-1] Percentage of waste degraded by
[%] rOX rCOM rAD COM AD Sept’15 17.8 15.0 38.6 28.0 72.0 May’16 27.9 19.7 36.9 34.8 65.2 June’16 8.1 5.9 27.7 17.6 82.4 451
Table 10. Composting and anaerobic digestion degradation of waste for Site 5 452
Month Mean Rate of O2 Consumption [g COD m-2 d-1] Percentage of waste degraded by
[%] rOX rCOM rAD COM AD Jan’15 33.4 32.4 77.3 29.5 70.5 Sept’15 22.9 7.1 19.6 26.7 73.3 May’16 7.0 0.9 33.2 2.8 97.2 June’16 6.2 2.3 83.6 2.6 97.4 453
For example, with anaerobic digestion, the conversion is achieved by multiplying the 454
degradation rate (g CO2 m-2 d-1) by the stoichiometric coefficient and the COD of CH4
455
(4.0 g COD/g CH4). Expressing rCOM on a COD basis requires the stoichiometric relationship
456
between O2 consumption and CO2 production in the composting reaction. For the purposes of
457
these calculations, it is assumed the degradable organic waste has the composition of cellulose. 458
It is evident that in the first 12 months after waste placement composting comprises 459
approximately 30% of waste degradation and gasified COD conversion, with this value declining 460
for the last two sampling rounds. These percentages are indicative of the activity observed at the 461
time of sampling, rather than a cumulative degradation percentage. 462
The mass balance model has indicated for site 1 and 5 that rCOM was of a similar rate to rAD on
463
the basis of CO2 production for at least the first year after waste placement, equivalent to
464
approximately 25% of the COD depletion being attributable to composting over the same period. 465
This is contrary to the conceptualisation of early age (1-2 years) landfill behaviour formulated in 466
the IPCC model (IPCC, 2006) and landfill gas generation models like LANDGEM (Thorneloe 467
et al., 1999) where composting is either neglected or only considered as a rapid short term 468
process during the first stage of landfill degradation. This study highlights that CH4 oxidation,
469
composting and anaerobic digestion are significant in newly developed waste lifts. 470
ACKNOWLEDGEMENTS 471
This research study was funded by the Queensland Government through the Smart Futures 472
Research Partnerships Program, Remondis Pty Ltd and the University of Queensland. Additional 473
support was provided by the Australian Federal Government through the Research Training 474
Program Scholarship. The on-site assistance from Ishrar Ali, Colin Kangas and Andrew 475
Sultmann is also gratefully acknowledged. Special thanks to Kim Baublys for training and 476
operation of the GC-C-IRMS at Stable Isotope Geochemistry Laboratory at the University of 477
Queensland. The authors greatly appreciate the comments and suggestions provided by the 478
reviewers, which were very constructive and have contributed to enhance the content of the final 479
article. 480
28 SUPPORTING INFORMATION AVAILABLE
481
A.1 Short circuiting testing configuration and correction factors, A.2 Sample flush 482
technique, A.3 Parameters generated by Simlab ® for use in mass balance, A.4 Oxygen 483
composition information for profile in field trial, A.5 JLFG, BASE results for site 1 and 5, A.6
484
Dynamic oxygen profiles in field trial. 485
This material is available free of charge via the Internet at http://pubs.acs.org. 486
REFERENCES 487
ABICHOU, T., CHANTON, J., POWELSON, D., FLEIGER, J., ESCORIAZA, S., LEI, Y. & 488
STERN, J. 2006. Methane flux and oxidation at two types of intermediate landfill covers. 489
Waste Management, 26, 1305-1312.
490
ANDERSEN, J. K. 2010. Composting of organic waste: quantification and assessment of 491
greenhouse gas emissions. PhD, Technical University of Denmark
492
BAEDECKER, M. J. & BACK, W. 1979. Modern marine sediments as a natural analog to the 493
chemically stressed environment of a landfill. Journal of Hydrology, 43, 393-414. 494
BARLAZ, M. A., GREEN, R. B., CHANTON, J. P., GOLDSMITH, C. D. & HATER, G. R. 495
2004. Evaluation of a Biologically Active Cover for Mitigation of Landfill Gas 496
Emissions. Environmental Science & Technology, 38, 4891-4899. 497
BARRY, D. L., SMITH, R. & HARRIES, C. Onset of methanogenesis in landfilled MSW. 28-30 498
September 2004 2004 In: Proc. Waste 2004 Conf. Integrated Waste Management and 499
Pollution Control: Policy and Practice, Research and Solutions, Stratford-upon-Avon, 500
UK. 325-332. 501
BAUBLYS, K. A., HAMILTON, S. K., GOLDING, S. D., VINK, S. & ESTERLE, J. 2015. 502
Microbial controls on the origin and evolution of coal seam gases and production waters 503
of the Walloon Subgroup; Surat Basin, Australia. International Journal of Coal Geology, 504
147–148, 85-104. 505
BOGNER, J. & SPOKAS, K. 1993. Landfill CH4: Rates, fates, and role in global carbon cycle.
506
Chemosphere, 26, 369 - 386.
507
BOGNER, J. E., SPOKAS, K. A. & CHANTON, J. P. 2011. Seasonal Greenhouse Gas 508
Emissions (Methane, Carbon Dioxide, Nitrous Oxide) from Engineered Landfills: Daily, 509
Intermediate, and Final California Cover Soils. Journal of Environmental Quality, 40, 510
1010-1020. 511
BOGNER, J. E., SWEENEY, R. E., COLEMAN, D., HUITRIC, R. & RIRIE, G. T. 1996. Using 512
Isotopic and Molecular Data To Model Landfill Gas Processes. Waste Management & 513
Research, 14, 367-376.
514
BOOKTER, T. J. & HAM, R. K. 1982. Stabilization of solid waste in landfills. J. Environ. Eng. 515
Div.(Am. Soc. Civ. Eng.);(United States), 108.
CABRAL, A. R. & CAPANEMA, M. A. 2012. Evaluating Methane Oxidation Efficiencies in 517
Experimental Landfill Biocovers by Mass Balance and Carbon Stable Isotopes. Water, 518
Air & Soil Pollution, 223, 5623-5635.
519
CABRAL, A. R., CAPANEMA, M. A., GEBERT, J., MOREIRA, J. F. & JUGNIA, L. B. 2010. 520
Quantifying microbial methane oxidation efficiencies in two experimental landfill 521
biocovers using stable isotopes. Water, Air & Soil Pollution, 209, 157-172. 522
CHANTON, J., ABICHOU, T., LANGFORD, C., HATER, G., GREEN, R., GOLDSMITH, D. 523
& SWAN, N. 2010. Landfill Methane Oxidation Across Climate Types in the U.S. 524
Environmental Science & Technology, 45, 313-319.
525
CHANTON, J., CHASER, L., GLASSER, P. & SIEGEL, D. 2005. 6 - Carbon and Hydrogen 526
Isotopic Effects in Microbial, Methane from Terrestrial Environments. In: PATAKI, L. 527
B. F. R. E. E. (ed.) Stable Isotopes and Biosphere Atmosphere Interactions. San Diego: 528
Academic Press. 529
CHANTON, J. & LIPTAY, K. 2000. Seasonal variation in methane oxidation in a landfill cover 530
soil as determined by an in situ stable isotope technique. Global Biogeochemical Cycles, 531
14, 51-60. 532
CHANTON, J. P., POWELSON, D. K., ABICHOU, T. & HATER, G. 2007. Improved Field 533
Methods to Quantify Methane Oxidation in Landfill Cover Materials Using Stable 534
Carbon Isotopes. Environmental Science & Technology, 42, 665-670. 535
CHRISTOPHERSEN, M., KJELDSEN, P., HOLST, H. & CHANTON, J. 2001. Lateral gas 536
transport in soil adjacent to an old landfill: factors governing emissions and methane 537
oxidation. Waste Management & Research, 19, 595-612. 538
COLEMAN, D. D., RISATTI, J. B. & SCHOELL, M. 1981. Fractionation of carbon and 539
hydrogen isotopes by methane-oxidizing bacteria. Geochimica et Cosmochimica Acta, 540
45, 1033-1037. 541
CORBETT, J. E., TFAILY, M. M., BURDIGE, D. J., COOPER, W. T., GLASER, P. H. & 542
CHANTON, J. P. 2013. Partitioning pathways of CO2 production in peatlands with stable
543
carbon isotopes. Biogeochemistry, 114, 327-340. 544
DE BERTOLDI, M. D., VALLINI, G. E. & PERA, A. 1983. The biology of composting: a 545
review. Waste Management & Research, 1, 157-176. 546
DE VISSCHER, A., DE POURCQ, I. & CHANTON, J. 2004. Isotope fractionation effects by 547
diffusion and methane oxidation in landfill cover soils. Journal of Geophysical Research: 548
Atmospheres, 109, D18111.
549
DEVER, S. A. 2006. Passive Drainage and Biofiltration of Landfill Gas using Recycled 550
Materials. Sydney: University of New South Wales School of Civil & Environmental 551
Engineering & GHD Pty Ltd. 552
EBY, P., GIBSON, J. J. & YI, Y. 2015. Suitability of selected free-gas and dissolved-gas 553
sampling containers for carbon isotopic analysis. Rapid Communications in Mass 554
Spectrometry, 29, 1215-1226.
555
EINOLA, J., SORMUNEN, K., LENSU, A., LEISKALLIO, A., ETTALA, M. & RINTALA, J. 556
2009. Methane oxidation at a surface-sealed boreal landfill. Waste Management, 29, 557
2105-2120. 558
FRY, B. 2003. Steady state models of stable isotopic distributions. Isotopes in environmental 559
and health studies, 39, 219-321.
30 GEBERT, J., RÖWER, I. U., SCHARFF, H., RONCATO, C. D. L. & CABRAL, A. R. 2011. 561
Can soil gas profiles be used to assess microbial CH4 oxidation in landfill covers? Waste
562
Management, 31, 987-994.
563
GEBERT, J., STREESE-KLEEBERG, J. & PFEIFFER, E. M. Limitations to the quantification 564
of methane oxidation using stable isotopes. 14th International Waste Management and 565
Landfill Symposium, 2013 Sardina, Italy. 566
HACKLEY, K. C., LIU, C. L. & COLEMAN, D. D. 1996. Environmental Isotope 567
Characteristics of Landfill Leachates and Gases. Ground Water, 34, 827-836. 568
IPCC. 2006. IPCC Guidelines for National Greenhouse Gas Inventories [Online]. IGES, Japan. 569
Available: http://www.ipcc-nggip.iges.or.jp./public/2006gl/index.html [Accessed]. 570
KALLEL, A., TANAKA, N., TOJO, Y., MATSUTO, T. & HANADA, S. 2006. Oxygen 571
intrusion into waste in old landfills of low organic content. Waste Management & 572
Research, 24, 242-249.
573
KENDALL, C. & MCDONNELL, J. J. 2012. Isotope Tracers in Catchment Hydrology, Elsevier 574
Science. 575
KJELD, A., CABRAL, A. R., GÚSTAFSSON, L. E., ANDRADÓTTIR, H. O. & 576
BJARNADÓTTIR, H. J. 2014. Microbial methane oxidation at the Fíflholt landfill in 577
Iceland. VERKTÆKNI, 20. 578
KOMILIS, D. P., HAM, R. K. & STEGMANN, R. 1999. The effect of landfill design and 579
operation practices on waste degradation behavior: a review. Waste Management and 580
Research, 17, 20-26.
581
LIPTAY, K., CHANTON, J., CZEPIEL, P. & MOSHER, B. 1998. Use of stable isotopes to 582
determine methane oxidation in landfill cover soils. Journal of Geophysical Research: 583
Atmospheres, 103, 8243-8250-.
584
MA, Y., BRINGEMEIER, D., SCHEUERMANN, A., MOLEBATSI, T. & LI, L. 2012. Fault 585
and fracture zone detection based on soil gas mapping and gamma ray survey at the 586
extension site of an open pit coal mine. Proceedings of the 2012 Coal Operators' 587
Conference.
588
MATA-ALVAREZ, J., MACÉ, S. & LLABRÉS, P. 2000. Anaerobic digestion of organic solid 589
wastes. An overview of research achievements and perspectives. Bioresource 590
Technology, 74, 3-16.
591
O'LEARY, M. H. 1981. Carbon isotope fractionation in plants. Phytochemistry, 20, 553 - 567. 592
OBERSKY, L., RAFIEE, R., XIE, S., GOLDING, S. & CLARKE, W. Determining the 593
simultaneous rates of anaerobic digestion, composting and methane oxidation in shallow 594
waste in an active landfill cell. 15th International Waste Management and Landfill 595
Symposium., 5 – 9 October 2015 2015 Margherita di Pula, Cagliari, Italy. 596
PEDERSEN, G. B., SCHEUTZ, C. & KJELDSEN, P. 2011. Availability and properties of 597
materials for the Fakse Landfill biocover. Waste Management, 31, 884-894. 598
RAFIEE, R., OBERSKY, L., XIE, S. & CLARKE, W. P. 2017. A mass balance model to 599
estimate the rate of composting, methane oxidation and anaerobic digestion in soil covers 600
and shallow waste layers. Waste Management, 63, 196-202. 601
RAFIEE, R., OBERSKY, L., XIE, S. & CLARKE, W. P. 2018. Pilot scale evaluation of a model 602
to distinguish the rates of simultaneous anaerobic digestion, composting and methane 603
oxidation in static waste beds. Waste Management, 71, 156-163. 604
SCHEUTZ, C., KJELDSEN, P., BOGNER, J. E., DE VISSCHER, A., GEBERT, J., HILGER, 605
H. A., HUBER-HUMER, M. & SPOKAS, K. 2009. Microbial methane oxidation 606
processes and technologies for mitigation of landfill gas emissions. Waste Management 607
& Research, 27, 409-455.
608
SCHEUTZ, C., PEDICONE, A., PEDERSEN, G. B. & KJELDSEN, P. 2011. Evaluation of 609
respiration in compost landfill biocovers intended for methane oxidation. Waste 610
Management, 31, 895-902.
611
STURM, K., KELLER-LEHMANN, B., WERNER, U., RAJ SHARMA, K., GRINHAM, A. R. 612
& YUAN, Z. 2015. Sampling considerations and assessment of Exetainer usage for 613
measuring dissolved and gaseous methane and nitrous oxide in aquatic systems. 614
Limnology and Oceanography: Methods, 13, 375-390.
615
THORNELOE, S., REISDORPH, A., LAUR, M., PELT, R., BASS, R. & BURKLIN, C. The US 616
Environmental Protection Agency’s landfill gas emissions model (LandGEM). 617
Proceedings of Sardinia 99 Sixth International Landfill Symposium, 1999. 11-18. 618
WHITICAR, M. J. 1999. Carbon and hydrogen isotope systematics of bacterial formation and 619
oxidation of methane. Chemical Geology, 161, 291-314. 620
WHITICAR, M. J., FABER, E. & SCHOELL, M. 1986. Biogenic methane formation in marine 621
and freshwater environments: CO2 reduction vs. acetate fermentation: Isotope evidence.
622
Geochimica et Cosmochimica Acta, 50, 693 - 709.
623 624