OATAO is an open access repository that collects the work of Toulouse
researchers and makes it freely available over the web where possible
Any correspondence concerning this service should be sent
to the repository administrator:
[email protected]
This is an author’s version published in:
http://oatao.univ-toulouse.fr/23658
To cite this version:
Gheno, Thomas
and Monceau, Daniel
and Young, David J. Kinetics of
breakaway oxidation of Fe–Cr and Fe–Cr–Ni alloys in dry and wet carbon
dioxide. (2013) Corrosion Science, 77. 246-256. ISSN 0010-938X
Kinetics of breakaway oxidation of Fe-Cr and Fe-Cr-Ni alloys in dry
and wet carbon dioxide
Thomas Gheno
a,b.Daniel Monceau
a,David
J.
Young
b,* 'Institut Carnot C/RIMAT, ENS/AŒ, 31030 Toulouse Cedex 4, Franceb School of Materials Science and Engineering, The University of New South Wales, Sydney, NSW 2052, Australia
ARTICLE INFO ABSTRACT
Keywords: A. Steel
C. High temperature corrosion C. Selective oxidation
Model Fe Cr and Fe Cr Ni alloys were reacted in Ar CO2 and Ar CO2 H2O gas mixtures at 650 °C. lni tially protective oxidation, due to Cr2O3 formation, was usually followed by a transition to rapid oxida tion, associated with Fe rich oxide nodule development. Nodule surface coverage and overall weight gains are modelled on the basis of continued nucleation of nodules, and their diffusion controlled growth. In general, water va pour accelerated nucleation. Alloying with nickel decreased average nucleation rates, but austenitic alloys showed large variations in nuclea tion susceptibility with grain orientation. Slower nodule growth induced by high chromium and nickel levels counteracted the effects of frequent nucleation.
1. Introduction
The current development of technologies aimed at reducing
carbon dioxide emissions from coal combustion, such as oxyfuel
firing, involves handling hot CO
2H
2O gas mixtures, and raises con
cerns as to the oxidation resistance of steels employed as piping or
heat exchanger materials in these environments. While the oxida
tion of steels in CO
2or H
2O rich gases has been extensively docu
mented, reaction in gas mixtures containing large amounts ofboth
speàes has not been well investigated.
Chromium bearing steels used in these applications are subject
to breakaway: the transition from protective oxidation, due to the
exclusive formation of a Cr
2O3 scale, to fast oxidation, character
ised by the rapid growth of iron rich oxides. The Joss of protective
properties is known to be accelerated in the presence of CO
2[ 1 3 )
,
H
2O
[4 9)
, and in CO
2H
2O
[2,3)
atmospheres, as compared to air
or oxygen.
Breakaway is defined as a rapid increase in the oxidation rate.
This can be manifested in a variety of reaction morphologies,
depending on alloy composition. In the case of steels, and also of
Ni base alloys, the associated morphological evolution is non uni
form, as it involves nucleation, spreading and thickening of oxide
nodules on the alloy surface. In some cases, nodule growth is rapid
and starts after a well defined incubation time
[4,6,10)
, which may
be conveniently used to compare the performance of alloys oxi
dised in various conditions. However, as the transition in the oxi
dation kinetics is continuous, it can sometimes be more difficult
*
Corresponding author. Tel.: +61 2 9385 4322: fax: +61 2 9385 5956.E-mail address: [email protected] (D.J. Young). http:/ /dx.doi.org/10.1016/j.corsci.2013.08.008
to define an incubation period. Furthermore, breakaway is very
sensitive to the experimental conditions of the exposure, such as
specimen geometry
[10)
, and kinetics have been reported to vary
between apparently equivalent specimens reacted in the same
conditions
[11)
.
Iron oxide nucleation and growth rates contribute to the Joss of
oxidation resistance in different manners. Both should be taken
into account: it may be preferable for a material to be prone to
scale failure but form relatively slow growing nodules, than to un
dergo Jess frequent nucleation events each leading to catastrophic
metal Joss. However, the characterisation of reaction kinetics
accompanying breakaway oxidation has received little attention.
This paper is focused on the kinetic aspects of breakaway oxida
tion of Fe Cr and Fe Cr Ni alloys in dry and wet CO
2atmospheres
at 650 •c. The effects of gas and alloy composition on the reaction
kinetics are investigated, and alloy oxidation resistance is analysed
on the basis of nucleation and growth rates of Fe rich oxide nod
ules. The work forms part of a larger investigation, aspects of which
have already been reported. Carburisation of Fe Cr alloys in dry
and wet CO
2was studied in Ref.
[12)
, while the mechanism of
breakaway oxidation, and the interactions between selective oxi
dation and carburisation were addressed in Ref.
[13)
.
2. Materials and experiments
Alloys of compositions Fe 20Cr, Fe 20Cr 10Ni, Fe 20Cr 20Ni,
Fe 25Cr, Fe 25Cr 10Ni and Fe 25Cr 20Ni were prepared accord
ing to the procedure detailed in Ref.
[13)
(ail compositions given in
weight % unless specified). The phase constitution of the annealed
materials was determined by XRD: the binary alloys were ferritic,
the ternary alloys containing 20Ni fully austenitic, white the 10Ni
ternaries were dual phase
a.y. Time lapse isothermal oxidation
experiments were carried out in tlowing Ar 20CO
2,Ar 20CO
2SH
2O and Ar 20CO
220H
2O gas mixtures at a total pressure of
about 1 atm using a vertical tube fumaœ, according to the proce
dure described in Ref.
[13)
. Linear gas flow rates were set at about
2 cm s
1.Specimens were weighed before and after exposure using
a precision balance, with an error of 0.1 mg. Continuous thermo
gravimetric analysis (TGA) was perforrned using a Setsys Evolution
microbalance equipped with a Wetsys humidifying system, both
from Setaram. The drift was measured by running experiments
with no specimen in gas tlows corresponding to the experimental
conditions, and values lower than 3 µg h
1were obtained.
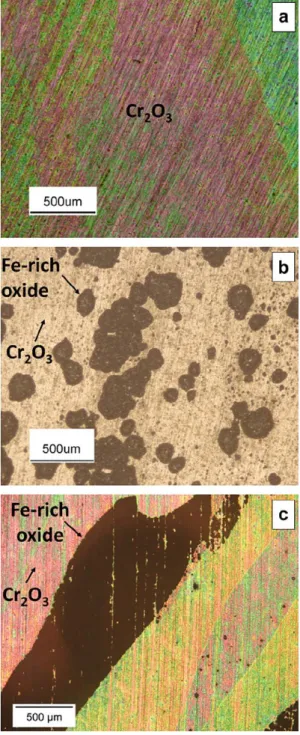
3. Experimental results3.1. Overview
After exposure to Ar CO
2and Ar CO
2H
2O, large differenœs in
oxide development were clearly evident among the alloys, regard
less of gas composition. Ternary alloys containing 25Cr (all alloy
compositions given in wt.%) forrned a thin, protective oxide scale
(
Fig
.
1
a). ln contrast, binary alloys were prone to breakaway oxida
tion, with nodules of thick oxide (
Fig
. 1
b) interrupting the thin,
passivating oxide. Temary alloys containing 20Cr were intermedi
ate in behaviour, passivating some grains, but showing breakaway
on others (
Fig
. 1 c).
Surface are a fractions of nodular oxide,
0,
were measured by im
age analysis of reacted surfaces, using the lmageJ software
[14)
.
Values of
0
reflect the frequency of nodule formation and the rate
at which they spread laterally, white weight gains also include the
effects of nodule thickening, protective scaling, partial spallation,
and any contribution of internai reaction. Spallation affected the
protective scale and part of the thick nodules, both to variable ex
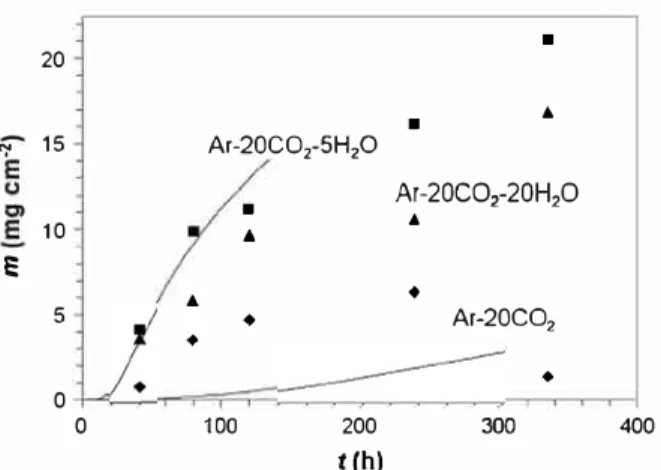
tents. Net weight changes per unit area, m, and
0
values measured
after 336 h reaction are shown in
Fig. 2
. The binary alloys, Fe 20Cr
and Fe 25Cr, underwent significant breakaway, accumulating rel
atively high weight gains. The extent of nodular growth on these
alloys was larger in wet CO
2than in dry CO
2,with nearly complete
surface coverage by nodules in Ar 20CO
2SH
2O and Ar 20CO
220H
2O. Ternary alloys with 20Cr and 10/20Ni showed limited
breakaway, white those containing 25Cr evidenced no breakaway
oxidation kinetics within the duration of these experiments.
3.2. Total we ight gain and surface area fraction of Fe rich oxide
Weight gain kinetics during exposure of Fe 20Cr to dry and wet
CO
2are shown in Fig. 3. Corresponding surface area fractions of
nodular oxide, measured after each isothermal exposure, are pre
sented in Fig. 4. The fact that
mand
0
values did not always in
crease monotonically with time indicates that the breakaway
reaction was poorly reproduàble from one specimen to another.
This was particularly marked during exposure to the dry gas,
where the extent of nodular growth was the lowest. ln the gases
containing 5 % and 20 % H
2O, all Fe 20Cr speàmens reached high
values of
0
(> 80 %), even after short exposure times, resulting in
higher weight gains than those measured in the dry gas. The extent
of nodular growth did not differ significantly between the two wet
gases.
ln order to obtain self consistent kinetic information during
breakaway of the Fe 20Cr alloy, the time lapse experiments were
complemented by TGA experiments conducted in Ar 20CO
2and
Ar 20CO
2SH
2O. Continuous weight gain curves are plotted to
gether with the time lapse results in
Fig. 3
, and
0
values measured
after these TGA experiments are included in
Fig. 4
. ln the case of
Fig. 1. Surface view of samples after 120 h reaction (a) Fe-25Cr-20Ni in Ar-20C(½-20H2O; (b) Fe-20Cr in Ar-20CO2; (c) Fe-20Cr-20Ni in Ar-20CO:r20H2Û.
24 20 0/ 16 Cl 12
E
8 4 0 (100) 100)□
Ar-20CO2 D Ar-20CO2-SHp ■ Ar-20COr20H2O (nia)Fe-20Cr Fe-20Cr-10Ni Fe•20Cr-20Ni Fe-25Cr Fe-25Cr-10Ni Fe-25Cr-20Ni Fig. 2. Weight gain per unit area and associated nodule surface area fraction (bracketed numbers, expressed in percent of the surface area)after 336 h reaction.
"t
E
20 15 10 5 0 0...
♦ Ar-20COr5Hp 100 ■...
♦ 200t
(h)
■ ■...
Ar-20COr20H
20
...
♦ Ar-20CO2 ♦ 300 400Fig. 3. Weight change kinetics measured during reaction of Fe-20Cr. Markers: time-lapse experiments {each point represents a different specimen); solid lines:
TGA experiments. 9 1.2 �---� 0.8 0.6 0.4 0.2 0 0 Ar-20C02-5H20 Ar-20C02-20H,0
--� /2
•
•
♦ 100 ♦ Ar-20C02�
200 300 t(h) 400Fig. 4. Surface area fractions of Fe-rich oxide for reaction of Fe-20Cr. Filled symbols: time-lapse experiments {each point represents a dilferent specimen); open symbols: TGA experiments; solid lines: calculated from Eq. {7}
dry CO
2, the TGA specimen yielded results which fell within the
large range of variability defined by the time lapse experiments.
Reaction in Ar 20CO
2SH
2O produced TGA results (m and 0) in
agreement with the time lapse measurements.
Early stage oxidation kinetics measured by TGA are shown in
Fig
.
5
, together with those recorded during oxidation in dry air of
an Fe 20Cr specimen taken from the same alloy batch. Short term
reaction followed similar kinetics in ail three gases. However, the
rapid increase in weight gain after 2 h reaction in Ar 20CO
25H
2O indicates that the presence of H
2O in the reacting atmo
sphere accelerated the appearanœ of breakaway oxidation.
0.03 0.025f
0.02 tJ en 0.015.§.
E
0.01 0.005 0 0 2 4 6 t(h) 8 10 12Fig. 5. Early stage weight gain kinetics during oxidation of Fe--20Cr in dry and wet CC½ and in dry air.
Time lapse experiments on the Fe 25Cr alloy produced m and
0values qualitatively similar to those presented above for Fe 20Cr.
The presence of H
2O(g) had the same effect, in that the extent of
nodular growth was consistently high after reaction in Ar
20CO
25H
2O and Ar 20CO
220H
2O, but lower and more variable
after exposure to Ar 20CO
2, as seen in
Fig
.
6
, where each point rep
resents a different specimen. The temary alloys Fe 20Cr 10Ni and
Fe 20Cr 20Ni also formed oxide nodules but m and
0values were
lower than those measured on the binary alloys (
Fig
.
2
). The data of
Fig
.
2
represent a single exposure time. Similar results obtained for
a number of different reaction times of the 20Cr ternaries revealed
considerable variability in m and
0values for ail three gases. Sur
face area fractions measured on individual specimens after expo
sures of the Fe 20Cr 20Ni alloy are shown in
Fig
.
7
.
Correlations
between m and
0values are obscured by the statistical spread of
nodule nucleation rates; discussion returns to this point later.
The 25Cr ternaries oxidised very slowly in dry and wet CO
2, at rates
which could not be properly measured by the time lapse tech
nique. The weight uptakes recorded after each exposure did not ex
ceed 0.4 mg cm 2. These alloys formed some small isolated
nodules (too small to be seen in
Fig. 1
a), covering a very small sur
face area fraction, which was not measured.
3.3. Iron rich oxide growth rate
Nodule morphologies developed on the different alloys, de
scribed in detail in Ref.
[13)
, are briefly recapitulated. The nodules
formed on Fe 20Cr consisted of an outer part made up of iron
oxide layers, and an inner part containing a mixture of Fe rich
and Cr rich spinel oxide particles. ln the nodules formed on Fe
20Cr 1 0Ni and Fe 20Cr 20Ni, the Fe rich spinel was replaced by
a Ni containing spinel. The Fe 25Cr alloy produced two types of
multilayer oxide: thick nodules like those formed on Fe 20Cr,
and thinner, "healed" scales, which contained an inner Cr rich
layer. lntragranular carburisation of the binary alloys was exten
sive where Fe rich nodules formed, and limited or absent beneath
Cr
2O
3and the healed scale. The Fe 20Cr 10Ni alloy formed only
scattered intergranular carbides, and Fe 20Cr 20Ni and the 25Cr
temaries did not form any carbide. The gas composition had no sig
nificant influence on the carburisation rate measured for Fe 20Cr
[12)
. ln the case of Fe 25Cr and Fe 20Cr 10Ni, however, the pres
enœ of H
2O(g) caused a decrease in the extent of carburisation.
Nodule thickening kinetics measured for Fe 20Cr were de
scribed in Ref.
[13)
using the parabolic law
X
22k
p
,Fe
oxt(1)
where Xis the maximum nodule thickness and
kp.Fe oxthe parabolic
rate constant. The gas composition had no significant influence on
1.2 ---� 0.8 9 0.6 0.4 0.2 Ar-20C02-5H20
�
� Ar-20COr20Hp...____�
°'+ Ar-20C02O+----��---�---���-<
0 100 200 t(h) 300 400 Fig. 6. Surface area fraction of Fe-rich oxide measured for Fe-25Cr {time-lapse experiments; each point represents a different specimen).0.15 0.12 0.09 9 0.06 0.03 0 0 Ar-20C02-20H20 Ar-20C02-5H,O 100 200 t
(h)
300 400Fig. 7. Surface area fraction of Fe-rich oxide measured for Fe-20Cr-10Ni {time lapse experiments; each point represents a different specimen).
the rate constant. Values of
k
p.Fe
axwere estimated using a limited
number of specimens of the three other alloys prone to breakaway
oxidation In the case of Fe 25Cr, the kinetics were measured for
both types of iron bearing scale. Values of
k
p.Fe
axobtained this
way are Jisted in
Table 1
, reproduced from Ref.
[13]
.
Since nodules grown on a given specimen have varying sizes
(
Fig
.
1
), measuring the maximum thickness observed on a cross
section would produce non representative results. In the case of
Fe 20Cr, these results were for this reason compared with rate
constants obtained from weight gain measurements. Considering
the fact that extensive carburisation did not occur below Cr
2O
3,
the total weight gain per unit area m may be expressed so as to re
flect the contribution of Fe rich oxide, carbides and Cr
2O
3.
m 0(mF,
ox+ mMc,) + (1 0)mer,o,
(2)
where m
iis the average weight uptake per unit are a of the indicated
phase. In the present experiments, orders of magnitude of the
weight uptakes are calculated to be 10, 1 and 0.1 mg cm
2for Fe
rich oxide, carbides and Cr
2O
3, respectively. Consequently, the con
tribution of the carbides and Cr
2O
3to the total weight gain may be
neglected, and Eq.
(2)
approximated as
m
0
(3)
Assuming that nucleation of Fe rich oxide occurs initially, at
t
= 0, and not subsequently, the values of m and
0
measured after
time Japse exposures may be used to estimate nodule growth
kinetics. The variety of nodule sizes found on a given speàmen
(
Fig
.
1
) shows that the hypothesis of exclusive initial nucleation
is not valid. However, it allows a very simple quantitative treat
ment of weight gain kinetics,justified in Section
4.2
using a mode!
which takes into account continued nucleation throughout the
exposure. The values of m
Fe oxcalculated from Eq.
(3)
are plotted
in
Fig
.
8
, and confirm that nodule growth on Fe 20Cr followed
approximately parabolic kinetics. The variability associated with
Table 1
Fe-rich oxide thickening rate constant, kp.r,, ox {10 11 cm2 s 1) {reproduced from (13)).
Fe-20Cr Fe-20Cr-10Ni Fe-20Cr-20Ni
Fe-25Cr {thick nodules) Fe-25Cr {healed scale)
Ar-20CO, Ar-20CO,-SH20 Ar-20C0,-20H,O
12 12 8.5 3.1 6.7 0.069 1.0 5.1 0.069
breakaway prevents the influence of gas H
2O content from being
clearly identified. For uniformly thick and dense oxide, gravimetric
(k
w)
and thickening
(k
p)
rate constants are related through
[15]
kw
(
V
16b
)\
P
(4)
M.iOi,
where V
M,o. is the molar volume of oxide M
aO
b. Approximating the
average oxide as dense Fe
3O
4,the average gravimetric rate constant
obtained from
Fig
.
8
,
kw.Fe
ax= 1.2 x 10
4mg2 cm
4s 1. is con
verted to a thickening constant
k
p.Fe
ox= 6.1
x
10
11cm
2s 1. in
reasonable agreement with the values given in
Table 1
for Fe
20Cr. A difference between these values must emerge from the fact
that nodules are ellipsoid, and not fiat topped. The error is maxi
mum for small individual nodules, and decreases as nodules coa
Jesce and form uniformly thick scales. Offsetting this error is the
systematic underestimation of nodule thickness resulting from
the fact that random cross sections do not on average pass through
nodule centres.
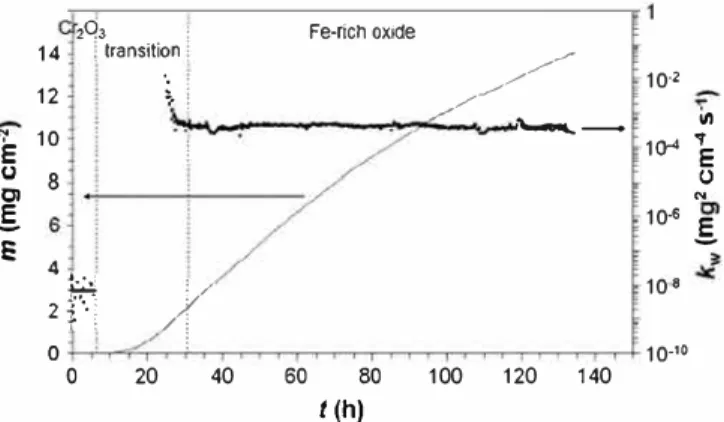
Iron rich oxide growth kinetics on Fe 20Cr were estimated in a
third independent way. The local fitting procedure described in
Ref.
[16]
was applied to the TGA data recorded during reaction in
Ar 20CO
25H
2O, in order to determine the instantaneous gravi
metric rate constant during the whole reaction. The rate constant
is calculated according to
t
a +bm+cm
2(5)
where
a
and
b are constants, and
c
±·
This procedure allows a
correct determination of kw
during a parabolic regime which fol
Jows a transient regime with different kinetics
[16]. The resulting
curve k
w=
ft.t), shown in
Fig
.
9, is divided into three regions. Initially,
as
0
is Jow, the weight gain retlects Cr
2O
3growth, and accordingly
k
wis very small. After a first inflection in the weight gain curve ( vis
ible at
t �2 h in Fig
.
5), and as
0
and m rapidly increase, k
wis not
defined (parabolic rate constants do not apply to convex weight
gain functions). After a second inflection point, a second stage of
parabolic kinetics is reached, and k
wattains a constant, high value.
Using the molar volume ofFe
3O
4,the gravimetric constant obtained
this way is converted to k
p= 1.9 x 10
10cm
2s
1,a value co nsistent
with that given in Table 1 for the directly measured rate constant of
Fe rich oxide grown on Fe 20Cr.
4. I<inetics modelling
The effects of alloy and gas compositions on breakaway oxida
tion are usefully considered within the framework of a reaction
500 400 300
�
!
200 1000
0 50 100 150 200 250 300 350t
(h)
Fig. 8. lron-rich oxide growth kinetics for Fe-20Cr {time-lapse experiments; each point represents a dilferent specimen} expressed in terms of corrected weight gains defined in Eq. (3).
�
IJ Clg
E
14 12 10 8 2Q3 ! i transition i·;
l
l
:�
1/
0 0 20 40 Fe-rlch oxkle 60 80 t (h) ✓-// 10·2 // ""-.-,.
ill 10 .. E () N 10.sg
10·• 10-1• 100 120 140Fig. 9. Weight gain measured by TGA during oxidation of Fe-20Cr in Ar-20C(½ SH:i() and local gravimetric rate constant, determined after method in Ref. (16].
mechanism. As is clear from the present results and those already
presented
[ 13 )
, the mechanism of breakaway is qualitatively simi
lar for ail alloys investigated: nucleation and growth of iron rich
oxide nodules, as a result of local failure of the initially formed
Cr
2O
3scale. As the nodule thickening and spreading rates are re
lated
[13)
, only one growth process needs to be considered.
Questions of importance in a kinetic description therefore con
cern the relative contributions of nucleation and growth, the uni
formity or otherwise of these processes over a specimen surface,
and their reproducibility from specimen to speàmen. To be useful,
any kinetic description needs to encompass the way in which each
of the nucleation and growth processes is affected by alloy chro
mium and nickel levels, and water vapor.
A starting point is provided by the assumption that nucleation
is a random event, occurring with equal probability on any alloy
surface where a chromia scale is still present. This simplifying
assumption allows the application of classical phase transforma
tion kinetic theory in developing an expression for surface cover
age as a function of exposure time. A numerical mode! is then
developed for the purpose of summing the weight uptake contri
butions of ail nodules, and arriving at the overall kinetics of weight
uptake.
4.1. Madel for nucleation spreading of Fe rich nodules
The surface area fraction of Fe rich oxide,
0,reflects both the
frequency of nodule nucleation, and the rate at which they spread
laterally. Evans
[17)
proposed a simple mathematical treatment of
the problem of a surface covered by films spreading out as expand
ing circles. In the present case, individual nodules were approxi
mately circular in plan (
Fig
.
1
). As nodules observed on a given
speàmen surface had varying sizes, it is assumed that nucleation
occurs continuously until complete surface coverage is reached.
In the case of the 20Cr temary alloys, surface coverage varied
greatly according to grain orientation (
Fig
.
1
c). However, since
available experimental data reflect nodule development on entire
speàmens, nucleation growth kinetics can only be described in
an overall way, reflecting average behaviour. Similarly, the influ
ence of speàmen edges and suspension holes is disregarded. It is
thus assumed that nucleation events, which occur on the still
uncovered portion, are independent in time and position. In earlier
work
[13)
, nodule lateral growth kinetics were described as
r2 2k,t
(6)
where r is the nodule radius,
k
1the lateral growth rate constant
(k
1= 0.73
k
p.Fe
oxfor ail alloys and gases), and
tis the time elapsed
since an individual nodule nucleated. Taking this rate law into
account, Evans' analysis
[17)
is adapted to yield
0
1 exp (
nQk1t
2)(7)
where Q is the number of nuclei formed per unit of surface area and
time, or nucleation rate. It is noted that Eq. (7)
is a particular case of
Avrami (or Kolmogorov Johnson Mehl Avrami) kinetics
[18). In
particular, the fact that expanding nodules eventually overlap is ac
counted for.
Applicability of the uniform nucleation hypothesis, where
Qis
constant in time and space, to nodule development kinetics is first
assessed by examining the evolution of
0with reaction time. As
seen in
Fig
.
4
, the evolution of
0values measured after reaction
of Fe 20Cr in Ar 20CO
2cannot be represented using a single
monotonie function of time. This retlects of lack of reproducibility
between different specimens of the same composition, a problem
discussed in Section
5.1
. Similarly, surface area fractions recorded
after exposure of the Fe 25Cr alloy in Ar 20C0
2(
Fig
.
6
), and of
the 20Cr ternary alloys in ail gases (see
Fig
.
7
for Fe 20Cr 20Ni),
cannot be described using a single nucleation rate.
Reaction of the binary alloys in wet CO
2, however, led to consis
tently high
0values (
Figs
.
4 and 6
). The general form of Eq.
(7)
is
then examined by representing ln( 1
0)
as a function of t2, as shown
in
Fig
.
1 O
. Cases for which
0= 1 cannot be taken into account, and
are omitted. In this semi log representation, Eq.
(7)
corresponds to
a straight line passing through the origin of coordinat es (0, 0), with
a slope proportional to
Q.Although the small number of experi
mental data points limits the precision of this analysis,
0values
measured after reaction of the binary alloys in wet CO
2are seen
in
Fig. 10
to be compatible with Eq.
(7)
for short reaction times.
However, data recorded after longer reaction times deviate from
the trend seen in early reaction: long term
0values seem to corre
spond to lower nucleation rates than those typical of shorter term
data. This deviation might be rationalised by considering the pos
sibility that after a stage of relatively rapid nodule development,
complete surface coverage is not reached as fast as predicted in
the situation of uniform nucleation depicted by Eq.
(7)
. As seen
in
Figs
.
4 and 6
, the last 5
%
or so of the specimen surfaces would
thus appear to resist nodule coverage to an unexpected degree.
However, whether any systematic delay in achieving complete sur
face coverage actually existed is obscured by the significant vari
ability of the data. In order to circumvent the lack of
reproducibility between different specimens, continuous weight
gains measured by TGA during exposure of Fe 20Cr (
Fig
.
3
) are
2 -0.5 -1
�
-1.5�
-2 1::.=
1::. -2.5 X -3 @ -3.5 -4 -4.5 4 t2 (10' h2) 6 8 10 X Fe-20Cr, Ar-20CO2-5H2O o Fe-20Cr, Ar-20COr20H2O □ Fe-25Cr, Ar-20COi-5H2O t:. Fe-25Cr, Ar-20COr20HP 0 12 0Fig. 10. Semilog representation of the surface area fractions of Fe-rich oxide measured after reaction of the Fe-20Cr and Fe-25Cr alloys in wet CC½ (time-lapse experiments; each point represents a dilferent specimen).
now used to evaluate
0 throughout the reaction of a single
specimen.
4.2. Mode/for nucleation spreading thickening of nodules
Weight gain kinetics arising from nucleation and growth of
oxide nodules during breakaway oxidation were analysed by Cox
et al.
[11)
using a relation equivalent to Eq.
(2)
. However, weight
gain and nodule surface coverage kinetics can only be related
through Eq.
(2)
if nucleation occurs initially, at
t =0, and not sub
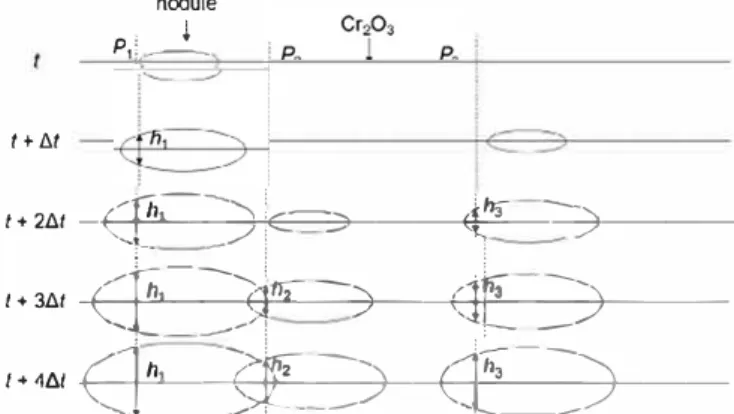
sequently. In the present situation, the observation of nodules of
significantly different sizes at a given time shows that nucleation
continues throughout the reaction until surface coverage is corn
plete. As represented schematically in
Fig
.
11
, the total weight up
take at any given time then depends on the nodule "age" (or size)
distribution, and not solely on the total surface area fraction
0. The
Fe rich oxide thickness at any given point on the surface is deter
mined by the time elapsed since an expanding nodule reached this
point. In order to mode! weight gain kinetics, a statistical approach
is presented, based on the probability that any given point is cov
ered by Fe rich oxide in a given time interval. This analysis is con
structed on the basis of the statistical mode! for oxide scale
spallation during thermal cycling presented in Ref.
[19)
.
Weight gain kinetics for uniform Fe rich oxide growth are de
scribed using a simple parabolic law:
m;, ox 2kw,Fe oxt
(8)
Time is then described as a discrete quantity:
t =nM, where
n
is a positive integer and
M a fixed time step. Thus the weight
gain accumulated by a uniform scale from step 1 to step
n,
Mn
=m(t= nM), is written
M
nM,
✓n
(9)
with M1
J2k
wf• oxdt. The weight gain due to carbides and Cr
2O
3is neglected at this stage. If a point Pon the surface is covered by a
nodule at the beginning of the high temperature exposure, i.e. dur
ing the first time step, the "local" weight uptake at point
Pduring
the nth time step is
'1.M
1 nM
1 (✓
n ✓n 1) for n ;;;,, 1
(10)
The surface area fraction of Fe rich oxide, O(t), is the cumulative
distribution function for surface coverage. Hence the probability
that point
Pis reached by a nodule before time step
i is O(iM),
denoted by
O
i. Therefore, the probability that point P is covered
t
+
llt nodule . j P1)- -t + 2-t.-t-+
-,+-'-
h
�
Cf=
"---
-
_
-
-)+iE-
i
C=--_),---.
�
;
-'--
¼-
3 ---)+---I + 3t.t-+Et--+-'
h�---____.9_,_
1 -rr:;----�2----1)---+-cr=+-:
_:_��-)+---
/ + 4t.t+-c
:
-
-+
i-
1�
h
-
--1-
�
---,
,..._
!
2
_�-)
-+-
--+-E}
---,
;
>
-
'Ç
_-_
-
_
"
_)-+----...._
--- ,
l-Fig. 11. Scheme representing an alloy cross-section during a continuous nucle ation-growth process. A nodule reached P, between r and r + t.r, while P3 was covered between r + t.r and r + 2t.r, and P2 between r + 2t.r and r + 3t.r. The relation h? • 2k,,.� ox(t- ti) applies to ail three points, and at any given time h1 > h3 >
�-during time step
i, that is between t
=(i 1 )M and t
=iM, is O
iO
i 1,for
i ;;;,, 1. If a nodule reached P during time step i, the weight
uptake at point
Pduring the nth time step is
'1.M
inM1
(Jn i +
1 ✓n 1) for n ;;;,, i
(11)
The total weight uptake during time step n, 8Mn, is then calcu
lated by adding, for every step
i, the product of the probability that
P
was reached by a nodule during step
i and the associated weight
gain:
01M1 (✓n ✓
n
1)
+
(02+
(O
ioi
,)M, ( Jn
i+
1
+
(O
nO
n1)M1 for
n ;;;,, 1
01)M1 (✓n 1
✓n
i)
+ ...
✓
n
2)
+ ...
(12)
The first term is related to areas covered by nodules during the
first time step, leading to a minimum weight uptake during time
step
n;the last term represents areas covered by nodules during
time step n. The probability that point
Phas not yet been covered
by any nodule at time step
n
is 1
O
n. The corresponding weight gain
is zero, as the contribution of Cr
2O
3is neglected at this stage. Thus,
provided that 0
0 =0, the fact that
(13)
proves that ail possible events have been taken into account in Eq.
(
12
�
Chromia is assumed to grow according to parabolic kinetics:
m�,,� 2kw
,
er
,
�
t
(14)
The hypothesis is reasonable in view of the early stage kinetics
results presented in
Fig
.
S
. The relative contribution of Cr
2O
3to
the total weight gain is significant in early reaction times, where
the surface covered by nodules is relatively small. Since relevant
kw.Feox values are four orders of magnitude larger than kw,c,,o,, this
contribution becomes negligible quite rapidly after breakaway has
started. Thus, the accumulated weight gain at time step N, which
is the quantity measured experimentally, may be approximated as
mN J2kw,er,o,NM+� ,'1.M
nfor
N;;;,: 1(15)
which in combination with Eq.
(12)
yields
mN
=J2kw,er,o,N11t
+
I::
,I;
1[
1i0
1J
2k
w�
ox
11t( /n
i+
1
ln
i)
]
forN
�
1 (16)
with
!!,.O
i =O
iO
i,. Here the surface area fraction associated with
chromia scale is omitted: the term is dominant when
0 � 0, but
quickly becomes negligible as
0 increases.
Although no assumption was made as to the distribution of
nucleation events in time or space, that is, on the way in which
0
evolves with time, the general form Eq.
(16)
relates total weight
uptake to nodule coverage, provided only that
kw,
er
,o
,
and
kw
.Fe
oxare known. The equation is then used to determine
0 from weight
gains recorded by TGA during exposure of Fe 20Cr to Ar 20CO
2_
SH
2O, according to the following procedure. Since the weight
gain at any given time depends on the nodule size distribution,
and consequently on ail past
0
values, Eq.
(16)
was solved for
!!,.0
numerically: step by step,
!!,.O
iwas evaluated so that the calculated
weight gain matched the experimental weight gain, using ail pre
viously determined
!!,.O
ivalues. The computation was performed
with Mathematica version 8.0
[20)
. A time step
M
=1 h was used;
this value was verified to be sufficiently smallto have no effect on
the results. The rate constant for Cr
2O
3growth was determined
from the early stage reaction kinetics measured by TGA (
Fig. 5
),
which yielded
kw,er,o,
=5.4
x
10
9mg2 cm
4s
1.The procedure yielded a series of
.6.0
ivalues, used to obtain
O
ivalues with the assumption that
0
0 = O. The rate constantkw.Fe
ox
was adjusted so that the value of
0
calculated for
t
= 135 h, the
duration of the TGA experiment, matched the value measured
experimentally at the end of the reaction. This yielded
kw.Fe
ox = 3.4
x 10
4mg2 cm
4s
1or, again using the molar volume of Fe3O
4,
k
p.
Fe
ox = 1.7
x
10 10 cm
2s
1.in reasonable agreement with the
value determined from thickness measurements (
Table 1
).
Values of
0
resulting from the application of Eq.
(16)
, plotted in
Fig
.
12
, follow an S shaped curve, as expected for a nucleation
growth phenomenon. lt is desirable to compare this curve to that
obtained within the uniform nucleation rate hypothesis, Eq.
(7
�
using nucleation and growth rates corresponding to the measured
weight gains. This is done by replacing
O
iin Eq.
(16)
by the
expression
(17)
where the observed
[13]
relationship k
1= O.73k
p.Fe
ox has been used.
With the general shape
ofOnow set by Eq.
(17)
, Eq.
(16)
was fitted
to the TGA data recorded during exposure of Fe 20Cr to Ar 20CO
25H
2O by adjusting the product Qk
p.Fe
ox and k
w.Fe
ox· A wide range
of adjustable parameter combinations was explored in order to en
sure that a global optimum in the fit was arrived at. The nucleation
rate Q
was then obtained using the adjusted
kw.Fe
ox value, con
verted to a
k
p.Fe
ox value via Eq.
( 4)
. Again, a time step
.6.t=
1 h
and the value k
w,er,o, = 5.4 x 10
9mg
2cm
4s
1were used. The va
lue of k
p.Fe
ox obtained from this optimisation procedure is seen in
Table 2
to be in reasonable agreement with that determined from
time lapse experiments for Fe 20Cr in Ar 20CO
25H
2O (
Table 1
).
Furthermore, the agreement between the optimised and experi
mental weight gains is excellent (
Fig
.
13
).
Substitution of the adjusted values of
Q
and
kw.Fe
ox in Eq.
(7)
yields the curve plotted in
Fig
.
12
, where it is compared with that
obtained from Eq.
(16)
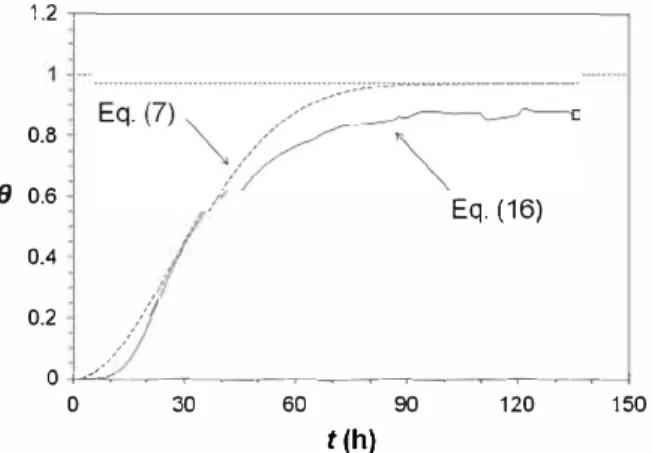
alone. lt is seen that
0
values derived from
TGA data via Eq.
(16
)
, where no constraint was placed on the dis
tribution of nucleation events, deviate from uniform nucleation
spreading kinetics (Eq.
(7
)
). Toward the end of the experiment,
0
reaches a nearly constant level, despite the fact that coverage is
not complete. However, the general shape of this
0
curve is quite
similar to that expected from the uniform nucleation hypothesis.
This is an important observation, the consequences of which are
discussed in Section
5
.
1
.
1.2 �---� 0.89
0.6 0.4 0.2 /'/ / ,//Eq. (16)
0+-'-"-4--�---�--�---�---1
0 30 60 90 120 150t(h)
Fig. 12. Surface are fraction of nodules during exposure of Fe-20Cr to Ar-20C0,-5H,O, obtained from TGA data and Eq. {16) (no hypothesis on the distribution of nucleation events} and from combined use of Eqs. {16) and (7)(uniform nucleation hypothesis} Oeta ils given in text.
4.3. Simplified modelling
Although the two numerical optimisation procedures presented
above proved successful in simulating weight gain kinetics arising
from continuous nucleation and growth of Fe rich oxide, their
scope of application is restricted by the non algebraic form of Eq.
(16
)
. A simpler mode! is readily obtained by estimating weight up
take with the approximation that nodules nucleate at time zero
and spread as fiat topped islands:
m(t) (1 0(t))J2k
w,er,o,t
+
0(t)J2kw,Fe oxt
(18)
However, the form of
O(t)is found by retaining the hypothesis of
continuous nucleation, and rephrasing Eq.
(17)
as a continuous
function:
0(
t) 1 exp( O.
73nQk
p,
Fe
oxt2)
(19)
Again the growth of both Cr
2O
3and Fe rich oxide is described with
a simple parabolic law, and the contribution of carburisation to
weight change is neglected.
The approximate analytical expressions
(18) and (19)
were fit
ted to the TGA data recorded during oxidation of Fe 20Cr in Ar
20CO2
5H2O according to the procedure described above for the
numerical mode! of Eqs.
(16) and (17)
. The corresponding weight
gains are plotted as a dashed line in
Fig. 13
. Values of the optimised
parameters Q and
kw.Fe
ox are seen in
Table 2
to be in reasonable
agreement with those obtained from the numerical mode!.
lt is recognised that the hypotheses underlying Eqs.
(18) and
(19)
, initial and continuous nucleation, respectively, are mutually
exclusive. The relative success of the approximate analytical mod
el, which combines Eqs.
(18) and (19)
, in simulating weight gain
kinetics in a situation of continuous nucleation (
Fig. 13
and
Ta
ble 2
), is related to the parabolic nature of nodule growth kinetics.
As growth rates continually decrease, the contribution of smaller,
newer nodules to the total weight uptake tends to catch up with
that of larger, aider nodules. Furthermore, as the reaction proceeds
and
0
increases, Jess surface is available for new nucleation events.
lt is also acknowledged that simultaneous lateral growth and
thickening of fiat topped nodules is not realistic. Again, this contra
diction is rationalised by considering the fact that nodules which
grow according to parabolic kinetics and coalesce tend to form uni
formly thick scales.
Comparison of the simulated weight gains in
Fig. 13 indicates
that the numerical mode! is better adapted than the approximate
analytical mode!. lt allows a more accurate fitting of the experi
mental data, while using the same number of adjustable parame
ters. The error made when applying the approximate mode! is
now evaluated. Both models use the same expression to define
the evolution of
0
with time (Eq. (17) or the equivalent (19
)
), but
they inevitably yield different values of the nucleation and growth
parameters. Thus, the relative ditference in the time needed to
reach any given
0
value is found from Eq. (19) to be
lit
t
approxt
numt
t
num✓
(kw,
Feo
xQ)
nu
ml
(kw,Fe ox
Q)
aprox (20)where the subscripts
num
and
approx
refer to the numerical and
approximate mode!, respectively. The optimised values of
Qand
kw.Fe
ox (
Table 2
) yield
M/t
= 35 %. Although it is not, strictly speak
ing, applicable to a situation of continuous nucleation, the analytical
expression
(18)
provides a reasonable approximation to the exper
imental data. This provides an empirical basis for the use of the sim
pie Eq.
(3)
for evaluating Fe rich oxide growth kinetics from total
weight gains.
Table 2
Nodule nucleation and growth rates from modelling TGA data for reaction of Fe-20Cr in Ar-20CÛ2-5l¾O•.
Numerical model Eqs. (16) and (17) Approximate analytical mode! Eqs. (18) and (19)
kw.� ox (mg2 cm 4 s 1) kp.� ox (cm2 s 1) ü(cm 2s '} 2.7x10⁴ 1.3 X 10 lO 1.7x10 1
• kp Obtained from kw.� ox values via Eq. ( 4), using molar volume of Fe304•
15-- - - -- - - --�
-Experimental data
-Numerlcal mode!, Eqs. (16) and (17) 12 Approxlmate analytical model.
"! E 9 u .§. 6 E 3 Eqs. (18) and (19) 0-1----::....,...-�---I 0 30 60 90 120 150 t
(h)
Fig. 13. Experimental (TGA) and fitted weight gains for oxidation of Fe-20Cr in Ar-20CÛ2-5H,O. Fitted values obtained from optimisation of numerical mode( (Eqs.
(16) and (17)) and approximate analytical mode! (Eq. (18) and (19)).
5. Discussion
Nodule development on speàmens of the same composition re
acted in a given gas was seen in Section
3.2
to be subject to consid
erable variability, in agreement with previous investigators
[10.11)
. The use of models to describe
0
and m kinetics allows
the variability associated with breakaway oxidation to be analysed,
and the effect of gas and alloy composition on nodule nucleation to
be evaluated. The applicability of ideal nucleation growth kinetics
to TGA data, for which weight uptake information is available
throughout the exposure, is discussed first.
5.1. Variability of nucleation
The constant nucleation rate numerical model used for opti
misation of weight gain kinetics in Section
4.2
is based on two
equations: Eq.
(16)
to relate weight gains to surface area frac
tions, with no constraint on the distribution of nucleation events,
and Eq.
(17)
or its equivalent
(7
)
, which specifies the form of
O(t)
resulting from the uniform nucleation hypothesis. When fitted to
the weight gains recorded during exposure of Fe 20Cr to Ar
20CO
25H
2O, this model is in error in that it predicts a
0
value
approaching 1 at the end of the TGA experiment, whereas
O(t
= 135 h) was measured to be 0.9 (
Fig
.
12
). Nevertheless, appli
cation of Eq.
(16)
alone to the TGA data yields a surface coverage
evolution that conforms rather well to the general form of Eq.
(7 )
,
that is, to uniform nudeation growth kinetics. Examination of the
data presented in
Fig
.
12
reveals that the
0
curve obtained from
Eq.
(7)
can be scaled down to match that corresponding to Eq.
(
16
)
. From the point of view of kinetic modelling, this explains
why weight gains optimised on the basis of a constant nucleation
rate fit experimental data very well (
Fig. 13
). An explanation for
this observation could be that nucleation was indeed uniform,
but on only 90 % of the specimen surface. The implied ability of
the remaining 10 % to resist nodule formation requires explana
tion. The alternative possibility of a lower nucleation rate can
1 .9x104 9.4 X 10 11
1.3x101
be rejected, because it would fail to match the form of the
O(t)
curve.
Differences in nodule nucleation behaviour on a specimen sur
face must retlect inhomogeneities, such as the presenœ of grain
boundaries or other defects, or of grains with particular crystallo
graphie orientations. Accelerated chromium supply at the alloy
grain boundaries is to be expected for austenitic materials at low
temperatures, and has been observed to prevent ( or at least delay)
breakaway in the case of a 304 steel reacted at 600 •c
[21 )
. lt is
questionable whether such an effect would be important for higher
diffusivity ferritic alloys reacted at 650
•c.
and it was not observed
in the present study.
Grain orientation has been shown to affect the nature of the
oxide formed on Fe Cr alloys reacted in
COi
1%CO at 600 •c
[22)
. During reaction of Fe 10Cr and Fe 20Cr single crystals in
low pressure 0
2at 627 °C
[23 )
, ( 110) surfaces formed Cr rich
a.Fe
x.
Cr
2 x03,whereas (100) surfaces formed spinel oxides, for both al
loy compositions. ln both Refs.
[22)
and
[23)
, epitaxial
relationships were invoked by the authors to explain the stabilisa
tion of either rhombohedral or cubic oxide during the initial stage
of oxidation. If substrate oxide orientation relationships can deter
mine the nature of the oxide initially formed, they might also affect
the growth rate of the protective scale, or its propensity to suffer
mechanical failure. However, nodule free areas on the surface of
the Fe 20Cr specimen used for the TGA experiment in Ar
20C0
25H
2O did not seem, by visual inspection, to coincide with
individual grains. Other sources of inhomogeneity, sudl as impuri
ties or inclusions non uniformly distributed on the metal surface,
might have affected nodule nucleation
Likewise,
0
and m values measured after time lapse experi
ments (Section
3.2
) retlect differences in the surfaces of several
specimens of the same composition, exposed to a given gas. ln
the case of the ternary austenitic alloys, the prevalence of a corre
lation between grain orientation and nodule density is clear, as
seen in
F
ig
. 1
c. Grains still covered by Cr
2O
3exhibit varying inter
ference colours, which reflect differences in oxide thickness. While
the reasons for varying oxide growth rate with grain orientation
cannot be identified from the present work, the consequences in
terms of protective oxide failure, and consequently nodule nucle
ation, are readily anticipated: growth rates affect the strain energy,
whidl affects the propensity for mechanical failure, and the ampli
tude of dlromium depletion, which contrais the alloy ability to
maintain and reform a protective scale.
lt must be noted that the alloys used in the present work had
large grains (~ 500 µm), and thus a small number of grains per
specimen. ln the case of the 20Cr ternary alloys, the strong corre
lation between grain orientation and nodule nudeation therefore
resulted in a Jack of statistical weight for 0 and m measurements,
and accounts for the large scatter in these variables after time
lapse experiments (see for example
Fig
.
7
).
ln the case of the binary alloys, the nodule distribution was
more or Jess uniform. Variations of the nodule density according
to grain orientation were sometimes observed to a small extent,
but the large variability in
0
and m recorded after reaction in dry
COi
(
Figs
.
4 and 6
) must have had some other source. Reaction of
Fe 20Cr and Fe 25Cr in wet C0
2, however, yielded
0
values which
consistently approached 1 (
Figs
.
4 and 6
). Variability in nodule
development might have been obscured by the rather high propen
sity for nucleation due to the combined presence ofCO
2and H
2O in
the gas. Alternatively, the deviation from uniform nucleation
growth kinetics identified for the TGA experiment may also have
applied, to some extent, to the time lapse exposures. The fact that
0values recorded after reaction of Fe 20Cr and Fe 25Cr in wet CO
2are not perfectly represented by Eq.
(7)
(
Fig
.
10
) could thus be
related to the existence of areas exhibiting enhanced resistance
to nodule development, in addition to variations in the nucleation
rate.
5.2. Influence of alloy and
gas
composition on nucleation rate
The analysis of nodule surface coverage from continuous weight
gain measurements was carried out using one set of TGA data (Fe
20Cr in Ar 20CO
25H
2O), that is, one single specimen. Values of
0and m measured after reaction of several specimens of the same
composition in a given gas indicated that nodule development
was subject to considerable variability (Section
3.2
)
. It is recogni
sed that this variability must emerge from differences in specimen
surfaces, in tum causing heterogeneities in nucleation rate. How
ever, on the basis of the analysis of TGA data, nucleation growth
kinetics may, for comparison purposes, be approximated as uni
form for each specimen. Application of Eq.
(7)
to
0values measured
after time lapse exposures thus allow, for a given alloy gas combi
nation, an average nucleation rate to be calculated, and the vari
ability of breakaway to be evaluated in terms of varying
nucleation rate, that is, in terms of the rate at which the overall
reaction accelerates.
Nucleation rates
Qare calculated in the following manner. For
the binary alloy reactions in wet CO
2, the product
k,Qis obtained
from the slope of the line of best fit in
Fig
.
10
. Data points corre
sponding to long term (240 and 336 h) exposure of Fe 25Cr, likely
representative of locally enhanœd resistanœ to nucleation rather
than globally low nucleation rates, are omitted. In the case of the
binary alloy reactions in dry CO
2and of the temary alloy reactions
in ail gases ( omitted from
Fig
.
10
), it is recognised that the nucle
ation rate varied considerably from one specimen to another. The
product
k1Q
is then determined as the arithmetic average of values
obtained from Eq.
(7 )
, using
0measured after the different reaction
times. For each alloy,
k1
is derived from the relationship
[13]
k1
=
0.73k
p.Fe
ox, usingk
p.Fe
ox values obtained from thickness measurements (
Table 1
). In the case of the Fe 25Cr alloy,
0values re
flect the sum of two sorts of nucleation events, corresponding to
the two types of scale formed after Cr
2O
3failure. These compo
nents cannot be distinguished when measuring
0on the specimen
surfaces. However, metallographic observations on cross sections
showed that the thinner type of scale (healed scale) represented
a major proportion of the post failure oxide products. The contri
bution of the thick nodules was neglected, and healed scale growth
rates were used to determine nucleation rates.
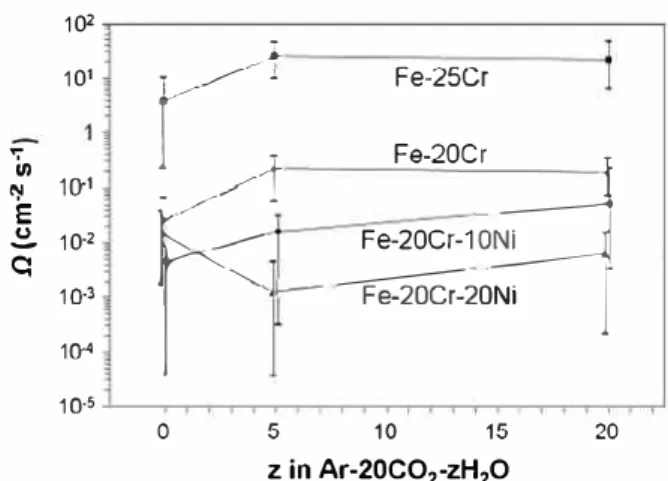
Average nucleation rates for ail alloys and gases are shown in
Fig. 14
, where the error bars indicate minimum and maximum val
ues, and the poor reproducibility of breakaway oxidation is clear.
For ail alloys except Fe 20Cr 20Ni, water vapour is seen to in
crease average nucleation rates. Thus, while no significant effect
was seen in terms of nodule growth rate (
Table 1
), the fact that
H
2O(g) accelerates breakaway oxidation is related to the more fre
quent nucleation of Fe rich oxide nodules. Chromia scales are
known to grow faster in the presenœ of H
2O
[24 26]
. A higher
growth rate would indeed enhance chromium depletion, and fa
vour non selective oxidation after failure of the initial Cr
2O
3scale.
This could not be verified in the present work, as differences in
Cr
2O
3scale thickness between dry and wet CO
2were no greater
than local variations on a given specimen The early stage oxidation
102 101
in
�
10-1E
�
10-2C
1()-3 1()-4 10-S1---,,..---
--1Fe-25Cr
1
_.,,.-j
F,-20c,
j
r
F&20C,-
1
8
0 ''-�ONi5
10
15
z in Ar-20CO
2-zH
2O
20Fig. 14. Nucleation rates resulting from the nucleation-spreading analysis {Eq. (7) applied to O values measured after time-lapse experiments).