OATAO is an open access repository that collects the work of Toulouse
researchers and makes it freely available over the web where possible
Any correspondence concerning this service should be sent
to the repository administrator:
[email protected]
This is an author’s version published in:
http://oatao.univ-toulouse.fr/23667
To cite this version:
Goswami, Sudipta and Bhattacharya, Dipten and Iles, Gail N. and Ghosh, Barnali
and Prytuliak, Anastasiia A. and Malard, Benoît
and Das, Gopes C. and
Ouladdiaf, Bachir and Chatterji, Tapan Anomaly in structural
noncentrosymmetry around TN n bulk and nanoscale BiFeO3. (2013) Powder
Diffraction, 28 (S2). S94-S105. ISSN 0885-7156
Anomaly in structural noncentrosymmetry around T
Nin bulk and nanoscale BiFeO
3Sudipta Goswami,1 Dipten Bhattacharya,1 Gail N. Iles,2 Barnali Ghosh,3 Anastasiia
A. Prytuliak,4 Benoit Malard,4 Gopes C. Das,5 B. Ouladdiaf,6 and T. Chatterji6
1Nanostructured Materials Division, CSIR-Central Glass and Ceramic Research Institute, Kolkata 700032, India 2Helmholtz-Zentrum Berlin, Berlin, Germany
3Department of Materials Science, S.N. Bose National Center for Basic Sciences, Kolkata 700098, India 4European Space Agency, Institut Laue-Langevin, B.P. 156, 38042 Grenoble, France
5School of Materials Science, Jadavpur University, Kolkata 700032, India 6Science Division, Institut Laue-Langevin, B.P. 156, Grenoble 38042, France
Using high resolution powder neutron diffraction data, we show that there is a distinct anomaly in the structural noncentrosymmetry around the magnetic transition point TNfor bulk and nanoscale BiFeO3. It appears that the structural noncentrosymmetry - which gives rise to the ferroelectric polarization - is suppressed by ∼1% in bulk sample and by ∼12% in the nanoscale sample at the onset of magnetic order. This observation shows that the multiferroic coupling improves in nanoscale sample which is expected to brighten the application prospect of nanoscale BiFeO3 in nanospintronics based sensor devices.
PACS numbers: 75.70.Cn, 75.75.-c
In recent times, clear evidence of strong multiferroic coupling at room temperature has been observed in a
single crystal of BiFeO3 in a seminal work.1 However,
whether the ferroelectric order and multiferroic coupling survive in nanoscale system or not has not been clearly determined. The results available in the literature are controversial. While direct determination of ferroelec-tric domain structure and its switching by piezoforce mi-croscopy (PFM) offers a strong evidence of presence of
ferroelectric order in a thin film of just ∼2 nm thickness,2
results of synchrotron x-ray diffraction, on the other hand, show melting of Bi-sublattice even at a size limit
of ∼18 nm.3 Likewise, while powder neutron diffraction
under 5T magnetic field at room temperature yields an
evidence of suppression of polarization by ∼7%,4 x-ray
diffraction on a sample of comparable particle size does
not show any clear signature of multiferroic coupling.5
Therefore, a careful experiment appears to be essential in establishing the survival of ferroelectric order and
mul-tiferroic coupling in nanoscale BiFeO3. In this paper,
we show, with the help of systematic laboratory x-ray, synchrotron x-ray, and powder neutron diffraction data, that indeed multiferroic coupling survives and even
im-proves in the nanoscale BiFeO3. We report our
observa-tion of clear anomaly in structural noncentrosymmetry
around the magnetic transition point TN for both bulk
and nanoscale BiFeO3. The extent of anomaly increases
in the nanoscale.
The precursor powder for bulk and nanoscale BiFeO3
has been synthesized by solution chemistry route.6 The
powder was compacted and sintered at 830oC for 5h for
preparing the bulk sample. The nanosized particles were
synthesized by heat-treatment at 450oC for 2h. The
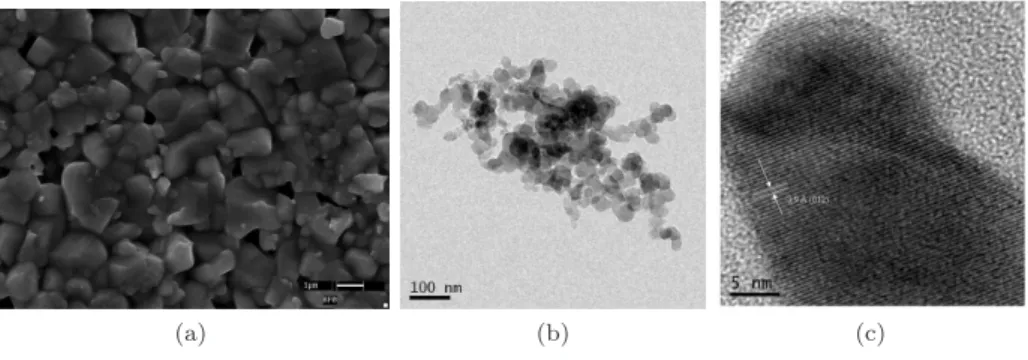
sam-ples have been characterized by laboratory x-ray diffrac-tion, scanning electron and transmission electron mi-croscopy. The representative SEM image of the bulk sam-ple is shown in Fig.1a while the TEM image for the
nano-sized particles are shown in Fig.1b. The high-resolution TEM image shown in Fig.1c shows the nanosized parti-cles to be single crystalline. The magnetic measurement has been carried out across 300-800 K in order to
deter-mine the magnetic transition points TN of the samples.
In Fig. 2, we show the magnetization versus temperature
plot. The TN appears to have dropped down from ∼625
K in bulk to ∼575 K in nanoscale particles. The transi-tion width, of course, has increased from ∼50 K in bulk sample to ∼150 K in nano sample. The broadening of the transition zone results from distribution in the parti-cle size. In order to determine the multiferroic coupling in these samples, laboratory x-ray, synchrotron x-ray, and powder neutron diffraction patterns have been recorded
at several temperatures across the respective TNs. The
synchrotron data have been collected at the ID31 beam-line of ESRF, Grenoble while the powder neutron diffrac-tion data were recorded at the E9 diffractometer of HZB, Berlin.
For determining the accuracy of atom positions, espe-cially of lighter atoms such as oxygen, estimated from the laboratory and synchrotron x-ray data with respect to that determined from the powder neutron diffraction data, we compared the oxygen positions obtained from
these experiments for the bulk BiFeO3. In the
supple-mentary document, we provide the patterns and their refinements as well as the atom positions obtained from
the refinement.7 The results of the refinement are given
in Table-I of the supplementary document. The compar-ison of the oxygen position - obtained from three
differ-ent experimdiffer-ents - shows that while Ox and Oz positions
determined from synchrotron x-ray and neutron diffrac-tion data are comparable within ∼0.5%, the laboratory x-ray data yield a result which differs by ∼2-3%.
In-terestingly, in the case of Oy position, both the
labora-tory and synchrotron x-ray data yield results comparable within ∼0.5% while result obtained from neutron
diffrac-(a) (b) (c)
FIG. 1: (color online) (a) The scanning electron microscopic image of the bulk sintered pellet of BiFeO3; the average grain size ∼0.5 µm; (b) the transmission electron microscopic image of nanoscale particles of BiFeO3; (c) the high resolution transmission electron microscopic image of a nano-sized particle of BiFeO3; the particles are single crystalline with (012) planes perpendicular to beam direction. 300 400 500 600 700 0.00285 0.00290 0.00295 0.00300 0.00305 M a g n e t i z a t i o n ( e m u / g ) T (K) BiFeO 3 - bulk ZFC ~100 Oe T N ~625 K (a) 300 400 500 600 700 0.004 0.008 0.012 0.016 0.020 M a g n e t i z a t i o n ( e m u / g ) T (K) T N ~ 575 K BiFeO3 ~ 22 nm ZFC ~100 Oe (b)
FIG. 2: (color online) (a) The magnetization versus temper-ature plot for bulk BiFeO3; TN turns out to be ∼625 K with
transition width ∼50 K; (b) the magnetization versus temper-ature plot for nanosized particles (∼22 nm) of BiFeO3; TN
drops down to ∼535 K while transition width increases to ∼150 K.
tion differs by a staggering ∼20%. This is quite surpris-ing. It appears that the use of laboratory x-ray and even synchrotron x-ray data for determining the position of oxygen atoms cannot lead to a correct result. We have, therefore, restricted ourselves in using powder neutron diffraction data while investigating the structural
non-centrosymmetry in bulk and nanoscale BiFeO3. In Fig.
3, we show the representative powder neutron diffraction
patterns at several temperatures across the TNs and their
refinement for both bulk and nanoscale samples. The patterns could be refined by considering the space group R3c with hexagonal unit cell. The space group does not change from bulk to nanoscale. The propagation
vec-tor for the magnetic structure is (0, 0, 0) both for bulk and nanoscale samples. The refinement of the diffrac-tion patterns yields the structural details as well as
mag-netic moment per Fe ion in Bohr magneton (µB). For
the bulk sample, the magnetic moment increases from
∼3.239 µB/Fe at room temperature to ∼3.979 µB/Fe at
TN whereas for the nanoscale sample it is ∼3.979 µB/Fe
at room temperature and reaches ∼4.143 µB/Fe around
TN and then drops sharply. In Fig. 4, we show the
vari-ation of the structural parameters such as lattice volume,
bond length, and angle across TNs for both the samples.
Evidently, in both the cases clear anomaly could be seen
around respective TNs. Therefore, onset of magnetic
or-der appears to have influenced the structural parameters significantly. This could result from magnetostrictive ef-fect. The lattice volume depicts a mere change in slope
in variation with temperature across TN for bulk
sam-ple while a clear volume contraction could be noticed
around TN in nanoscale sample signifying first order
na-ture of the transition in nanoscale. It is also possible to note that at any given temperature the lattice volume in-creases from bulk to nanoscale. And while there are two types of (Bi-O) bonds - long and short - within a unit cell for bulk sample, in nanoscale sample, one observes long and short (Fe-O) bonds. The long (Bi-O) bond
short-ens with the decrease in temperature below TN and the
length of the short one increases in bulk sample. Like-wise, in nanoscale sample, the long (Fe-O) bond shortens while the short bond stretches with the drop in
temper-ature below TN. Therefore, there is an anisotropy in the
striction effect both in between two types of bond as well as in between Bi-O and Fe-O bonds. When two types of bond merge into one, it depicts a drop in length both in bulk and nanoscale sample.
The off-center displacement has also been calculated by noting the center of positive and negative charges
in a unit cell.5 The plot of net off-center
displace-ment as a function of temperature is shown in Fig. 5. This is the central result of this paper. For both the bulk and nanoscale samples, clear anomaly could be seen
20 40 60 80 100 120 2 298 K 309 K 498 K 672 K 662 K 652 K 642 K 632 K 622 K I n t e n s i t y ( a . u . ) (a) 20 40 60 80 100 799 K 759 K 719 K 678 K 638 K 577 K 498 K 300 K 2 I n t e n s i t y ( a . u . ) (b)
FIG. 3: (color online) The powder neutron diffraction data and their refinement at several temperatures across TNfor (a) bulk
and (b) nanoscale BiFeO3.
250300350400450500550600650700 2.90 2.95 3.00 3.05 372 374 376 378 2.50 2.55 2.60 78 80 82 T(K) L a t tic e V o l (A 3 ) M ( e m u /g ) T N o (Bi-O)1 (Bi-O)2 o B o n d L e n g th (A ) o B o n d L e n g th (A ) <O-Bi-O> B o n d A n g le ( O ) B o n d A n g le ( O ) 1.68 1.70 1.72 1.74 (Fe-O) 88 89 90 91 92 <O-Fe-O> (a) 250300350400450500550600650700750 0.005 0.010 0.015 0.020 380 390 400 1.8 2.0 2.2 2.4 80 82 84 86 88 M ( e m u /g ) T (K) T N (Bi-O)1 (Fe-O)2 (Fe-O)1 o B o n d A n g le ( O ) B o n d L e n g th (A ) L a t tic e V o l (A 3 ) <O-Fe-O> o (b)
FIG. 4: (color online) The structural parameters such as lat-tice volume, bond lengths, and angles determined from the Rietveld refinement of the powder neutron diffraction data for (a) bulk and (b) nanoscale (∼22 nm) BiFeO3.
around the magnetic transition points. The off-center displacement appears to have been suppressed at the
on-set of magnetic order around TN. While the extent of
suppression for the bulk sample is ∼1%, in nanoscale sample it shoots up to ∼12%. Earlier x-ray diffraction data by others did not show any clear anomaly in
off-center displacement around TN even for a bulk sample.5
Therefore, it appears that the high resolution powder neutron diffraction data are more useful in determining the position of the oxygen ions and hence the off-center displacement in a cell accurately.
Because of antiferromagnetic spin cycloid in bulk
BiFeO3, it was predicted that the linear multiferroic
coupling could be nearly zero.8 Indeed, the
polycrys-talline samples investigated in the past did not depict a
strong coupling.9 However, in a single crystal of BiFeO
3
one observes a very strong coupling.1 The origin of this
strong multiferroic coupling in bulk BiFeO3 appears to
lie in the coupling between polarization resulting from
the spin cycloid10 and that from the polar domains. In
the nanoscale sample of size smaller than 62 nm, the spin cycloid becomes incomplete and hence one should
observe a weak coupling. However, it has been
ob-served that incomplete spin spiral gives rise to a fer-romagnetic component and hence larger magnetization. Large magnetization is associated with the rotation of nonferroelectric oxygen octahedra around the [111] axis
via Dzyaloshinskii-Moriya exchange interaction.11 This
rotation, in turn, is coupled with the rotation of the po-lar domains. Therefore, enhanced magnetization could give rise to an enhanced multiferroic coupling.
Improved multiferroic coupling in nanoscale (∼22 nm)
BiFeO3 brightens the prospect of using this system in
nanospintronics-based devices. It remains to be seen, however, whether the multiferroic coupling improves fur-ther as the size is reduced or does it decrease because of fluctuations in the magnetic and ferroelectric domain structures. The optimum size limit at which one observes strong multiferroic coupling needs to be determined and is a future challenge. 250300 350 400 450500 550 600 650700 750 1.66 1.67 1.68 1.69 1.70 1.05 1.10 1.15 1.20 1.25 1.30 o T N nano T (K) O f f -c e n t e r D i s p l a c e m e n t ( A ) O f f -c e n t e r D i s p l a c e m e n t ( A ) bulk T N o
FIG. 5: The anomaly in noncentrosymmetry around TNboth
for bulk and nanoscale BiFeO3.
resolu-tion powder neutron diffracresolu-tion data, we could see clear anomaly in off-center displacement around the magnetic
transition point TN for both bulk and nanoscale (∼22
nm) BiFeO3. This was not observed earlier from the
x-ray diffraction data. The extent of anomaly, i.e., sup-pression of polarization at the onset of magnetic order increases from ∼1% in bulk to ∼12% in nanoscale. The coupling between the spin cycloid driven polarization and polarization from polar domains gives rise to the multi-ferroicity in bulk system. In nanoscale system, on the
other hand, enhanced magnetization due to suppression of spin spiral leads to an enhanced rotation of nonfer-roelectric oxygen octahedra around the [111] axis. This rotation, in turn, gives rise to the multiferroic coupling observed via interactions between nonferroelectric and ferroelectric domains. It remains to be seen whether the coupling improves further or not if the particle size is reduced further.
One of the authors (S.G.) acknowledges the Research Associateship of CSIR, Govt of India, during this work.
1 D. Lebeugle, D. Colson, A. Forget, M. Viret, A.M. Bataille,
and A. Gukasov, Phys. Rev. Lett. 100, 227602 (2008).
2 Y.-H. Chu et al., Appl. Phys. Lett. 90, 252906 (2007). 3 V. Petkov et al., Phys. Rev. Lett. 105, 185501 (2010). 4 S. Goswami et al., Appl. Phys. Lett. 91, 073106 (2011). 5 S.-M. Selbach, T. Tybell, M-A. Einarsrud, and T. Grande,
Adv. Mater. 20, 3692 (2008).
6 S. Goswami, D. Bhattacharya, and P. Choudhury, J. Appl.
Phys. 109, 07D737 (2011).
7 Supplementary data are available at this url.
8 C. Tabarez-Munoz, Jpn. J. Appl. Phys. 24, 1051 (1985). 9 Y.F. Popov et al., JETP Lett. 57, 69 (1993).
10 M. Mostovoy, Phys. Rev. Lett. 96, 067601 (2006). 11 C. Ederer and N.A. Spaldin, Phys. Rev. B 71, 060401(R)
(2005).
View publication stats View publication stats