To link to this article
: DOI:10.1016/j.wear.2014.04.005
URL:
http://dx.doi.org/10.1016/j.wear.2014.04.005
This is an author-deposited version published in:
http://oatao.univ-toulouse.fr/
Eprints ID: 11540
To cite this version:
Yahiaoui, Malik and Denape, Jean and Paris, Jean-Yves and Ural, Aydemir
Güralp and Alcalà, Noelia and Martinez, Francisco Javier Wear dynamics of a
TPU/steel contact under reciprocal sliding. (2014) Wear, vol. 315 (n° 1-2). pp.
103-114. ISSN 0043-1648
O
pen
A
rchive
T
oulouse
A
rchive
O
uverte (
OATAO
)
OATAO is an open access repository that collects the work of Toulouse researchers
and makes it freely available over the web where possible.
Any correspondence concerning this service should be sent to the repository
Wear dynamics of a TPU/steel contact under reciprocal sliding
M. Yahiaoui
a,n, J. Denape
a, J.-Y. Paris
a, A.G. Ural
a, N. Alcalá
b, F.J. Martínez
baUniversité de Toulouse, Laboratoire Génie de Production, Ecole Nationale d'Ingénieurs de Tarbes (ENIT), 47 avenue d'Azereix, 65016 Tarbes, France bInstituto Tecnológico de Aragón (ITA), Materials and Components Division, Zaragoza, Spain
Keywords: Polymers Sliding wear Stick-slip Thermal effects Acoustic emission Three-body abrasion
a b s t r a c t
The tribological behavior of a thermoplastic polyurethanes (TPU) sliding against a non-polished steel counterface was studied as a function of load, velocity and temperature under dry conditions. Thermomechanical and chemical analyses were carried out on the TPU using DSC, FTIR and DMTA devices prior to the sliding tests. Contact changes were followed using a speed camera and an acoustic emission device. A simple thermal numerical simulation, to calculate temperature rise generated by friction, completes these analyses. To characterize wear performances, a wear rate was determined by considering the linear dependence between the wear volume and the product of the normal load by the travel distance (Archard model). Finally, wear mechanisms of TPU involve both abrasion scratches and adhesion patterns (Schallamach ridges). To conclude, a wear process description using the third body approach was proposed to gather the whole tribological results.
1. Introduction
Thermoplastic polyurethanes (TPU) are greatly used for their low cost, chemical resistance (e.g. resistance to oils and greases), tear resistance, high load bearing, and abrasive resistance[1]. As a tribological part, TPU materials are commonly employed in many fields as automotive industries and sports equipment (e.g. car interior, snowboards coating, and handrails).
Myshkin et al. [2] made a very complete review on the tribological behavior of polymers. In this review, they expose the results published since the mid-20th century on general effects of load, sliding velocity and temperature on the friction and wear of polymers. Accordingly, in the range of tens to hundreds of new-tons, the friction coefficient with polymers follows Amontons– Coulomb's law and usually remains constant with time. However, because of viscoelastic behavior of polymers, the friction can depend on the sliding velocity. Indeed, polymers are sensitive to frictional heating mainly because of the temperature dependence of polymers physical properties. For example, Akbarian et al.[3] displayed TPU rheological curves with great variations of storage modulus and loss tangent from ! 100 1C to !150 1C. In particular, they observed that these rheological changes are more pro-nounced above glass transition temperature. Therefore, Kaltza-korta et al. [4] observed significant changes of tribological behavior with the increasing of contact temperature (e.g. increase
of wear) and the crossing of TPU glass transition temperature (e.g. increase of friction coefficient).
Thermoplastic polyurethanes belong to the class of elastomers and combine mechanical properties of vulcanized rubber and processability of thermoplastics. Hence, the wear mechanisms of polyurethane present similarities with wear behavior of rubbers. Wear of rubbers was first described by Schallamach [5] who observed on worn surfaces a pattern of ridges perpendicular to the sliding direction. These ridges have a sawtooth shape, they are about hundreds micrometers to several millimeters length repre-senting ten times their height [6]. In addition, Schallamach [7] found that the spacing between the ridges is proportional to the cube root of the normal load.
SEM analyses realized by Bhowmick [8] showed that these ridges are the result of local microtears coalescence. As specified by Southern and Thomas [9], cracks are formed underneath the ridges and propagate downwards into the material at a certain angle in the counter sliding direction. More recently, Iwai et al.[10] explained that friction forces, orientation of crack propagation and ridge separation make the ridges move backwards. Eventually, with the growth of ridges, cracks propagate upwards to form a detached worn particle[11]. This particles detachment is supposed to be the result of fatigue mechanism: wear occurs after repeated crack propagation in the rubber and several cycles of mechanical solicita-tions[12]. Other wear mechanisms are also clearly identified in the literature. For example, through SEM observations of TPU worn surfaces, Lima da Silva et al. [13] identified tearing, melting and delamination wears.
Concerning relationship between wear of TPU and experimen-tal conditions, the Archard model is broadly used[14]. This model
http://dx.doi.org/10.1016/j.wear.2014.04.005
n
Corresponding author. Tel.: þ 33 5624 42700; fax: þ 33 5624 42708. E-mail address:malik.yahiaoui@enit.fr(M. Yahiaoui).
defines the proportionality between the wear volume and the product of the normal load by the travel distance. The coefficient of proportionality is then defined as the wear rate.
The present work reports on wear study of TPU in contact with a steel counterface under sliding reciprocating movement in dry conditions. Wear tests are carried out using a long stroke trib-ometer, where the influence of test parameters such as applied load, traveled distance, velocity and temperature is considered. Prior to tribological investigations, a complete material analysis of the samples is carried out. Therefore, the knowledge of TPU physicochemical and rheological properties provides the basis for the analysis of the wear process. In addition to conventional measurements, experiments are assisted with a speed camera and with acoustic emission acquisitions to detect wear events occurring in the contact pair during experiments.
2. Material characterization
2.1. Physicochemical properties
Thermoplastic polyurethanes are made by polyaddition reac-tion of diisocyanates with polyols (i.e. polyesters). This reacreac-tion leads to a microstructure composed by soft segments (SS) of polyols–diisocyanates in long chains and hard segments (HS) formed by boundaries between diisocyanates and short diol chains (Fig. 1). TPU morphology consists in a linear segmented semicrystalline copolymer where short hard crystalline segments (urethane blocks) alternate with rather long soft segments (amor-phous and flexible chains).
In this study, the TPU samples were extracted from commercial guide shoe inserts used in lift car installations. These commercial TPU samples are made of polyester-based polyurethane. A chemi-cal characterization performed by the Fourier transformed infra-red spectroscope (FTIR) using an IRTF Perkin Elmer Spectrum. One clearly identified the urethane component by the two peaks at 1701 cm! 1and 1732 cm! 1 and the polyester part with the peak at 1170 cm! 1
(Fig. 2). The other characteristic absorption bands of polyurethane are related to N–H (3320–3500 cm! 1
), C–H (3000–2800 cm! 1and 1470 cm! 1), and amide groups vibrations (1510 cm! 1
)[15].
These TPU has a density of 1.2370.02 g cm! 3 which was measured with a liquid pycnometer (Table 1). A non-significant mineral charge content of 0.05 wt% was evaluated by loss on the ignition method at 625 1C during 30 min following the standard NF EN ISO 1172. Hardness measurements reach 5471 Sh (D) following the standard NF EN ISO 868. This hardness can also
be related to the Shore A value of 95 73 Sh(A) given by the manufacturer.
The TPU surface has shallow polishing marks. An optical profilometer measurement gives an average roughness Ra of 0:67 0:1
μ
m. Concerning the steel counterface, the surface dis-plays machining marks but also oxidation spots. The average roughness Raof the steel counterface reaches 5:47 0:2μ
m. This surface was not improved in the laboratory in order to maintain the conditions of the industrial application.2.2. Thermomechanical properties of TPU
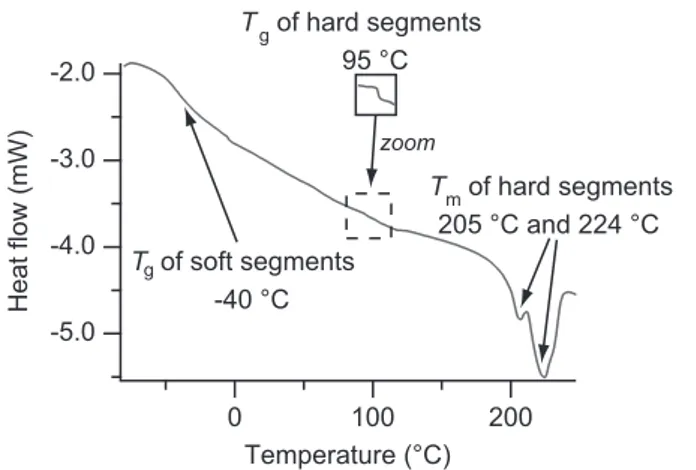
Measurements by differential scanning calorimetry (DSC) were performed using a TA Instruments DSCQ200 device (Fig. 3). Two endothermic peaks are well displayed on the DSC curve associated to two melting temperatures Tmat 205 1C and 224 1C. Saiani et al.[16] proved that these two endotherms are respectively due to the melting of an ordered structure appearing in the hard phase and to a microphase mixing of soft and hard segments. The DSC curve also
(1)
(2)
(3)
SS
HS
Fig. 1. Microstructure of TPU: (1) soft segments (SS) and hard segments (HS) chains; (2) short range ordering hard segments; (3) long range ordering hard segments (microcrystalline structure).
100
80
60
40
20
0
T
ra
n
s
m
it
ta
n
c
e
(
%
)
7 8 91000
2 3 4Wave number (cm
-1)
Urethane
Polyester
Fig. 2. Absorption spectrum of the studied TPU by FTIR: transmittance vs. wave number.
Table 1
Physicochemical and mechanical properties of the TPU at room temperature. Density (g cm! 3) Mineral charges (wt%) Hardness (Sh(D)) Hardnessa (Sh(A)) 1.2370.02 0.0570.02 54 71 95 73
aTheoretical Shore A value of the commercial TPU.
-5.0
-4.0
-3.0
-2.0
Heat
flow
(mW)
200
100
0
Temperature (°C)
T
gof soft segments
-40 °C
T
mof hard segments
205 °C and 224 °C
T
gof hard segments
95 °C
zoomshows, as mentioned by the TPU manufacturer, a glass transition at the temperature TSSg of approximately ! 40 1C related to the soft segments. As described by Barikani and Hepburn [17] and Cuvé et al. [18], another glass transition associated to the hard segments appears at the temperature THSg of 9571 1C. According to the literature [16] and considering the DSC curve with the values of glass transition and melting temperature, the hard and soft segments content can respec-tively be estimated at about 85 wt% and 15 wt%.
Complementary tests by dynamic mechanical thermal analysis (DMTA) using a Rheometric Scientific ARES rheometer were carried out. As expected, the DMTA curves reflect the effect of glass transi-tions on the TPU mechanical properties (Fig. 4). Indeed, a transition of conservative modulus G0
, loss modulus G″ and tan
δ
is observed passing the temperatures TSSg or THSg . As for the DSC curve, at the glass transition THSg , the moduli G0and G″ display little variations relatively
to those around the glass transition TSS
g. This indicates that the
proportion of hard segments is low and that the TPU material is mainly formed by soft segments. Naturally, passing the first melting temperature, the mechanical properties of the TPU are strongly affected as displayed by the dropping of G0
and G″ modulus.
3. Experimental device
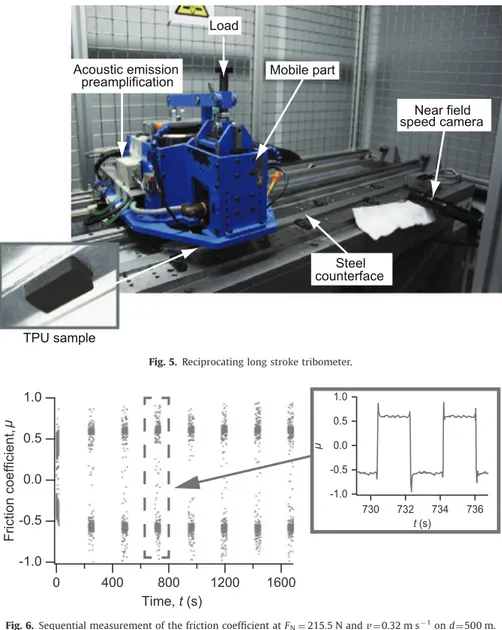
3.1. Reciprocating long stroke tribometer
A long stoke tribometer was used to ensure the contact in reciprocating motion between a rectangular sample of TPU (25 mm $ 15 mm $ 10 mm) and a steel countermaterial (2000 mm $ 37 mm $ 9 mm) in a flat-on-flat configuration (Fig. 5).
The vertical load is applied with a inductive actuator associated with a cantilever. The normal force FN and the tangential force FT measurements are performed by a triaxial load cell. Several heating elements and thermocouples are located under the steel counter-material to control the temperature homogeneity during experiments conducted from room temperature (air-conditioned at 21 1C) up to 100 1C. In addition, a surface thermocouple probe was also used to control the steel counterpart temperature before each experiment. Eventually, pressurized air nozzles overhang the contact in order to remove debris from the contact with a maximum flow of 70 L min! 1 . For this study, a near field speed camera was used to visualize any contact change during experiments (e.g. debris formation or ejection) with a frame rate of 120 FPS. Emission acoustic acquisi-tions were also performed to consider mechanical events occur-ring in the sliding contact. The acoustic emission sensor was fixed on the mobile part near the contact. This sensor (referenced
Micro-80) is a large band type from Euro Physical Acoustic operating at its maximum sensitivity between 100 kHz and 1 MHz. Before each experiment, the coupling between the sensor and the tribometer mobile part was controlled by the Hsu–Nielsen source method described by the standard NF EN 1330-9.
3.2. Experimental procedure
Three experimental campaigns were carried out to study the effects of load, velocity, travel distance and temperature on the tribological behavior of TPU material against steel.
The first campaign considers the effect of load at room temperature (21 1C) with a sliding speed v of 0.32 m s! 1
over a traveled distance L of 500 m (i.e. 1000 strokes of 0.5 m). Five constant normal loads were chosen at 166, 215, 248, 330 and 401 N. This range of loads corresponds to industrial applications with mean contact pressures ranged from 0.44 to 1.07 MPa.
The second campaign concerns the effect of velocity and travel distance with a constant load of 330 N at room temperature. An additional velocity of 0.5 m s! 1 was tested on a traveled distance of 500 m. A longer travel distance of 1900 m was also tested with the nominal sliding speed of 0.32 m s! 1
.
Finally, the third campaign of experiments was focused on the effect of temperature at a constant normal load of 330 N, at a velocity of 0.32 m s! 1
and on a traveled distance of 500 m. Different steel counterpart temperatures of 37, 50, 60 and 75 1C were selected. Before each experiment, the contact was maintained at the selected temperature during 10 min to obtain a steady state in the TPU. These experiments were performed twice at each temperature.
3.3. Signal treatments
The friction coefficient
μ
was recorded during 40 s every 210 s (Fig. 6). During one way stroke, corresponding to a half period, friction coefficient can reach absolute values higher than 1 at the beginning and at the end, associated to sample acceleration and deceleration respectively.The evolution of friction coefficient during experiments is averaged by a fitting curve of the oscillating absolute values of
μ
(Fig. 7a). The mean value and the scatter extend of the
μ
population is characterized by a box and whiskers chart (Fig. 7b). Box and whiskers plots are an interesting way to distinguish the static and dynamic values of the friction coeffi-cient. As most of the acquired points correspond to the sliding state under constant velocity, the Q3third quartile (i.e. 50% of
μ
series) gives a good average of the dynamic friction coefficient. The Q2 and Q3 quartiles (i.e. 25% and 75% ofμ
populations) give theG’ (Pa)G’’ (Pa) ta n δ Tg of soft segments -40 °C G’ G’’ tan δ -80 -40 0 40 107 108 109 1010 10-1 100 Temperature (°C) 0 50 100 150 200 250 106 107 108 109 10-1 100 Tg of hard segments 95 °C G’ (Pa)G’’ (Pa) ta n δ G’ G’’ tan δ Temperature (°C)
discrepancy of the dynamic friction coefficient. Because of the alternative crossing of the zero value by the friction coefficient, the Q1 quartile was set to 0%. Finally, the Q5quartile (i.e. 95% of the
overall population) gives an extreme value which is more like the static friction coefficient and the friction occurring at the end of the strokes upon reversals.
Near field
speed camera
Mobile part
Steel
counterface
Load
Acoustic emission
preamplification
TPU sample
Fig. 5. Reciprocating long stroke tribometer.
-1.0
-0.5
0.0
0.5
1.0
Friction
coefficient,
µ
1600
1200
800
400
0
Time, t (s)
-1.0 -0.5 0.0 0.5 1.0 µ 736 734 732 730 t (s)Fig. 6. Sequential measurement of the friction coefficient at FN¼ 215:5 N and v ¼0.32 m s
! 1on d¼ 500 m.
1.0
0.8
0.6
0.4
0.2
0.0
µ
1600
1200
800
400
0
t (s)
mean curve
µ
Q
5= 95 %
Q
1= 0 %
Q
2= 25 %
Q
3= 50 %
Q
4= 75 %
Test 1
0.4
0.6
After each experiment, wear measurements were carried out by weight loss of TPU to calculate the final wear volumes.
Emission acoustic signals were sampled considering the para-meters defined in Table 2. The acronym PDT defines the peak definition time, HDT is the hit definition time and HLT is the hit lockout time. The absolute acoustic energy Ea was extracted by
integrating the signal s(t) over the sampling period T considering the reference resistance of the acquisition device Re(Eq.(1)). This
parameter was then used to follow any significant changes in the sliding contact behavior and thus to complete the mechanical information given by the friction coefficient.
Ea¼ 1 Re Z T s2ðtÞ dt ð1Þ
3.4. Contact temperature calculus
The steel counterpart temperature does not represent the temperature of the sliding contact. However, the assessment of the true contact temperature is necessary to understand the
contact behavior in relation to TPU thermomechanical properties. Therefore, numerical simulation was performed to determine the distribution of the maximum temperatures around the TPU/steel contact. This simulation was carried out with the software Abaqus considering a steady-state regime with a static calculation and a quadratic mesh of 0.5 mm step size. Three dimensional numerical computations of the heat equation were performed with the software using the thermal conductivities of TPU and steel respectively set at 0.2 and 40 W m! 1K! 1. The density of steel was set at 7.8 g cm! 3.
As expected, the results show distributed values through the materials around a maximum temperature reached in the contact (Fig. 8a). As the numerical analysis is linear, the calculated mean temperature of contact Tc increases linearly with the set steel counterpart temperature T0(Fig. 8b). It is interesting to note that, for the two experiments performed with a counterpart tempera-ture of 60 and 75 1C, the expected contact temperatempera-ture Tc (respectively 93710 1C and 109710 1C) approaches or is higher than the glass transition THSg or pass this temperature of 95 71 1C.
4. Thermomechanical and wear results
4.1. Effect of load
Average fitting curves of friction coefficients show two stages (Fig. 9a). A first transitory stage, lasting approximately 300 s, is characterized by a nonlinear friction coefficient rise. Then, a steady linear stage begins with a mean rate for all these load experiments Table 2
Acquisition parameters of acoustic emission signals. Threshold (dB) Preamplification (dB) Sample rate (kHz) Pre-trigger (μs) PDT (μs) HDT (μs) HLT (μs) 35 40 1000 256 200 800 1000 TPU sample Steel ramp Homogeneous heating at 37 °C Contact T (°C) 30 40 50 60 70 80 120 100 80 60 40 80 70 60 50 40 30 20 TgHS Tc (°C) Contact temperature, T0 (°C) Counterpart temperature,
Fig. 8. Numerical simulation of the distributed temperature in the TPU/steel contact: (a) temperature distribution for a homogeneous heating under the steel counterpart at 37 1C; (b) mean temperatures of contact Tcvs. the temperature of heating T0.
0.8
0.7
0.6
0.5
0.4
0.3
µ
1600
1200
800
400
0
t (s)
7.0 6.5 6.0 5.5 5.0E
a(x10
5aJ)
µ
E
a300
250
200
150
100
400
350
300
250
200
F
N(N)
Normal load,
F
T(N)
T
a
n
g
e
n
ti
a
l
fo
rc
e
,
of 1:5 70:3 $ 10
! 5s! 1 (coefficient of determination R2 over 99.9%). In other words, an experiment of 1000 s (i.e. L ¼320 m) after the transient states implies that the friction coefficient should increase about 0.015. These statements show that there is a constant evolution in the contact TPU/steel and that a quasi-steady state is reached during the experiments. Regarding to his experiments with rubbers, Schallamach[7]indicated that friction increases with load according to a power law with an exponent of two third. Here, friction of the TPU/steel contact pair follows the proportional Amontons–Coulomb's law with a mean friction coefficient of 0.6270.01 (Fig. 9b).
Moreover, it is interesting to note that the discrepancy of friction coefficient increases with load. This can be attributed to deceleration and acceleration changes during experiments and the required force to reverse the sliding direction (static coefficient of friction). Adhesive forces in such circumstances are higher than the tangential force measured during the constant speed sliding contact and increase with load. For the highest loads, these stick-slip phenomena are initiated during accelerations and decelera-tions (command ramp of 5 m s! 2) as it can be seen by the periodic forms of the friction coefficient (Fig. 10). Actually, as a consequence of the low modulus of rubber-like materials, velocity changes can greatly affect their triborheological behavior[19]and then cause contact instabilities. Subsidiarily, the stick-slip effect on tangential force is clearly asymmetric and is more intense in one direction of stroke than in the other.
Concerning acoustic emission, as the friction coefficient, the absolute energy Ea evolves with a transitory stage followed by a
constant or a slightly increasing regime (Fig. 11a). Conventionally, increasing load is a factor of amplifying acoustic waves in sliding contacts [20]. However, Ea increases with load until 248 N and
decreases after this value (Fig. 11b). This seems to be related to the mechanism of stick-slip occurring at the highest loads. This suggests that the more pronounced is the stick-slip phenomenon, the lower is the energy of acoustic waves produced by the contact.
4.2. Effect of velocity
Several authors showed that the friction force of rubbers on steel increases with velocity[19]. In our experiments, the change of velocity from 0.32 m s! 1 to 0.5 m s! 1, for a sliding time of 1000 s, leads to an increase of the friction coefficient from 0.587 0.02 to 0.61 7 0.02 (i.e. þ5%). More precisely, the linear rate of
μ
is clearly higher for the highest speed with a value of 5:9 $ 10! 5s! 1(R2of 99.9%) (Fig. 12). This value represents more than three times the rate observed with the velocity of 0.32 m s! 1. As observed by Grosch[21]for rubbers, the stick-slip mechan-ism is amplified by an increase in velocity. Therefore, the instabil-ities of friction coefficient previously observed at high loads also appear for 0.5 m s! 1
with a greater amplitude than for 0.32 m s! 1 . Intuitively, higher velocities should produce higher energetic acoustic waves from the sliding contact [20]. Our experiments showed the opposite effect: increasing velocity from 0.32 m s! 1
to 0.5 m s! 1leads to a drop of absolute energy E
a(Fig. 13). As above,
this observation can also be the result of stick-slip mechanism amplified at higher velocity. Again, the apparition of the stick slip phenomena is related to the drop of acoustic emission energy.
4.3. Effect of temperature
Changes of steel counterpart temperature T0, especially between 21 and 37 1C, clearly modify the sliding contact behavior (Fig. 14). The friction coefficient increases from 0.6170.001 at 21 1C to 0.7770.002 after 37 1C representing a rise of 26%. Considering the numerical simulation, at a set T0 of 37 1C, Tc reaches 70 1C and the contact temperature can locally pass over 80 1C. Therefore, as mechanical properties of TPU are greatly affected around 95 715 1C (Fig. 4), softening of the polymer (rubber-like state) after the glass transition THS
g could explain such
a change of friction coefficient.
More specifically, the friction coefficient signal becomes clearly unstable for temperatures T0of 37 and 50 1C (i.e. Tcof 707 10 and 80710 1C) (Fig. 15). On the contrary, the friction coefficient for temperatures T0460 1C (i.e. Tc493 710 1C) displays a smooth -1.0 -0.5 0.0 0.5 1.5 µ 307 305 t (s) Stick-slip 166 N 248 N 401 N
Fig. 10. Stick-slip phenomena effect on friction coefficient signals at 166, 248 and 401 N during one period.
7.0x10
56.5
6.0
5.5
5.0
1500
1000
500
0
Time,
t
(s)
248 N
330 N
E
a(aJ)
A
b
s
o
lu
te
e
n
e
rg
y,
6.4x10
56.2
6.0
5.8
E
a(aJ)
400
350
300
250
200
F
N(N)
Fig. 11. Effect of load on absolute acoustic energy for a sliding distance of 500 m and a velocity of 0.32 m s! 1: (a) absolute acoustic energy vs. time at the constant normal
signal without any perturbation. Repeatability tests for temperatures T0of 37 and 50 1C confirm these results. A dynamic thermal effect induced by strokes and dissipation by convection around the contact can initiate this behavior. Indeed, the Péclet number here is higher than 104
and shows that the low conductivity and high specific heat of TPU (approximately 2000 J kg! 1K! 1) lead to a high convection flow with regard to the conductive flow in the contact. In this way, the heating and cooling flows in the vicinity of the contact zone during accelerations and decelerations at T0 of 37 and 50 1C can induce alternate crossing through the glass transition THSg .
Acoustic emission measurements also display instabilities occur-ring at T0of 50 1C (Fig. 16). The temperature is an attenuation factor for acoustic emission signal amplitude in sliding contacts[20]. The absolute energy Eaclearly drops when temperature increases in the
contact zone.
5. Wear results
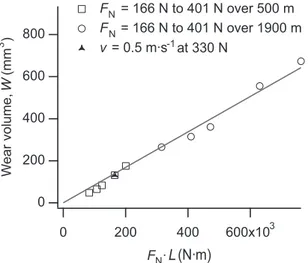
5.1. Wear kinetic
Archard's model considers the proportionality between the wear volume W and the product of normal load FNby the sliding distance L. Obviously, the wear of TPU follows this model at room temperature (Fig. 17). The wear rate reaches 8:47 0:2 $ 10
! 4mm3N! 1m! 1.
Changing the sliding velocity does not change the linearity between W and FN( L. Indeed, the experiment performed at 0.5 m s! 1and 330 N
over 500 m (i.e. FN( L ¼ 1:65 $ 10
5N m) realizes the same wear
0.7 0.6 0.5 0.4 0.3 0.2 1600 1200 800 400 0 t (s) 0.50 m/s 0.32 m/s
Fig. 12. Effect of velocity on friction coefficient for a load of 330 N over a sliding distance of 500 m.
7.0x10
56.0
5.0
4.0
E
a(aJ)
1600
1200
800
400
0
t (s)
0.32 m/s
0.50 m/s
Fig. 13. Effect of velocity on absolute energy Eafor a load of 330 N over a sliding
distance of 500 m.
1.2
1.0
0.8
0.6
µ
21
37
37
50
50
60
60
75
75
T
0(°C)
T
c(°C)
54
70
70
80
80
93
93 109 109
Fig. 14. Effect of steel counterpart temperature on friction coefficient at 330 N and 0.32 m s! 1for a total sliding distance of 500 m with repeatability tests.
1.0
0.0
-1.0
µ
302
300
t
(s)
37 °C
60 °C
Fig. 15. Temperature effect on the friction coefficient signal during one period at T0
of 37 and 60 1C.
7.0x10
56.5
6.0
5.5
5.0
4.5
4.0
E
(a
J
)
a1500
1000
500
0
t
(s)
21 °C
50 °C
50 °C
Fig. 16. Effect of temperature on absolute acoustic energy: absolute acoustic energy vs. time.
volume as the experiment at 0.32 m s! 1and 330 N over 500 m (i.e. also FN( L ¼ 1:65 $ 10
5N m).
Concerning experiments conducted at temperatures up to 50 1C (i.e. Tc¼ 80 7 10 1C), as previously noticed, mechanical instabilities
appear leading to significant increases of the worn volumes. In contrast, beyond a steel counterpart temperature of 60 1C (i.e. Tc¼ 93 7 10 1C), a clear drop in wear behavior is promoted by the
softening of the TPU above the glass transition THSg ¼ 95 7 1 1C (Fig. 18).
5.2. Observation of worn surfaces
All TPU worn surfaces display macroscopic longitudinal scratches as a result of an abrasion mechanism (Fig. 19). Agglom-erated debris are formed and stabilized on one side of the contact. The other side shows an unworn surface due to a conformity process coming from a slightly tilted contact edge. These observa-tions are clearly related to asymmetric signals of friction coeffi-cient and stick-slip phenomena discussed above. Ejected powdery
particles are also observed on the lateral side of worn TPU samples.
SEM observations reveal Schallamach's ridge patterns on TPU (Fig. 20). As described by Schallamach, mean ridge spacing Sr clearly increases with load. Moreover ridges are more blunted when the ramp temperature increases.
The mean ridge spacing Sr was measured with an optical profilometer using Fourier's analyses of ridges distribution on an area of 1.8 mm $ 2.4 mm in the middle of the worn surface. As expected from Schallamach's observations, the mean ridge spacing Sr evolves following the cube root of the normal load (coefficient of determination R2of 99.7%) (Fig. 21).
The increase of the ramp temperature T0does not lead to a defined tendency for the mean ridge spacing and has no significant influence on it (Sr¼ 38 7 3
μ
m from T0of 21 1C to 75 1C). The increase of the total sliding distance from 500 m to 1900 m does not affect ridges morphology. This observation indicates that the mechanism of forma-tion and the dynamic of ridges are stabilized after a rather short sliding distance. Indeed, Fukahori et al.[22]described that the ridges pattern is formed in an initial stage of wear then the ridges grow in spacing and height and reach a final geometrical shape at the steady state of sliding friction. Concerning the effect of velocity, the change of vfrom 0.32 m s! 1to 0.5 m s! 1at the fixed load of 330 N implied a drop of 23% for Srfrom 39 7 2μ
m to 30 7 1μ
m. Schallamach[7]already observed that ridges patterns develop more easily at higher rates of sliding without explaining this effect. Later, Fukahori and Yamazaki[23]found that the steady state of rubbers wear depends on the stick-slip motions during friction. They proposed relations between the pattern spacing Srwith the mean sliding velocity but also with the period of stick-slip oscillations in the established sliding regime.
800
600
400
200
0
600x10
3400
200
0
F ·
NL (N·m)
W
(mm
3)
W
e
a
r
v
o
lu
m
e
,
F
N= 166 N to 401 N over 500 m
F
N= 166 N to 401 N over 1900 m
v = 0.5 m·s
-1at 330 N
Fig. 17. Wear volume vs. the product of normal load by sliding distance (Archard's model) at room temperature.
160
120
80
40
W
(
m
m
3)
80
70
60
50
40
30
20
T
0(°C)
T
c(°C)
100
90
80
70
60
Fig. 18. Wear volume vs. steel counterpart temperature at 330 N and 0.32 m s! 1
over 500 m. Agglomerated debris Powdery Particles Longitudinal scratches Unworn side
Fig. 19. Photography of a typical TPU worn surface.
Finally, the height of the ridges collapses after 330 N (Fig. 22a) tending toward a flatter surface as Sr decreases. As previously observed, the ridges are more blunted at higher temperature so that grooves become deeper than the tops formed by the ridges (Fig. 22b). In other words, skewness of the height distribution is negative after a temperature T0of 60 1C.
The transverse mean profiles of worn TPU reveal that when the load increases the depth of associated longitudinal scratches also increases (Fig. 23a). This result is coherent with Archard's model which specifies a linear evolution of the wear volume with FNL.
Concerning the effect of contact temperature, the mechanical disturbances occurring at T0¼ 37 1C result in a less ordered relief
formed by deep and less localized scratches (Fig. 23b). At highest temperature T0of 60 1C and 75 1C, the transverse profiles display more localized scratches. These scratches are deeper at 75 1C than at 60 1C due to a more effective abrasive mechanism at higher temperature. This indicates that before these critical temperatures (i.e. before THSg ), the wear of TPU tightly depends on adhesion. Above THSg , abrasive wear takes a more prominent contribution in the wear mechanism.
5.3. Debris formation
The video sequences recorded during experiments at room temperature show that when the applied load increases the debris formation decreases (Fig. 24). At the highest load of 401 N, only some small particles are visible on the video sequences. No debris are visible on video sequences with a heated steel counterpart.
Some SEM observations of the debris display an agglomeration of rolls (Fig. 25) and finer particles. This cohesive agglomerate is produced by the combination of detached ridges (i.e. rolls) and abrasion of the TPU surface.
The formation of rolls has already been studied by several authors. For example, Reznikovskii and Brodskii[24]described a plastic strain of contact asperities of rubbers and a winding of deformed asperities. This model can be detailed in four stages:
1. an elastic strain of asperities;
2. a plastic strain crossing the yield stress of the TPU; 3. the winding of asperities forming ridges;
4. the fracture of the deformed asperities leading to the wear roll formation.
These stages, as described in wear studies of rubbers, can be associated to a mechanism of fatigue relevant to a wear rolls formation after several strokes as described by Uchiyama and Ishino[25].
6. Discussion
6.1. Contact interactions
In first approximation, the contact between TPU and steel can be schematized by the association of flat adhesive contacts and abrasive asperities (Fig. 26). As abrasive asperities of steel are little modified during experiments, the contact rapidly accommodates forming scratches on TPU during a running-in period followed by a steady state dominated by periods of adhesion wear alternating with periods of abrasive wear. In this way, the increasing of load causes the deepening of scratches (i.e. greater
δ
) and the widening of adhesive contacts (i.e. greater a) which is consistent with the friction coefficient rise with load.The experiments conducted at higher temperatures also follow these observations. Increasing temperature leads to deeper long-itudinal scratches and larger adhesive contacts by a greater conformation of TPU with steel. Accordingly, the observed friction coefficient is higher when the contact is heated.
6.2. Third body approach
The third body consideration can bring more clarity in the comprehension of the contact mechanisms [26]. This approach highlights the formation, the circulation and the removal of particles at the interface of the two sliding bodies. The tribological circuit is then associated to the mechanical phenomena permitting
45
40
35
30
25
400
350
300
250
200
F
N(N)
S
r= 11.5F
N- 40.7
1/3S
r(µm)
M
e
a
n
r
id
g
e
s
p
a
c
in
g
,
Fig. 21. Effect of load on mean ridge spacing.
100
80
60
40
20
0
P
o
p
u
la
ti
o
n
(
%
)
-4
-2
0
2
4
Height distribution (µm)
400
350
300
250
200
F
N(N)
100
80
60
40
20
0
P
o
p
u
la
ti
o
n
(
%
)
4
0
-4
Height distribution (µm)
70
60
50
40
30
20
T
0(°C)
the accommodation sustained by the contact [27]. The relative velocity between the two contacting solids is accommodated through the worn particles circulating at the interface which give rise to a velocity gradient (such as a liquid in a lubricated inter-face). The velocity accommodations can be localized at different sites and realized according to different modes.
Here, the generation of the third body into the contact zone depends on detached particles essentially coming from the TPU (Fig. 27). This supplies the source flow Qsof particles that are detached by abrasive shear stresses forming the scratches and by adhesive shear stresses from the ridges (S1M3by referring to the site S1for TPU and to the mode M3 for a shearing mode). This flow accounts for the
properties of the TPU since the plastic strains occurring in the TPU can avoid particles detachments (mechanism S1M1by referring to the site
of accommodation S1relevant to the TPU and to the mode M1for an
elastic response) and limits Qs. At the highest temperature, the TPU rubber-like state near the contact surface can also tightly limit Qs. These mechanisms are related to the triborheological conclusion of deformation losses during friction of rubbers reported by Greenwood and Tabor[28]. The friction of a relatively soft material against a rigid counterface involves both dissipated energy spent at the interface of the sliding contact and dissipated energy due to shallow deformation of the soft material.
Afterward, the interface TPU/steel, fed by the source flow Qs, generates the third body internal flow Qi. This flow is formed by abraded fine particles of TPU and rolls detached from ridges. The shearing of the third body (S3M3) and the roll formation at the
interface (S3M4) can also impute to the increase of friction
coeffi-cient observed during load changes and heated experiments. Increasing load leads also to increase space between ridges and thus to decrease the number of ridges on the worn surface, so that the amount of detached rolls is reduced and the accommodation of shearing stresses by rolls at the interface is reduced. For the highest temperature, Qi is also reduced as a result of the Qs reduction. Consequently, the shearing of the third body is mainly replaced by higher friction forces involved by a more direct contact of TPU against steel. A part of wear debris stays on the surface of the steel counterface and is recycled into the contact to form the flow of recirculation Qrand therefore contributes to the internal flow Qi.
The wear flow Qwcorresponds to the amount of matter definitively lost by the contact and represents the assessment of the wear undergoes by the contacting bodies. This wear flow directly depends on Qiand indirectly on Qs. As it was observed on video sequences, higher the load is, the fewer the observable debris (i.e. agglomerated rolls on the front of the contact) are. This is coherent with the previous comments indicating that less rolls are introducing into the interface. Considering test conducted at higher temperature, no debris are clearly observed, even for the test at T0of 50 1C where the highest wear volume was displayed. This shows that even if the wear rate of the TPU generates a high source flow, ejection of debris (i.e. a high Qw) tends to limit the amount of third body and to increase the friction coefficient. A low wear flow Qwmay be caused by the trapping of debris at the interface because of rough ridges. Thus, the blunted ridges observed after heated tests could explain a better ejection of debris.
H
e
ig
h
t
(µ
m
)
Tranverse position (mm)
H
e
ig
h
t
(µ
m
)
Steel ramp
TPU
401 N
248 N
166 N
Sharp asperity
Scratch
30
0
10
20
0
15
-15
0
3
-3
Tranverse position (mm)
Steel ramp
TPU
75 °C
60 °C
37 °C
30
0
10
20
0
15
-15
0
3
-3
H
e
ig
h
t
(µ
m
)
H
e
ig
h
t
(µ
m
)
Fig. 23. Transverse mean profiles of worn TPU samples surfaces (transverse slice of 1.8 mm $ 15 mm) and the steel counterpart surface (transverse slice of 2.4 mm $ 35 mm): (a) effect of load at room temperature; (b) effect of temperature at 330 N.
Debris
TPU sample
Counterpart
F
N= 248 N
F
N= 330 N
F
N= 401 N
Fig. 24. Side view of the TPU/steel contact during experiments at constant loads at 0.32 m s! 1on 500 m.
This approach is consistent with a simultaneous drop of wear and rise in friction coefficient at higher temperature. The reduc-tion of the source flow Qs, as a result of the rubber-like state of TPU, and of the internal flow Qi, due to an easier ejection of debris favors by rough and more space ridges, induces both low amounts of ejected debris (low wear) and higher interactions between TPU and steel surfaces (high friction).
7. Conclusion
Friction and wear tests were performed on thermoplastic polyurethane TPU sliding against a steel bar using a long stroke tribometer under reciprocating movement and in dry friction over different loads, velocities and temperatures. Before these tribolo-gical experiments, chemical and thermomechanical characteriza-tions indicated that TPU shows a semicrystalline structure and, in particular, a glass transition temperature at 95 71 1C associated to the hard crystalline segments (urethane blocks).
First of all, four points concerning mechanical results confirm observations of previous studies and highlight new conclusions:
)
The friction of TPU/steel contact follows the Amontons–Coulomb law.
)
The wear kinetic of TPU follows Archard's law at room temp-erature.)
The triborheological behavior of TPU provokes stick-slip phe-nomena initiated by critical values of load and velocity. Stick-slip phenomena are characterized by peaks of friction coeffi-cient and drops of acoustic emission energy.)
The increase of contact temperature causes an increase of mean friction coefficient. Significant disturbance on friction coeffi-cient signals is resulting from alternative crossing of the glass transition temperature. When the contact temperature passes the glass transition, smooth friction coefficient signals and a drop of TPU wear volume are observed.Next, analyses of worn surfaces and debris formation showed that:
)
The wear mechanisms are combining abrasive wear by the formation of longitudinal scratches and adhesive wear by rolls formation detached from Schallamach's ridge pattern.)
As described by Schallamach, the space between ridges follows a power law of load, decreases with sliding velocity and the ridges morphology stabilizes after a transient period.Rolls
Agglomerated
rolls
Fig. 25. Side debris formation: SEM images of fibrous side debris and rolls formed from ridges.
a
δ
Abrasive asperities
Adhesive contacts
TPU
Steel
Fig. 26. Drawing of the association of abrasive asperities and adhesive surfaces in the TPU/steel contact.
TPU
Steel
Q
sQ
iQ
wQ
rS
1M
1& S
1M
3S
3M
3& S
3M
4Fig. 27. Tribological circuit with flows Qs, Qi, Qwand Qr(respectively source flow,
internal flow, wear flow and recycling flow) associated to mechanisms of speed accommodation S1M1, S1M3, S3M3and S3M4(where S1and S3are referring to the
TPU surface and the detached particles and M1, M3 and M4 are referring
)
Before the glass transition, adhesion mechanisms mainly gov-ern the contact interactions and in the rubber-like state the abrasive component takes a more preponderant influence towards adhesion.A third body approach was used to describe wear mechanisms by the protection or the aggression of the TPU surface taking into account circulation, trapping and ejection of wear debris through the analysis of the source, internal and wear flows. Such approach account for a tribological behavior where a rise in friction coefficient can lead to a drop of wear, as observed for TPU/steel contact at higher temperatures.
Acknowledgments
This study was a Franco-Spanish cooperation performed by the Interreg IVA RICAT þ and supported by FEDER funds. Special thanks are due to M. Boutoleau, V. Nassiet, L. Poussines and J. Tarrieu for their contributions in material characterizations and their helpful comments and suggestions.
References
[1]W. Meckel, W. Goyert, W. Wieder, H.G. Wussow, Thermoplastic polyurethane elastomers, in: Thermoplastic Elastomers, Carl Hanser Verlag, Munich, Germany, 2004, pp. 15–39.
[2]N.K. Myshkin, M.I. Petrokovets, A.V. Kovalev, Tribology of polymers: adhesion, friction, wear, and mass-transfer, Tribol. Int. 38 (2005) 910–921.
[3]M. Abkarian, S. Hassanzadeh, M. Moghri, Short Twaron aramid fiber reinforced thermoplastic polyurethane, Polym. Adv. Technol. 19 (2008) 1894–1900. [4]O. Kaltzakorta, R. Wäsche, M. Hartelt, Influence of polymer filler on
tribolo-gical properties of thermoplastic polyurethane under oscillating sliding con-ditions against cast iron, Tribol. Lett. 48 (2012) 209–216.
[5]A. Schallamach, Abrasion pattern on rubber, Rubber Chem. Technol. 26 (1953) 230–241.
[6] G. Petitet, M. Barquins, Résistance à l'usure, in: Matériaux caoutchouteux, Presses polytechniques et universitaires romandes, 2008, pp. 335–342, ISBN: 978-2-88074-744-2.
[7]A. Schallamach, On the abrasion of rubber, Proc. Phys. Soc. B 67 (1954) 883–891.
[8]A.K. Bhowmick, Ridge formation during the abrasion of elastomers, Rubber Chem. Technol. 55 (1982) 1055–1062.
[9]E. Southern, A.G. Thomas, Studies of rubber abrasion, Plast. Rubber Mater. Appl. 3 (1978) 133–138.
[10]T. Iwai, Y. Uchiyama, K. Shimosaka, K. Takase, Study on the formation of periodic ridges on the rubber surface by friction and wear monitoring, Wear 259 (2005) 669–675.
[11] R. Beck, R. Truss, Effect of chemical structure on the wear behaviour of polyurethane-urea elastomers, Wear 218 (2) (1998) 145–152.
[12]F.J. Martínez, M. Canales, S. Izquierdo, M.A. Jiménez, M.A. Martínez, Finite element implementation and validation of wear modelling in sliding polymer-metal contacts, Wear 284–285 (2012) 52–64.
[13]R.C. Lima da Silva, C. Henrique da Silva, J.T.N. Medeiros, Is there delamination wear in polyurethane? Wear 263 (2007) 974–983.
[14]F.J. Martínez, M. Canales, J.M. Bielsa, M.A. Jiménez, Relationship between wear rate and mechanical fatigue in sliding TPU-metal contacts, Wear 268 (2010) 388–398.
[15]K.-S. Chen, T. Leon Yu, Y.-S. Chen, T.-L. Lin, W.-J. Liu, Soft-and hard-segment phase segregation of polyester-based polyurethane, J. Polym. Res. 8 (2001) 99–109.
[16]A. Saiani, W.A. Daunch, H. Verbeke, J.-W. Leenslag, J.S. Higgins, Origin of multiple melting endotherms in a high hard block content polyurethane. 1. Thermodynamic investigation, Macromolecules 34 (2001) 9059–9068. [17] M. Barikani, C. Hepburn, Isocyanurate crosslinking as a mean of producing
thermally stable polyurethane elastomers, Cell. Polym. 6 (1987) 41–54. [18]L. Cuvé, J.P. Pascault, G. Seytre, G. Boiteux, Synthesis and properties of
polyurethanes based on polyolefine: 1. Rigid polyurethanes and amorphous segmented polyurethanes prepared in polar solvents under homogeneous conditions, Polymer 32 (1991) 343–352.
[19]S. Sills, K. Vorvolakos, M.K. Chaudhury, R.M. Overney, Molecular origins of elastomeric friction, in: Nanotribology: Friction and Wear on the Atomic Scale, Springer Verlag, Heidelberg, Germany, 2007, pp. 659–676.
[20] V. Baranov, E. Kudryavtsev, G. Sarycgev, V. Schavelin, Friction of solids and nature of acoustic emission, in: Acoustic emission in friction, Elsevier, Moscow, Russia, 2007, pp. 10–15, ISBN: 978-0080451503.
[21]K.A. Grosch, The relation between the friction and visco-elastic properties of rubber, Proc. R. Soc. A 274 (1963) 21–39.
[22] Y. Fukahori, H. Liang, J. Busfield, Criteria for crack initiation during rubber abrasion, Wear 265 (2008) 387–395.
[23] Y. Fukahori, H. Yamazaki, Mechanism of rubber abrasion. Part I: abrasion pattern formation in natural rubber vulcanizate, Wear 171 (1994) 195–202. [24] M.M. Reznikovskii, G.I. Brodskii, Abrasion of rubber during friction against
relatively smooth surfaces, in: Abrasion of Rubber, Maclaren Palmerton, Cambridge, USA, 1967, pp. 13–17.
[25] Y. Uchiyama, Y. Ishino, Pattern abrasion mechanism of rubber, Wear 158 (1992) 141–155.
[26] Y. Berthier, Maurice Godet's Third Body, Tribology Series, vol. 31, Elsevier, Lyon, France, 1996 21–30, ISBN: 978-0-444-82502-5.
[27] J. Denape, Y. Berthier, L. Vincent, Wear particle life in sliding contact under dry conditions: third body approach, in: Fundamentals of Tribology and Bridging the Gap Between the Macro- and Micro/Nanoscales, Kluwer Academic Pub-lishers, Netherlands, 2001, pp. 393–411.
[28] J.A. Greenwood, D. Tabor, The friction of hard sliders on lubricated rubber: the importance of deformation losses, Proc. Phys. Soc. 71 (1958) 989–1001.