HAL Id: hal-02282528
https://hal.archives-ouvertes.fr/hal-02282528
Submitted on 10 Sep 2019
HAL is a multi-disciplinary open access
archive for the deposit and dissemination of
sci-entific research documents, whether they are
pub-lished or not. The documents may come from
teaching and research institutions in France or
abroad, or from public or private research centers.
L’archive ouverte pluridisciplinaire HAL, est
destinée au dépôt et à la diffusion de documents
scientifiques de niveau recherche, publiés ou non,
émanant des établissements d’enseignement et de
recherche français ou étrangers, des laboratoires
publics ou privés.
Geometry and loading effects on performances of
mode-stirred reverberation chambers: an experimental
study
Ludivine Le Bars, Jean-François Rosnarho, Philippe Besnier, Jérôme Sol,
Francois Sarrazin, Elodie Richalot
To cite this version:
Ludivine Le Bars, Jean-François Rosnarho, Philippe Besnier, Jérôme Sol, Francois Sarrazin, et al..
Geometry and loading effects on performances of mode-stirred reverberation chambers: an
experi-mental study. 2018 International Symposium on Electromagnetic Compatibility - EMC EUROPE,
Sep 2019, Barcelona, Spain. �10.1109/EMCEurope.2019.8872134�. �hal-02282528�
Geometry and loading effects on performances of
mode-stirred reverberation chambers: an experimental
study
Ludivine Le Bars, Jean-FrançoisRosnarho Philippe Besnier, Jérôme Sol François Sarrazin, Elodie Richalot SIEPEL : Société Industrielle d’Etudes et
Protections Electroniques, Impasse de la Manille, F-56470
INSA Rennes, CNRS, IETR – UMR 6164, F-35000
Université Paris-Est, ESYCOM (FRE2028), CNAM, CNRS, ESIEE-Paris, Université
Paris-Est Marne-la-Vallée, F-77454
La Trinité-sur-Mer, France Rennes, France Marne-la-Vallée, France
Abstract—In this paper, we aim at highlighting the specific
roles of the geometry and loading in a mode-stirred reverberation chamber. A geometrical modification is achieved through the introduction of several metallic caps on the cavity walls, in order to fulfill chaoticity requirements. Loading modifications are achieved by putting absorbers on ground. Tests have been performed in three reverberation chambers of different dimensions, and thus, of different lowest usable frequencies. Respective and combined roles of both types of modification are analyzed and clarified.
Keywords—chaoticity, absorption, reverberation chamber
I. INTRODUCTION
Reverberation chambers (RCs) are now widely used as a measurement tool to perform either electromagnetic compatibility tests or antenna measurements [1] [2].
Standards define several parameters to study a reverberation chamber in order to check the proper functioning of the system. It is commonly assumed that the standard deviation of the maximum E-field within the working volume of RC and over a complete stirrer rotation must not exceed the standard limit while respecting a minimum number of uncorrelated stirrer positions in order to obtain compliant measurements. It is however difficult to reach this maximum E-field uniformity in accordance with the standards at low frequencies for a small RC. As this study aims at decreasing the lowest usable frequency (LUF) of RCs, our frequency range of interest is around and below the announced LUF.
Though the main goal of either EN 61000-4-21 [3] or RTCA DO-160G [4] standards is to check such defined maximum E-field uniformity, it gives a poor indication on the statistics (i.e. no indication about its first moments) of the E-field itself. To refine RC analysis additional criteria are necessary. In this paper we use:
1) the standard deviation to mean ratio of the E-field over a complete stirrer rotation and considering all the probe or antenna positions, and
2) the distribution of Pnini-Shapiro for chaotic cavity [5] [6].
We aim at understanding the impact of the aforesaid criteria by adding several caps in the enclosure to make an RC
chaotic, as well as the effect of loading it with absorbing materials.
Among many experiments performed in different RCs (ESYCOM, IETR, SIEPEL) we focus here on a limited set of significant results. First, experiments were carried out in the RC of ESYCOM laboratory comparing two configurations, an empty RC and an RC made chaotic thanks to the introduction of three metallic caps. Thus, this first measurement campaign aims at understanding the impact of the RC geometry. Second, a measurement campaign was achieved in another RC at SIEPEL company. It aimed at investigating the loading variation effect through adjustment to absorber types and quantities. A third campaign, not presented here, aimed at confirming the previous results in the RC of IETR laboratory. Then, we compare the chaotic and the loaded RCs at ESYCOM laboratory, in order to understand the impact of solely the RC geometry when keeping constant the quality factor of both cavities.
This communication is organized as follows. Section II describes the test environments. Section III deals with the effects of the geometry / chaoticity of the RC. Section IV is devoted to the demonstration of the impact of the load when placing an absorber in the RC. Section V compares an RC with a load and a chaotic one with similar quality factors. We then conclude in Section VI.
II. DESCRIPTION OF TEST ENVIRONMENTS
Three RCs were studied for this article. The first one is the enclosure of the ESYCOM laboratory (Fig. 1). Its dimensions are 2.95 x 2.75 x 2.35 𝑚3, and the three caps
placed on three orthogonal walls have a diameter of 1.586 𝑚 and high 0.28 𝑚. The LUF of the empty cavity (without caps), defined according to the standards, is estimated to be about 400 MHz.
SIEPEL RC dimensions are 2.48 x 2.48 x 2.86 𝑚3. The
three caps used for the chaotic configuration have a diameter of 1.80 𝑚 and high 30 𝑐𝑚. The estimated LUF is about 400 MHz as for the ESYCOM reverberation chamber.
The third RC studied is in the IETR laboratory. Its dimensions are 8.7 x 2.9 x 3.7 𝑚3. The three hemispheres
placed in the RC to make it chaotic have a diameter of 50 𝑐𝑚. The LUF is of 200 MHz.
III. EFFECT OF GEOMETRY
In this section we examine the contribution of the RC chaoticity by introducing 3 caps on the cavity walls at ESYCOM laboratory.
Measurements have been performed for 60 stirrer positions and 1 MHz frequency step by using a fixed transmitting monopole antenna and a moving receiving one to collect the data at eight positions in the RC in the 300 – 600 MHz frequency range. We compare the results between the empty RC and the chaotic one.
A. E-field Statistics
To understand the impact of the geometry modification of the RC, we first estimate the loading effect of the inserted caps by calculating the quality factor 𝑄 [7]:
𝑄 = < |𝑆11−< 𝑆11 >|2> 𝑍0𝜔𝜀𝑉
(𝜆24𝜋)(1−|<𝑆11>|2)2𝜂2 (1)
With 𝑆11 the reflection coefficient of the transmitting antenna, 𝑍0 the free space impedance, 𝑉 the cavity volume, 𝜂
the antenna efficiency.
From 𝑄 we can deduce the modal overlap 𝑑 [8]:
𝑑 =8𝜋𝑉𝑄 (𝑓𝑐)3 (2)
Finally, we estimate the standard deviation to mean ratio 𝜎𝜇 , namely the coefficient of variation (𝐶𝑉):
𝐶𝑉
̂
= √1
𝑛−1∑(𝐸𝛼𝑖−<𝐸𝛼>𝑛)2
<𝐸𝛼>𝑛 (3)
where < 𝐸𝛼 >𝑛 corresponds to the ensemble average of the
E-field component on a complete stirrer rotation and over all the antenna positions. For an ideal Rayleigh distribution of the E-field, the value of this ratio converges to 0.52.
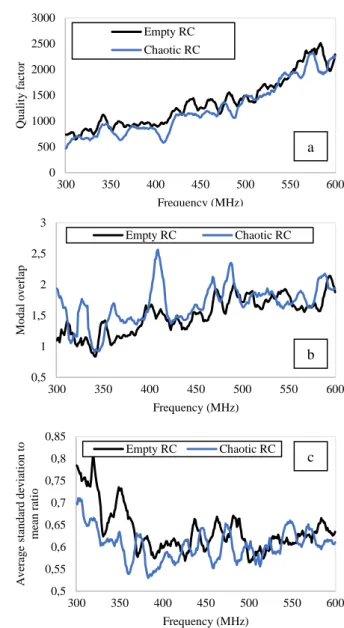
Fig. 2 shows the frequency variation of 𝑄 (Fig. 2a), 𝑑 (Fig. 2b) and 𝐶𝑉 (Fig. 2c) in the classical RC and the chaotic one. Due to strong frequency variations, all these results are averaged over a 10 MHz sliding window.
According to this figure, the quality factor is lower in the chaotic configuration than in the empty one which implies a higher modal overlap. Indeed, the quality factor related to Joule effect on the cavity walls is proportional to 𝑉/𝑆 where 𝑉 is the cavity volume and 𝑆 is the wall surfaces and the insertion of spherical caps decreases the cavity volume and increases its walls surface.
Considering the 𝐶𝑉 , the results for the chaotic configuration is lower than in the empty RC, especially in the lower frequency range. This is an indication that the E-field distribution is closer to a Rayleigh distribution when caps are present.
B. Study of Normative Parameters
In this part, we are interested in the impact of chaoticity according to two normative parameters, the number of uncorrelated stirrer positions [9] and the standard deviation of the maximum E-field as defined by the EN 61000-4-21 as follows:
𝜎𝛼 𝑑𝐵 = √
∑(𝐸𝑚𝑎𝑥𝑖,𝛼−<𝐸𝑚𝑎𝑥𝛼>𝑁𝑝𝑟𝑜𝑏𝑒)2
𝑁𝑝𝑟𝑜𝑏𝑒−1 (4)
with 𝐸𝑚𝑎𝑥 the maximum field amplitude over a stirrer rotation, 𝛼 = 𝑥, 𝑦, 𝑧 and 𝑖 = 𝑝𝑜𝑠𝑖𝑡𝑖𝑜𝑛 𝑜𝑓 𝑡ℎ𝑒 𝑎𝑛𝑡𝑒𝑛𝑛𝑎.
Fig. 3 shows the frequency variation of the standard deviation of maximum E-field vertical component and the number of uncorrelated stirrer positions. Though these curves are affected by statistical fluctuations, it appears that the standard deviation of the maximum E-field exhibits, on
0 500 1000 1500 2000 2500 3000 300 350 400 450 500 550 600 Q u al it y f ac to r Frequency (MHz) Empty RC Chaotic RC 0,5 1 1,5 2 2,5 3 300 350 400 450 500 550 600 M o d al o v er la p Frequency (MHz) Empty RC Chaotic RC 0,5 0,55 0,6 0,65 0,7 0,75 0,8 0,85 300 350 400 450 500 550 600 A v er ag e st an d ar d d ev ia ti o n t o me an r at io Frequency (MHz) Empty RC Chaotic RC
Fig.2. ESYCOM RC. (a) Quality factor. (b) Modal overlap. (c) Coefficient of variation. Results averaged over a 10 MHz sliding window.
a
b
c
Fig.1. ESYCOM RC – Chaotic configuration (2.95 x 2.75 x 2.35 𝑚3) –
average, a better performance in the chaotic configuration in the considered 300 to 600 MHz frequency range. Results for the number of uncorrelated stirrer positions seems to be stable.
The introduction of caps inside the RC (to make its geometry chaotic) has a positive impact on performances criteria (𝐶𝑉 and 𝜎𝛼 𝑑𝐵 ) but also implies a noticeable
decrease of the quality factor. To understand if the observed effects are due to the geometry modifications or to the quality factor decrease, we compare in the next section an empty RC with an RC loaded by an absorber.
IV. LOADING /ABSORPTION EFFECT
This section concerns the effect of loading / absorption in an RC on the same criteria as above, i.e. 𝑄 , 𝑑 , 𝐶𝑉 and normative criteria.
The following results correspond to the tests carried out at SIEPEL between 100 and 900 MHz with a frequency step of 2 MHz and for 60 stirrer positions. Data were collected at eight isotropic field probe positions without any receiving antenna in the chamber but with and without the presence of an absorber. The indicators shown have been obtained from the 𝑥 component of the electric field but similar results are obtained on 𝑦 and 𝑧 axes.
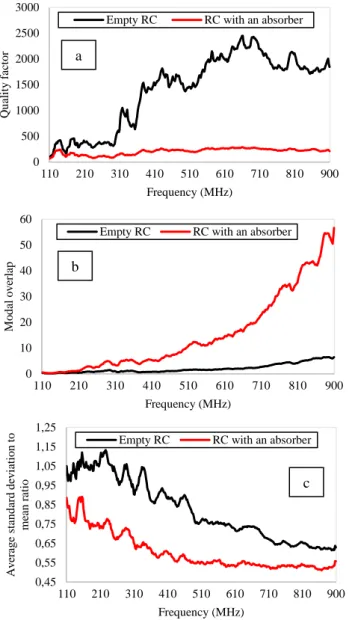
Fig. 4a highlights the huge decrease of the quality factor which is correlated to the large increase of the modal overlap (Fig. 4b). This has also a consequent impact on 𝐶𝑉 as shown in Fig. 4c. Indeed, above 600 MHz, we reach the ideal limit of Hill's hypothesis that is a ratio of 0.52.
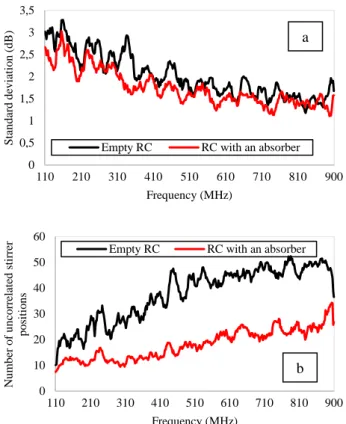
However, the presence of absorbing material causes a large decrease of uncorrelated stirrer positions (Fig. 5b). Significant changes in the chamber states occur only for more distinct positions of the stirrer due to the low quality factor. Besides, the maximum E-field is more uniform. On the one
hand, absorbing material participates to increase the average number of modes excited at each frequency and stirrer position. On the other hand, it reduces the number of states of the chamber to an apparently still acceptable limit.
According to standards [3] [4], the RC calibration requires the use of an isotropic field probe to measure the E-field components at the eight corners of the usable volume. In Fig. 6, we compare the standard deviation of both RC configurations at SIEPEL according to standard RTCA DO-160G for a frequency step of 2 MHz without frequential averaging. We observe a significant improvement in the statistical uniformity of the field. Only 5 exceedances of the standard limit are observed when the absorbing material is present whereas 43 of them are observed for the empty chamber configuration.
Obviously, we notice that the loading factor related to the presence of these absorbing materials induces an important decrease of the power density generated in the chamber. It seems reasonable to search for a trade-off between performance improvement and quality factor preservation.
To conclude this part, we can confirm the improvement of the 𝐶𝑉 while loading an RC. However, if one wishes to
1 1,2 1,4 1,6 1,8 2 2,2 2,4 2,6 2,8 300 350 400 450 500 550 600 S ta n d ar d d ev ia ti o n ( d B ) Frequency (MHz) Empty RC Chaotic RC 2 4 6 8 10 12 14 16 300 350 400 450 500 550 600 N u mb er o f u n co rr el at ed st ir re r p o si ti o n s Frequency (MHz) Empty RC Chaotic RC
Fig.3. ESYCOM RC. (a) Standard deviation. (b) Number of uncorrelated stirrer positions. Results averaged over a 10 MHz sliding window.
a b 0 500 1000 1500 2000 2500 3000 110 210 310 410 510 610 710 810 900 Q u al it y f ac to r Frequency (MHz)
Empty RC RC with an absorber
0 10 20 30 40 50 60 110 210 310 410 510 610 710 810 900 M o d al o v er lap Frequency (MHz)
Empty RC RC with an absorber
0,45 0,55 0,65 0,75 0,85 0,95 1,05 1,15 1,25 110 210 310 410 510 610 710 810 900 A v er ag e sta n d ar d d ev iat io n t o me an r at io Frequency (MHz)
Empty RC RC with an absorber
Fig.4. SIEPEL RC. (a) Quality factor. (b) Modal overlap. (c) Coefficient of variation. Results averaged over a 10 MHz sliding window.
a
b
significantly reduce the field standard deviation, it is necessary in return to strongly increase the load and thus reduce the number of independent realizations. It is therefore a question of making a compromise on the load to be added as the decrease of the quality factor (i.e. increasing the
modal overlap) helps to obtain a good field uniformity and to improve the 𝐶𝑉 but decreases the number of uncorrelated configurations.
V. CHAOTICITY IMPACT
In this section we compare the performances of the chaotic RC at ESYCOM laboratory with the one loaded by an absorber so that both cavities have the same quality factor and the only effect of the chaoticity can be put in relief. The experimental setup is the same as in the section III.
A. E-field Statistics
Fig. 7 shows the frequency variation of the quality factor, the modal overlap and the coefficient of variation (𝐶𝑉) in the RC with an absorber and in the chaotic one. All these quantities are averaged over a 10 MHz sliding window.
According to this figure, the quality factor is almost the same in both configurations which implies an identical modal overlap. Indeed, the modal overlap is proportional to V / Q (2), but the volume difference of classical and chaotic RCs is small (19 𝑚3 for the classical RC and 18 𝑚3 for the chaotic
one) compared to the overall quality factor. Considering the 𝐶𝑉, the two results are close to each other
0 0,5 1 1,5 2 2,5 3 3,5 110 210 310 410 510 610 710 810 900 S ta n d ar d d ev ia ti o n ( d B ) Frequency (MHz)
Empty RC RC with an absorber
0 10 20 30 40 50 60 110 210 310 410 510 610 710 810 900 N u mb er o f u n co rr el at ed st ir re r p o si ti o n s Frequency (MHz)
Empty RC RC with an absorber
Fig.5. Measurement results at SIEPEL. (a) Standard deviation. (b) Number of uncorrelated stirrer positions. Results averaged over a 10 MHz sliding window.
a
b
Fig.6. Standard deviation according to the RTCA DO-160G at SIEPEL. (a) Empty RC. (b) RC with an absorber.
0 1 2 3 4 5 6 7 100 200 300 400 500 600 700 800 900 S ta n d ar d ev ia ti o n ( d B ) Frequency (MHz) Ex Ey Ez DO 160 G Exyz 0 1 2 3 4 5 6 7 8 9 100 200 300 400 500 600 700 800 900 S ta n d ar d ev ia ti o n ( d B ) Frequency (MHz) Ex Ey Ez DO 160G Exyz a b 0 500 1000 1500 2000 2500 3000 300 350 400 450 500 550 600 Q u al it y f ac to r Frequency (MHz)
Chaotic RC RC with an absorber
0,5 1 1,5 2 2,5 3 300 350 400 450 500 550 600 M o d al o v er lap Frequency (MHz)
Chaotic RC RC with an absorber
0,5 0,55 0,6 0,65 0,7 0,75 0,8 0,85 300 350 400 450 500 550 600 A v er ag e sta n d ar d d ev iat io n t o me an r at io Frequency (MHz)
Chaotic RC RC with an absorber
Fig.7. ESYCOM RC. (a) Quality factor. (b) Modal overlap. (c) Coefficient of variation. Results averaged over a 10 MHz sliding window.
a
b
from 450 MHz and beyond. However, at low frequencies, we observe a significant decrease of this parameter in the chaotic configuration.
In the next section, we study two normative parameters, the number of uncorrelated stirrer positions and the standard deviation of maximum E-field uniformity as defined by the standards.
B. Study of Normative Parameters
Fig. 8 shows the curves of the standard deviation of maximum E-field uniformity and the number of uncorrelated stirrer positions. The addition of caps neither decreases the number of uncorrelated stirrer positions nor modifies the standard deviation criterion.
The impact of chaoticity is not significant on these normative parameters. However, it seems that below 430 MHz the chaotic cavity presents a slightly better maximum E-field uniformity on average. Indeed, the mean of the standard deviation between 300 and 400 MHz is about 1.82 in the RC with an absorber whereas it is about 1.76 in the chaotic reverberation chamber. Nevertheless, the standard criterion is not sensitive enough to this geometrical modification. As highlighted in Fig. 7, investigation of 𝐶𝑉 gives a better indication of the benefit of adding chaoticity in this 300 – 400 MHz frequency range.
C. Intensity Distribution According to Pnini and Shapiro
Let us consider the intensity distributions established by Pnini and Shapiro [5] [6] in order to study the contribution of geometry by the introduction of caps in an RC. The Pnini and Shapiro distribution depicts universal fluctuations of intensity in a chaotic cavity as a function of the so-called phase rigidity, itself related to the modal overlap (i.e. according to losses within the chaotic cavity).
We define the distributions of the normalized intensities of the electric field as:
𝑃𝐼(𝐼) = ∫ 𝑃01 𝜌(𝜌) 𝑃(𝐼; 𝜌)𝑑𝜌 (5)
with 𝜌 the phase rigidity and 𝐼 = |𝐸𝑎|
2
<|𝐸𝑎|2>𝑟 the field
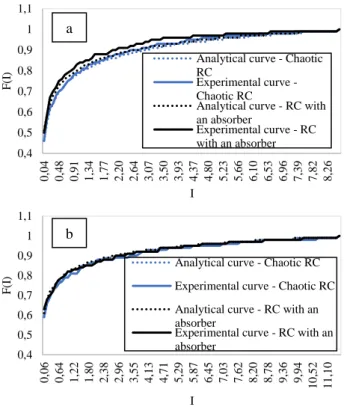
component intensity both extracted from experimental data. We draw the experimental and analytical cumulative density functions, noted 𝐹(𝐼) , of the distributions of the normalized intensity of the electric field, in the cases of the RC containing an absorber, then in the chaotic one at the ESYCOM laboratory between 390 and 410 MHz (Fig. 9 a) and between 980 and 1000 MHz (Fig. 9 b).
We clearly observe an effect of the cavity geometry between 390 and 410 MHz with a better agreement between experimental and theoretical distributions of the field intensity in the chaotic cavity. Indeed, the maximum difference between the analytical curve and the experimental one is about 0.04 in the RC with an absorber against 0.02 in the chaotic RC. Besides, in the frequency band 980 – 1000 MHz the experimental distributions are close to theoretical ones in both cavity configurations (0.02 in both cavities) as at high frequencies the empty RC works properly.
We can conclude from this section that the addition of caps does not affect the normative criteria (number of uncorrelated stirrer positions and maximum E-field uniformity). However, an effect is observed on the intensity distributions and on the 𝐶𝑉 at low frequency range (300 – 400 MHz), with a decrease of this ratio in the chaotic configuration.
VI. CONCLUSION
In this communication, we have investigated the impact of geometrical modifications, inspired from the chaotic
1 1,2 1,4 1,6 1,8 2 2,2 2,4 2,6 2,8 300 350 400 450 500 550 600 S ta n d ar d d ev ia ti o n ( d B ) Frequency (MHz)
Chaotic RC RC with an absorber
2 4 6 8 10 12 14 16 300 350 400 450 500 550 600 N u mb er o f u n co rr el at ed st ir re r p o si ti o n s Frequency (MHz)
Chaotic RC RC with an absorber
Fig.8. ESYCOM RC. (a) Standard deviation. (b) Number of uncorrelated stirrer positions. Results averaged over a 10 MHz sliding window.
a b 0,4 0,5 0,6 0,7 0,8 0,9 1 1,1 0 ,0 4 0 ,4 8 0 ,9 1 1 ,3 4 1 ,7 7 2 ,2 0 2 ,6 4 3 ,0 7 3 ,5 0 3 ,9 3 4 ,3 7 4 ,8 0 5 ,2 3 5 ,6 6 6 ,1 0 6 ,5 3 6 ,9 6 7 ,3 9 7 ,8 2 8 ,2 6 F (I ) I
Analytical curve - Chaotic RC
Experimental curve -Chaotic RC
Analytical curve - RC with an absorber Experimental curve - RC with an absorber 0,4 0,5 0,6 0,7 0,8 0,9 1 1,1 0 ,0 6 0 ,6 4 1 ,2 2 1 ,8 0 2 ,3 8 2 ,9 6 3 ,5 5 4 ,1 3 4 ,7 1 5 ,2 9 5 ,8 7 6 ,4 5 7 ,0 3 7 ,6 2 8 ,2 0 8 ,7 8 9 ,3 6 9 ,9 4 1 0 ,5 2 1 1 ,1 0 F (I ) I
Analytical curve - Chaotic RC Experimental curve - Chaotic RC Analytical curve - RC with an absorber
Experimental curve - RC with an absorber
Fig.9. Cumulative density functions of the distributions of the normalized intensities of the electric field in the RC containing an absorber and the chaotic one at ESYCOM between 390 - 410 MHz (a) and 980 – 1000 MHz (b).
a
cavity concept, on the field statistics within an RC. We showed that adding three metallic spherical caps on the RC walls enhances the field uniformity (𝐶𝑉 closer to its ideal value). However, it also decreases the quality factor due to the loading effect. Thus, we compare the RC in its chaotic configuration (with the three caps) with the RC including an absorber so that its quality factor is similar compared to the one of the chaotic RC. We showed that the chaotic configuration presents a better field uniformity in the 300 - 400 MHz frequency range, according to the coefficient of variation. Beyond 400 MHz, the two cavities present the same behavior. The Pnini-Shapiro distribution confirms these results. It has to be noticed that the normative field standard deviation is much less sensitive than the 𝐶𝑉.
We can conclude from the presented results that the addition of caps does not affect the normative criteria (number of independent realizations and statistical uniformity of the field). However, an effect of the cavity geometry is observed on other criteria as the 𝐶𝑉. Indeed, a geometry impact is seen when drawing the cumulative density functions of the distributions of the normalized intensity of the electric field.
This study also allows us to confirm that high absorption in an RC leads to an improvement of the modal overlap, 𝐶𝑉 and standard deviation but also results in a decrease in the number of uncorrelated stirrer positions. The 𝐶𝑉 parameter is more sensitive than the other ones since based on an estimation of the first moments of a distribution with a large sample. A trade-off may be searched as regards the quantity of absorbing material to be added in an already chaotic cavity to reach a good field uniformity while reducing the 𝐶𝑉 and keeping as much as independent stirrer positions as possible. The results presented in this article correspond to measurements in different RCs leading to coherent conclusions.
REFERENCES
[1] J-F. Rosnarho, S. Le Berre, Reverberation Chambers Handbook, SIEPEL, version 4 – 2018.
[2] P. Besnier, B. Démoulin, Electromagnetic Reverberation Chambers, ISTE/Wiley, Paris, 2011.
[3] IEC. “Electromagnetic Compatibility (EMC) Part 4-21: Testing and measurement techniques – Reverberation chamber test methods”, NF EN 61000-4-21, October 2011.
[4] RTCA. “Environmental Conditions and Test Procedures for Airborne Equipment”, RTCA DO-160G, December 2010.
[5] J.-B. Gros, U. Kuhl, O. Legrand, F. Mortessagne, “Lossy chaotic electromagnetic reverberation chambers: Universal statistical behavior of the vectorial field”, Phys. Rev. E 93, 032108, (2016) DOI: 10.1103/PhysRevE.93.0332108.
[6] R. Pnini and B. Shapiro, “Intensity fluctuations in closed and open systems”, Phys. Rev. E 54, R1032, August 1996 – https://journals.aps.org/pre/abstract/10.1103/PhysRevE.54.R1032. [7] P. Besnier, C. Lemoine, J. Sol, “Various estimations of composite
Q-factor with antennas in a reverberation chamber”, Proc. IEEE International Symposium on Electromagnetic Compatibility (EMC), 2015, pp. 1123-1227.
[8] U. Kuhl, O. Legrand, F. Mortessagne, K. Oubaha, M. Richter, “Statistics of Reflection and Transmission in the Strong Overlap Regime of Fully Chaotic Reverberation Chambers”, Invited Paper for session special sessions EMC at EUMCWeek 2017 in Nürnberg. [9] C. Lemoine, P. Besnier, M. Drissi, "Estimating the effective sample
size to select independent measurements in reverberation chamber”, IEEE transactions on electromagnetic compatibility, vol. 50, n°2, May 2008, pp 227-236.