HAL Id: hal-01634391
https://hal.archives-ouvertes.fr/hal-01634391
Submitted on 16 Mar 2018
HAL is a multi-disciplinary open access
archive for the deposit and dissemination of
sci-entific research documents, whether they are
pub-lished or not. The documents may come from
teaching and research institutions in France or
abroad, or from public or private research centers.
L’archive ouverte pluridisciplinaire HAL, est
destinée au dépôt et à la diffusion de documents
scientifiques de niveau recherche, publiés ou non,
émanant des établissements d’enseignement et de
recherche français ou étrangers, des laboratoires
publics ou privés.
Particle in box: A cell for in-situ measurements of
porosity and effective diffusion coefficient during
thermophysical transformations
Mariern Kacem, Sylvain Salvador, Ange Nzihou, Gilles Flamant
To cite this version:
Mariern Kacem, Sylvain Salvador, Ange Nzihou, Gilles Flamant. Particle in box: A cell for in-situ
measurements of porosity and effective diffusion coefficient during thermophysical transformations.
Industrial and engineering chemistry research, American Chemical Society, 2007, 46 (20), p.
6558-6565. �10.1021/ie061370k�. �hal-01634391�
Particle in Box: A Cell for in-situ Measurements of Porosity and Effective
Diffusion Coefficient during Thermophysical Transformations
Mariem Kacem,*,†Sylvain Salvador,†,‡Ange Nzihou,†,§and Gilles Flamant⊥,|
UMR 2392 CNRS-Centre de Recherche d’Albi en ge´nie des Proce´de´s des Solides DiVise´s, de l’Energie et de l’EnVironnement, Ecole des Mines d’Albi Carmaux, Campus Jarlard, 81013 Albi CT Cedex 09, France, Laboratoire Proce´de´s, Mate´riaux et Energie Solaire, PROMES-CNRS, 66120 Font-Romeu, France
The aim of this work is to develop an experimental device for the measurement of porous media textural properties during physical or chemical transformation. The method is based on gas tracer experiments. The system investigated consists of a spherical reactor containing a spherical porous media. To avoid surface stresses, there is no contact between the sample and the reactor. We called the cell a particle in box, or “PIB”. The porosity of the solid and the gas effective diffusivity were determined using a parametric identification method. The model is based on the perfectly stirred reactor approach. The PIB methodology was first checked at room temperature to determine the solid porosity and the effective diffusion coefficient. Experiments were then performed during transformation of a sample composed of a mixture of hydroxylapatite particles, glycerol, and water. In situ determination of the porosity and diffusivity from room temperature to 573 K (300 °C) was demonstrated.
1. Introduction
Heat treatment generates morphology transformations inside porous materials that affect their transport properties. Conse-quently, qualification of these transformations is a key point for realistic modeling.
The ultimate goal may be defined as finding methods that allow in-situ and on-line measurements of morphology trans-formation during the heat treatment. But, presently, most work deals with measurements at ambient temperature after sample cooling. Different characterization methods based on gas adsorption or microscopic analyses have been proposed.1-5 Research is mainly focused on relating structural properties and reactions kinetics.
Realistic information may be given by in-situ characterization of porous media. The first step is the observation of transforma-tions, as proposed by Nzihou and Adhikari.6-7 They have monitored sintering of hydroxylapatite containing lead oxide using an environmental scanning electron microscope (ESEM). Other researchers use Synchrotron microtomography to study densification of porous media.8-10 A second step aims at measuring a pertinent property that is strongly affected by the transformations, for example, diffusivity. Wicke and Kallen-bach’s cell11is well-known for diffusivity measurements at room temperature. Shigeno et al. modified this cell to perform diffusivity measurement during hematite reduction at different temperatures.12,13These authors have reported good results, but methods remain expensive and difficult to implement. We propose a simpler experimental device using a tracer gas method. It is possible to use a simple cell with a tracer gas method to characterize a particle in-situ during thermophysical
transforma-tions without change of sample size. On the contrary, if the chemical reaction is accompanied by a change of sample size, it is difficult to measure the properties in-situ, because the contact seals between the sample and the walls cannot be maintained, and consequently, the flow conditions vary. In order to overcome this problem, we propose a reactor which respects two requirements:
- avoiding tight contact between the sample and the wall; - allowing solid property measurement during experiment. The properties may be measured during transformation, i.e., at different temperatures, and without handling the sample (in-situ and real-time measurements).
Devices respecting these requirements are proposed in the literature. The annular cell is among these solutions. It is made of a cylindrical tube containing a sample (catalyst) of cylindrical form which is positioned axially and around which a fluid circulates in laminar flow. Mass transfer properties are often studied in this type of reactor. For example, Houzelot and Villermaux14studied radial diffusion in an annular reactor in the presence of a first-order chemical reaction. Ghoshand and Upadhyay15studied mass transfer in such a reactor for New-tonian and non-NewNew-tonian fluids. Mumallah16used this reactor to study the reaction of hydrochloric acid with limestone.
The perfectly stirred reactor (PSR) is another solution. By definition, the main property of a PSR is a uniform fluid concentration in the whole reactor volume. Matter exchange is based here on diffusion without privileging any particular geometric direction. The practical difficulty is to obtain this uniformity. This objective may be achieved by various tech-niques. Brisk et al.17and Tajbl et al.18suggested mixing catalyst and gases; the pellets of the catalyst were placed in a basket (metal grid) which turned at high speed around an axis. In other works, mixing is carried out by fluidization of the catalyst.19 One of the following techniques may be used to maintain a motionless sample and a well-mixed fluid around it:
- mechanical agitation by a propeller; however, this technol-ogy results in disturbances due to the agitator. Ford and Perlmutter20 studied the catalytic dehydration of alcohol in a reactor in which the catalyst is motionless and the gas is agitated by means of a two-blade engine. The Berty reactor,21
manu-* Corresponding author. Phone: (33)6 62 48 61 56. Fax: (33)3 83 59 55 31. E-mail: myriam.kacem@enstimac.fr. Address: 5 rue Canrobert 54000 Nancy, France.
†UMR 2392 CNRS-Centre de Recherche d’Albi en ge´nie des
Proce´de´s des Solides Divise´s.
‡E-mail: sylvain.salvador@enstimac.fr. §E-mail: ange.nzihou@enstimac.fr.
⊥Laboratoire Proce´de´s, Mate´riaux et Energie Solaire,
PROMES-CNRS.
factured using this principle, is marketed and used in various research works.22
- turbulences created by jets resulting in intense internal recycling streams.23-30
We chose this second method, named in the literature as a “jet-stirred reactor”.
2. Identification Model
2.1. Model. On the basis of the jet-stirred reactor assumption, gas tracing experiments were performed using purge injection. Then, parametric identification based on a direct model was applied to determine the porosity and diffusion coefficient.
Let us imagine a single spherical particle placed in a well-stirred reactor as illustrated in Figure 1; the cell is called a particle in box or “PIB”. The direct model describes mass transfer in the reactor and inside the sample. For diffusion-controled gas transport inside the particle (with no molar barycentric velocity), without chemical reaction, the tracer concentration varies according to Fick’s second law in spherical coordinates,
with ϵpas the particle porosity, Deff as the effective diffusion coefficient, and Cias the molar concentration of gas (tracer) in
the porous particle.
The boundary conditions are
With regard to the gas in the empty volume of the reactor (neglecting the external resistance located in the particle vicinity), the following relationship is developed:
Ci(t) represents the average concentration of the fluid in the
porous volume of the particle, C0is the initial fluid
concentra-tion, C(t) is the fluid concentraconcentra-tion, Ve is the empty volume between the particle and the cell walls, and Vpis the particle volume. Accounting for eq 1, the mass balance becomes the following:
A Laplace transform may be used to solve the mass balance equation. The transfer function is thus determined.22,26,27,31It is based on a model of mixers in a cascade arrangement with exchange. With respect to this approach, the transfer function G(s) of a PSR containing a porous solid is
Where, tmrepresents the gas residence time in the free volume, K ) ϵp(1 - ω)/ω is the capacity factor, ω is the ratio of free volume between the sample and the cell with respect to the total volume of the cell, ω ) (Vc- Ve)/Vc, Vcis the cell volume, and tDis the diffusion time in the particle. The external transfers are often neglected (mainly in the gas phase), and tDis thus defined by tD) ϵpλd2/Deffwith λ being a factor of form (λ ) 3/5for a sphere) and d being the particle equivalent diameter (d ) particle volume/particle surface; for a sphere, d ) dp/6). By inversion of the G(s), an analytical expression of the response to a purge injection is obtained,
∆ is defined by the following:
The assumption of sample spherical symmetry and homoge-neity was checked using the following tests:
- measurements of sphere diameter at different points around the sphere. A (2% error was measured.
- verification of the porosity distribution homogeneity at different positions inside the spherical sample (See Table 1). The porosity can be determined from an interpretation of the elution curve after the gas transition. The surface method is based on the integration of the surface area below the response curve that makes it possible to calculate the total volume of the gas inside the cell. Since the volume of the sample and the volume of the dead zones are known, the porosity can be calculated as ϵp ) Vpore/Vsample. The dead zone volume can determine by the elution curve of the experimental apparatus with a nonporous medium (two times measurements method). 2.2. Parametric Identification. The sensitivities of the direct model response curve to changes in porosity and in effective diffusion coefficient are not correlated. Therefore, the simul-taneous identification of a single value for each parameter is possible. The parameter identification method used is based on the Nelder-Mead simplex algorithm. Thus, we defined an
Figure 1. Schematic of the particle in box experimental device.
ϵp∂Ci(t) ∂t ) Deff r2 ∂ ∂r
(
r 2∂Ci(t) ∂r)
(1)- symmetry at the particle center, ∂Ci(t)
∂r
|
r)0) 0 (2)- continuity at the particle surface, C(t)particle) Ci(t) (3)
(entering flow) - (outgoing flow) )
(accumulation flow) + (flow exchanged with the particle)
QC0- QC(t) ) Ve dC(t) dt - ϵpVp dCi(t) dt (4) Q(C0- C(t)) ) Ve dC(t) dt - SDeff
(
∂Ci(t) ∂r)
r)R (5)Table 1. Porosity at Different Particle Levels Calcined at 5 K‚min-1 5 K‚min-1 radius 0 R/2 R porous volume (cm3‚g-1) 0.46 0.47 0.47 porosity 0.57 0.57 0.58 1 G(s)) 1 + tms + K tms 1 + tDs (6) C(t) C0 ) Xt1exp
(
- tt 1)
+ Yt2exp(
- t t2)
(7) with X ) 1 !∆(
1 tmtD +s1 tm)
and Y ) - 1 !∆(
1 tmtD +s2 tm)
∆ )((
K + 1 tD)
+ 1tm)
2 - 4 tmtD s1) - 1t 1 ) - 1 2((
K + 1 tD)
+ 1 tm- !∆)
and s2) - 1t 2 ) - 1 2((
K + 1 tD)
+ 1 tm+ !∆)
objective function (OF) to minimize the differences between the experimental response curve and the model response curve (eq 8). It corresponds to the standard deviation between the two curves.32For the first iteration, porosity and Deffare initialized with typical values.
Where, i is the number of points of each curve, yexpand ythare the discrete values of the experimental and theoretical response curves, respectively. They correspond to time evolutions of mass fractions.
If the response curve can be considered as being divided into two parts, the first part corresponds to the gas circulation in an empty volume and the second part corresponds to the gas particle diffusion. It has been established by other authors22and observed in this work that the response curve is affected by the textural properties of the sample only in the second part of the curve; the first part is affected mainly by the empty volume of the cell and the ideality of the injection signal. As a consequence, the part of the curve from t ) 0 to the time t when C/C0) 0.6 (for an N2transition from 100 to 0%) was not taken into account in the calculation of the OF.
Another point to be considered is the choice for the last point of the response curve that should be taken into account. The part of this curve close to C/C0) 0 (long times) is very sensitive to ϵpand Deff. Nevertheless, if a small error in the values of C/C0is introduced by the detector and integrated over a long period of time, the OF might be significantly altered. We found that stopping the calculation of the OF at the time when C/C0 ) 10-3was the best compromise.
Finally, the identification was taken between tC/C0
correspond-ing to the fraction C/C0in the range 0.6 to 10-3(Figure 2). 2.3. Taking into Account the Dead Volumes. The response curve of the PIB presents a time shift due to injection and detection systems and the presence of dead volumes. These volumes are distributed both upstream of the cell in the tracer gas injection system and downstream of the cell in the sampling system. They were taken into account in the present work.
Considering τinjto be the characteristic time of the injection, two methods are used:
- the direct method, namely, the two times measurements method. This consists in measuring the response signal for the injection system directly connected to the sampling system to determine τinj. This value is then deduced from tm.
- the indirect method. Since the temperature and the pressure of the tracer gas may vary from one experiment to another, The determination of the characteristic time τinjwas performed for each experiment by adjusting its valuestogether with the values of ϵp and Deffsto minimize the OF. It had previously been checked that the set of values τinj, ϵp, and Deffwas unique and
that forcing another value for τinjdid not lead to another set for ϵpand Deffvalues with a better value of the OF.
3. Experiments
3.1. Materials. 3.1.1. Samples for Experiments at Room Temperature. The samples used for the experiments carried out at room temperature were in 45 mm diameter spheres made of glass ceramic prepared through the procedure described elsewhere.33The sample is composed of calcium hydroxylapatite Ca-HAp, Ca10(PO4)6(OH)2, of 40 µm mean size and 7 wt % glass binder composed of oxides (SiO2, Na2O, K2O, MgO, CaO, P2O5, and B2O3). Two samples were prepared: one without gelatin and one in which 5 wt % of gelatin particles of 500 µm mean size was added. Then, Ca-HAp and the glass binder were mixed in water (40 wt %). The pasty mixture obtained was then shaped in a spherical mold and dried at room temperature for 5 days until the weight remained constant.
The dried agglomerate sphere obtained was calcined to evaporate the gelatin and the remaining water, thus generating the porous sample. The calcination experiments were carried out in a 2 L furnace under flowing air in which the samples were placed in an alumina crucible. The heating program was the following:
- heating rate of 1 K‚min-1from room temperature to the chosen temperature of 573 K (300 °C), and then, an isotherm plateau of 10 min;
- heating rate of 2 K‚min-1from 573 (300) to 1373 K (1100 °C) followed by a plateau of 30 min;
- cooling at the same rate.
Heating at 1373 K (1100 °C) leads to the complete sintering of the sample. This ensures that the properties of the prepared sample will remain constant during the experiment in the reactor. The total porosity of the sample was determined using the mercury porosimeter (Autopore III, 9410 Micrometrics). A porosity of 0.61 for the standard sample (prepared with only Ca-HAp, glass, and water) was obtained. The total porosity of the sample prepared with 5 wt % gelatin was 0.66. The pore volume distribution determined by the mercury porosimeter showed that the evaporation of the gelatin during the calcination step created wider macropores than those created with only water evaporation.
3.1.2. Sample for in-situ Experiments at Variable Tem-perature. For the in-situ measurements of the physicochemical transformations under thermal treatment, a sample composed of Ca-HAp, water, and glycerol was prepared. The purpose of the experiment was to follow the chemical and physical changes occurring during the evaporation of water and during the evaporation of glycerol. So, a sample made of Ca-HAp and 30 wt % of a 25 wt % glycerol solution was molded and dried at room temperature for 5 days, until the weight remained constant. A spherical sample was obtained.
A total porosity of 0.43 was determined for this sample using the mercury porosimeter.
Prior to the investigation of the behavior of the sample in the PIB, the thermal behavior of this sample was characterized using the thermogravimetric analysis-differential scanning calo-rimetery (TGA-DSC; Netzsch STA 409) analyzer. The scanning rate was 5 K‚min-1from room temperature to 573 K (300 °C). The results presented in Figure 3 show two distinct peaks. The first onescompleted at 373 K (100 °C)scorresponds to the evaporation of water from the sample, while the second peak is attributed to the evaporation of the glycerol, completed at 633 K (360 °C). This allows performance of characterization
Figure 2. Experimental curve range for parametric identification.
OF )1 i(
∑
t)1 i (yth(t) - yexp(t)) 2 ) (8)at three times: before evaporations, after water evaporation, and after glycerol evaporation, respectively.
The results presented in Table 1 reveal interesting information on the porosity distribution within the spherical sample heated with our experimental device. So, a solid sampling was made inside the spherical sample volume at different positions: the center of the sample (radius r ) 0), at R/2, and at the surface of the sample (r ) R). The porosity and the pore volume were determined using a mercury porosimeter for each sample. The results show that the porous sample prepared has a uniform pore distribution and thus could be adopted for the experiments aiming to investigate the chemical and physical changes in a homogeneous spherical solid during thermal treatment.
3.2. Experimental Device. The new experimental device (PIB) set up to follow the changes during the thermal treatment is made of two stainless steel hemispheres 5 cm i.d. The spherical reactor with one hemisphere removed is shown in Figure 4. The objective was to design a perfectly stirred flow system at steady state. Ideally, pure gas enters the reactor and is instantaneously and perfectly mixed with the gas within the reactor. Simultaneously, products of tracing are withdrawn from the cell volume, and the exiting flow rate is equal to the entering flow rate. The gas enters by six inlet tubes arranged as
symmetrically as possible in the reactor. At these points, an inlet/outlet device was made (Figure 5). Each one of them contains three injections holes, 0.35 mm in diameter. The mixture flows as small jets from the holes to the sample and into the surrounding gases. The mixture of gases fills the volume bounded by the inner seal and the inlet tubes and sample. The 18 small inlet mixture jets stir the reactor vigorously to make it homogeneous. The gas mixture exits through six outlet tubes, 1.7 mm in inner diameter (wider than the inlet ones to facilitate the evacuation of the gas from the reactor), placed in the center of the inlet/outlet device (Figure 5). The entire assembly is enclosed in a recuperation system. Upstream of the cell, gases cross the flow controllers and a four-way valve in a 0.9 mm inner diameter tube. At the furnace inlet, the tube has a spiral form and it is connected to a gas distribution system.
The analysis of gases exhausted from the reactor was carried out using a thermal conductivity detector (TCD) gas chromato-graph directly connected to the exit reactor by a tube placed in the gas recuperation system. A membrane pump and a valve placed after the chromatograph ensured a constant flow rate in the detector. The reactor was placed inside the chromatographer furnace. Argon and nitrogen were used as scanning gases (Figures 6 and 7).
The TCD calibration curve is established using the two mass flow meters by feeding gas mixturesswith different fractions of the two gasessat a constant total volume flow rate. A calibration curve with a standard deviation r2better than 0.998
is typically obtained.
The volume ratio (sample volume/cell volume) is then about 0.72. A preliminary study has demonstrated that the sensitivity
Figure 3. TGA-DSC curves for water and glycerol evaporation on the Ca-HAp sample.
Figure 4. PIB cell.
Figure 5. Detail of the inlet/outlet gas point.
to porosity and to diffusivity is better for high values of the volume ratio. This has been also observed in the work of Ahn,22 who suggests using a maximal volume ratio to precisely determine diffusivity. Thus, the ratio 0.72 was the maximum value technically feasible in our case.
3.3. Determination of the Operating Conditions. 3.3.1. Value of the Tracer Gas Flow Rate. The tracer gas flow rate should be high enough for the cell to behave as a PSR reactor whatever the operating temperature. In order to characterize the mixing in the cell, an experiment was run with a 44.5 mm diameter nonporous metal sphere placed in the cell. In the preliminary sensitivity study, it was demonstrated that porosity and diffusivity determination are better with a low flow rate. The criterion to determine the minimum flow rate was that the experimental number of mixers Nmixshould be in the range 1 ( 0.05. Indeed for the model under consideration, the number of mixers (Nm) is equal to 1. The difference between the ideal case (Nm) 1) and a real case may be evaluated by a number of mixers larger than one. Buffham and Gibilaro34consider that the number of mixers is not an integer. Nmixis determined from the characteristic response of a PSR to a purge injection,
Then, τ was calculated. If an experiment is run, an experimental value τexp can be determined by fitting this model with the experimental response. The number of mixers is then defined by
Experiments showed that for a flow rate of 1.3× 10⁻⁵m3‚s-1 and temperatures of 303 (30), 383 (110), and 573 K (300 °C) the reactor effectively behaves as a PSR. At 303 K (30 °C), this flow rate corresponds to a velocity of 7.7 m‚s-1in the 18 injection jets.
It has been observed that the pressure inside the cell changed when the operating temperature was varied. For instance, it increased from 102.3 kPa at room temperature to 104 kPa at 573 K (300 °C). The mass flow rates injected in the experiments
through the mass flow meters were calculated taking into account both the actual pressure and the temperature inside the cell.
3.3.2. Value of the Heating Rate during Experiments under Thermal Treatment. During the experiment under thermal treatment, the sample was heated and the temperature was first stabilized at 383 K (110 °C), and then heated again before finally stabilizing the temperature at 573 K (300 °C). The heating-rate value is a key parameter for the experiments. Indeed, if the sample is heated at too high a heating rate, the temperature evolution at the center of the sample will be very different from that at the surface. As a consequence, the sample may undergo strong mechanical constraints and the textural transformations may not be uniform inside it. On the other hand, heating rates that were too small would require very long experiments.
In order to characterize the heating rate, an experiment was run during which a thermocouple was placed at the heart of a sample and another thermocouple was placed in the empty space inside the cell. The sample was a Ca-HAp sphere; the two endothermic reactions of water evaporation and glycerol evapo-ration occured.
Figure 8 plots the temperature versus time evolution of the two thermocouples together with the furnace temperature in the case of a heating rate of 5 K‚min-1. The curves indicate that temperature difference between the heart of the sample and the surrounding gas remains less than 100 K even during the heating phase. We estimate that this difference remains acceptable. In the range 220 to 250 min, one can observe a small decrease in the slope of the sample temperature, which is due to the endothermic evaporation of glycerol. After 100 min following a heating phase, the sample was almost isothermal; the characterization experiments were run after this stabilization period.
3.3.3. Effect of a Change of the Sample Diameter. The physical transformations undergone by the sample may induce a change in its diameter. If an error is introduced in the sample diameter during the parameter estimation procedure, the derived characteristic will be affected. In order to evaluate this quantitatively, the error on the fitted parameters due to 1% (0.5 mm) error on the sample diameter was calculated. It was found that the error for the sample porosity was less than 0.01% and that the error on the effective diffusivity was 5.6%. Conse-quently, an uncertainty in the sample diameter of 2% remains acceptable.
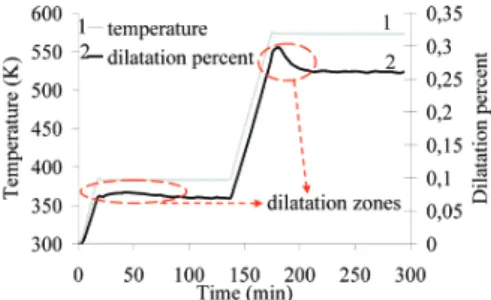
At this stage, the PIB experiment was not associated with a sample diameter measurement device. Prior to the experiment under thermal treatment, it was necessary to determine the change in diameter of the sample during heating up to 573 K (300 °C). Thermal mechanical analysis (TMA; Setaram Setsys 16/20) was used. Figure 9 illustrates the TMA curves for a cylindrical sample 3.98 mm in diameter and 13.2 mm long submitted to the following thermal treatment: heating from 303
Figure 7. Photos of the PIB cell.
C C0 ) exp
(
- t τ)
(9) with τ )Ve Q Nmix)τexpτ (10)Figure 8. Temperature evolution at different parts in the cell under heat treatment.
(30) to 383 K (110 °C) at 5 K‚min-1 and holding for 2 h, followed by heating from 383 to 573 K (300 °C) at 5 K‚min-1 and holding for 2 h. The curve shows two dilatation zones during the heating periods, both followed by zones where the sample size is stable. The total dilatation of the sample is 0.26%, which is satisfactory for the experiments in the PIB cell without radius particle change.
3.3.4. Estimation of the Total Error in the Determination of the Sample Properties. The uncertainty on the values for the sample porosity and the sample effective diffusivity is difficult to determine exactly; it is estimated as follows. It is assumed that the main uncertainties are introduced through the tracer gas flow rate, (1%; the sample diameter, (0.4%; the diameter of the cell, (0.2%; and the analysis of the tracer gas (determined by reproducibility method), (0.01%.
Finally, it was found (from a number of simulations com-bining the errors on all parameters and trying to maximize the total error) that the PIB cell method could determine the parameters with a minimum error of (1.9% for sample porosity and (7.2% for the diffusivity.
4. Results and Discussion
4.1. Experiments at Room Temperature. The first experi-ments were run at room temperature, using two biomaterials. The first one was prepared without gelatin, while 5 wt % gelatin was used for the second one. The experiments were repeated 3 times for each sample; the averaged values obtained are reported in Table 2. As also indicated in the table, the scatters between the values during repeatability tests were less than (2% for porosity and less than (12% for diffusivity. The values obtained for ϵp can be compared with the values obtained from other methods, including the mercury porosimeter and surface meth-ods (Table 2). For the two biomaterials, the difference between the measured porosity using the PIB and the values from the two reference methods is 2% only; this result is very satisfactory. One can also note that, for a given measurement technique, the sample prepared with 5% gelatinswhich is removed during the preparation processsexhibits 5% more porosity than the sample prepared without gelatin.
A good agreement is found for the value of porosity determined by various methods. The values of Deffare close,
both with and without gelatin. The presence of gelatin influences pore distribution and porosity but does not significantly influence Deff.
4.2. Measurement Reproducibility. To evaluate measure-ment error, different tracer experimeasure-ments were done for the same sample and in the same experiment conditions. A comparison between response signals shows a good repeatability of the signal, the mean deviation for all points being about 2.8× 10⁻³. 4.3. Experiments under Thermal Treatment. The next step in the evaluation of the PIB was to determine ϵ and Defffor a sample that undergoes textural changes between two charac-terizations. One characterization was realized on the initial sample at room temperature, while two were operated under temperature, at 383 (110) and 573 K (300 °C).
The sample was therefore placed in the cell and characterized, then heated to 383 K (110 °C) at 5 K‚min-1, and maintained at this temperature for 3 h and characterized. It was finally heated to 573 K (300 °C) (again at 5 K‚min-1) and maintained for 3 h at this temperature before the third and final characterization. All results are reported in Figure 10. In order to eliminate the effect of temperature on Deff, the results for diffusivity are expressed through the ratio Deff/DN2Ar.
The sample porosity is found initially at 0.30 and increases to 0.36 after removal of the water and to 0.52 after removal of the glycerol. Mercury porosimetry requires submitting the sample to vacuum, which induces the removal of water and glycerol: it could not be used for the initial sample and the sample after removal of the water. The porosity of the final sample was measured at 0.55 which is very close to the value of 0.52 determined at 573 K (300 °C) using the PIB. Since the TMA has shown that the sample size does not change significantly along the heating process, this agreement can be taken as a validation.
It can be noted that the mass loss during water removal measured from the TG experiment is 3%, and the increase in porosity due to this transformation is 0.36-0.3 ) 0.06. As far as glycerol removal is concerned, the mass loss is 11% while the increase in porosity is 0.53-0.36 ) 0.17.
The total porosity of the initial sample was calculated at 0.4 from the measurement of its true density measured using helium pycnometry (Micrometrics, Accupyc 1330); the value of the porosity derived from the PIB is 0.30. The difference between the two values can be attributed to closed porosity, which is not taken into account by the PIB cell. After the two evapora-tions, the true density of the sample measured is equivalent to a porosity of 0.55. This value is in good agreement with the previously determined ones.
The ratio Deff/DN2Arincreases from 0.077 for the initial sample to 0.083 for the sample after the removal of the water and to 0.091 after the removal of glycerol. Unfortunately, no reference technique was available to compare with these values.
Diffusivity depends on the porosity and tortuosity factor of porous media. The morphological model of a cylindrical
Figure 9. TMA of the Ca-HAp sample with 30 wt % of a solution of 25
wt % glycerol dried at room temperature.
Table 2. Results of Parametric Identification for the Two Different Porous Samples with and without Gelatin
sample w/o gelatin sample 5% gelatin ϵp mercury porosimeter 0.61 ( 1.8% 0.66 ( 1.9% surface method 0.59 0.64 parametric identification 0.58 0.63 Deff(m2‚s-1) parametric identification 6.41× 10⁻⁶( 11% 7.83 × 10⁻⁶( 12%
Figure 10. Porosity and Deff/DN2Arevolution during the thermal process
capillary gives Deff ) ϵp/τDN2Ar. The water and glycerol evaporation increase the porosity. The tortuosity factor evolution is more complex to explain because liquid can evaporate through the shortest path resulting in a decrease in the tortuosity factor and liquid connection with the solid can close pores inside the material. When evaporation occurs, tortuous paths can be created.
5. Conclusion
A new cell that enables the simultaneous determination of porosity and of effective diffusivity of a single porous sphere (45 mm i.d.) within less than 1 min has been successfully developed. The sphere sample is neither in contact with the cell walls that contains it nor in contact with any tightness system; this allows small changes in the diameter of the sample to occur. The measurements can be taken under temperature, without cooling the sample prior to characterization.
By injecting the tracer gas through 18 jets, the conditions of PSR in the empty volume of the cell were obtained for a tracer gas flow rate of 1.3× 10⁻⁵m3‚s-1.
The first tests at room temperature indicated that the values for porosity determined from the PIB were in very good agreement with two reference techniques.
The tests performed under thermal treatment proved that measurements at temperatures up to 573 K were possible. The scattering in the values determined when the characterization experiment was repeated several times did not exceed (2% porosity.
The values of the diffusivity coefficient found in this work are in agreement with known values for gases in porous materials. Nevertheless, the error for diffusivity measurement is more important than for porosity measurement. It is known that diffusivity values found using different measurement techniques are not equal for the same system.35Thus, the error found in this work is acceptable.
The parameter identification procedure is based on a quite direct model that describes the experiment. Nevertheless, it requires a number of precautions. The dead volumes in the tracer gas injection and sampling devices have to be taken into account. The objective function that compares the experimental response to the model-predicted one should be calculated on a limited period of time during the experiment.
The work shows that the diameter of the sample should be known with an accuracy of (0.5 mm for the measurements to be accurate. Experiments were run with samples whose diameter did not change significantly along the heating process. In the case where the diameter might change more significantly, the PIB should be combined with an online diameter measurement system.
Experiments were carried out during temperature plateau and after waiting for the end of the transformation. Thus, one can expect that the PIB will make it possible to follow the textural transformation continuously along the heating process in the case of slow transformations.
Literature Cited
(1) Vix-Guterl, C.; Shah, S.; Dentzer, J.; Ehrburger, P.; Manocha, L. M.; Patel, M.; Manocha, S. Carbon/carbon composites with heat-treated pitches II. Development of porosity in composites. Carbon 2000, 38, 673. (2) Liming, L.; Sahajwalla, V.; Harris, D.; Coal Char Reactivity and Structural Evolution during Combustion-Factors Influencing Blast Furnace Pulverized Coal Injection Operation. Metall. Mater. Trans. B 2001, 32B, 811.
(3) Zhang, L. H.; Calo, J. M. Thermal desorption methods for porosity characterization of carbons and chars. Colloids Surf. A 2001, 187, 207.
(4) Feng, B.; Bhatia, S. K.; Barry, J. C. Structural ordering of coal char during heat treatment and its impact on reactivity. Carbon 2002, 40, 481. (5) Park, K.; Seo, D. J. Gas sensing characteristics of BaTiO3-based
ceramics. Mater. Chem. Phys. 2004, 85, 47.
(6) Nzihou, A.; Adhikari, B. Effect of oxides and nitrates of lead on the sintering and densification oh hydroxyapatite adsorbents. Ind. Eng. Chem. Res. 2004, 43 (13), 3325.
(7) Nzihou, A.; Adhikari, B.; Pfeffer, R. Effect of metal chlorides on the sintering and densification oh hydroxyapatite adsorbents. Ind. Eng. Chem. Res. 2005, 44, 1787.
(8) Gendron D. Etude nume´rique et expe´rimentale du frittage a` l’e´chelle du grain. Ph.D. thesis, University of Bordeaux I, France, 2001.
(9) Lame, O.; Bellet, D.; Di Michiel, M.; Bouvard, D. Etude de l’e´volution microstructurale de poudres me´talliques en cours de frittage par microtomographie. ReV. Me´tall._SF2M 2001, 185.
(10) Lame, O.; Bellet, D.; Di Michiel, M.; Bouvard, D. Analyse du frittage de poudres me´talliques par microtomographie synchrotron in situ; Colloque De la poudre au mate´riau massif, Ecole des Mines d’Albi-Carmaux, 2003, 189.
(11) Wicke, E.; Kallenbach, R. Die Oberflachen diffusion von Kohlen-dioxid in aktiven Kohlen. Kolloide Z. 1941, 2, 135.
(12) Shigeno, Y.; Sakakibara, T.; Omori, Y. High Temperature Measure-ment of the Effective Diffusivity through Coke and Graphite by the Wicke-Kallenbach method. Trans. Iron Steel Inst. Jpn. 1988, 28, 697.
(13) Shigeno, Y.; Sakakibara, T.; Omori, Y. In situ measurment of effective gas diffusivity through hematite pellets during stepwise reductions. Metall. Trans. B 1990, 21B, 677.
(14) Houzelot, J. L.; Villermaux, J. Mass transfer in annular cylindrical reactors in laminar flow. Chem. Eng. Sci. 1977, 32, 1465.
(15) Ghoshand U. K.; Upadhyay, S. N. Mass transfer to Newtonian and non-newtonian fluids in short annuli. AIChE J 1985, 31, 101721.
(16) Mumallah, N. A. Hydrochlorique acid diffusion coefficients at acid-fracturing conditions. J. Pet. Sci. Eng. 1996, 15361.
(17) Brisk, M. L.; Day, B. E.; Jones, M.; Warren, J. B.; Development of a stirred gas-solid reactor for the measurement of catalyst kinetics. Trans. Inst. Chem. Eng. 1968, 46a, 3.
(18) Tjabl, D. J.; Simons, J. B.; Carberry, J. J. Heterogeneous catalysis in a continuous stirred tank reactor Ind. Eng. Chem. Fundam. 1966, 5, 171. (19) Anderson, R. B. Experimental methods in catalytic research; Academic Press: New York and London, 1968.
(20) Ford, F. E.; Perlmutter, D. D. The kinetics of the brass-catalysed dehydrogenation of sec-butyl alcohol. Chem. Eng. Sci. 1964, 19 (6), 371. (21) Berty, J. M. Reactor for vapor-phase catalytic studies. Chem. Eng. Prog. 1947, 70, 78.
(22) Ahn, B. J. Etude des caracte´ristiques diffusionnelles de transfert de matie`re dans un re´acteur catalytique a` lit fixe d’oxydation me´nage´e. Ph.D. thesis, Technology University of Compiegne, France, 1980.
(23) Longwell, J. P.; Weiss, M. A. High temperature reaction rates in hydrocarbon combustion. Ind. Eng. Chem. 1955, 47 (8), 1634.
(24) Bush, S. F. The design and operation of single-phase jet-stirred reactors for chemical kinetic studies. Trans. Inst. Chem. Eng, 1969, 47, 59. (25) Matras, D.; Villermaux, J. Un re´acteur continu parfaitement agite´ par jets gazeux pour l’e´tude cine´tique de re´actions chimiques rapides. Chem. Eng. Sci. 1973, 28, 129.
(26) Matras, D. Conception et essais d’un re´acteur auto agite´ pour l’e´tude cine´tique de re´actions chimiques rapides en phase gazeuse. Ph.D. thesis, University of Nancy I, France, 1973; p 225.
(27) Villermaux, J.; Matras, D. Une nouvelle formulation dynamique des interactions fluide solide- Application a` des mesures de diffusivite´s intraparticulaires et de constantes d’e´quilibre d’adsorption. Can. J. Chem. Eng. 1973, 51, 636.
(28) David, R.; Houzelot, J. L.; Villermaux, J. A novel and simple jet-stirred reactor for homogeneous and heterogeneous reactions with short residence times. Chem. Eng. Sci. 1979, 34, 867.
(29) Dagaut, P.; Reuillion, M.; Cathonnet, M. Experimental study of the oxidation of n-heptane in a jet stirred reactor from low to high temperature and pressures up to 40 Atm. Combust. Flame 1995, 101, 132. (30) Coˆme, G. M.; Li, Y.; Barbe, P.; Gueritey, N.; Marquaire, P. M.; Baronnet, F. Competition between gas and surface reactions in the oxidative coupling of methane 2. Isothermal experiments in a catalytic jet-stirred gas phase reactor. Catal. Today 1996, 30, 215.
(31) Villermaux. J. Theory of linear chromatography. In Percolation Processes: Theory and Application; Rodrigues, A. E.; Tondeur, D., Eds.; Sijthoff: Amsterdam, 1981.
(32) Villermaux, J.; Antoine, B. Construction et ajustement des mode`les mathe´matiques: une science ou un art? Bull. B.R.G.M. (deuxie`me se´rie)
(33) Zahraoui, C. Greffage de biomole´cules sur un nouveau biomate´riau a` base d’hydroxylapatite-application aux implants osseux. Ph.D. Thesis, University of Paul Sabatier, Toulouse, 1999.
(34) Buffham, B. A.; Gibilaro, L. G. A generalization of the tanks-in-series mixing model. AICHE J. 1968, 1 (14), 805.
(35) Authelin, J. R. Etude du transport de matie`re dans les catalyseurs a` base de ze´olite par la me´thode chromatographique. Cas d’un traceur inerte
en pre´sence et en l’absence de re´action chimique. Ph.D. Thesis, Institut National Polytechnique de Lorraine, France, 1988.