HAL Id: hal-00989700
https://hal.archives-ouvertes.fr/hal-00989700
Submitted on 12 May 2014
HAL is a multi-disciplinary open access
archive for the deposit and dissemination of
sci-entific research documents, whether they are
pub-lished or not. The documents may come from
teaching and research institutions in France or
abroad, or from public or private research centers.
L’archive ouverte pluridisciplinaire HAL, est
destinée au dépôt et à la diffusion de documents
scientifiques de niveau recherche, publiés ou non,
émanant des établissements d’enseignement et de
recherche français ou étrangers, des laboratoires
publics ou privés.
and robustness to geometrical distortions
Matthieu Urvoy, Dalila Goudia, Florent Autrusseau
To cite this version:
Matthieu Urvoy, Dalila Goudia, Florent Autrusseau.
Perceptual DFT watermarking with
im-proved detection and robustness to geometrical distortions.
IEEE Transactions on Information
Forensics and Security, Institute of Electrical and Electronics Engineers, 2014, 9 (7), pp.1108-1119.
�10.1109/TIFS.2014.2322497�. �hal-00989700�
Perceptual DFT watermarking with improved
detection and robustness to geometrical
distortions
Matthieu Urvoy, Dalila Goudia, Florent Autrusseau
Abstract
More than ever, the growing amount of exchanged digital contents calls for efficient and practical techniques to protect intellectual property rights. During the past two decades, watermarking techniques have been proposed to embed and detect information within these contents, with four key requirements at hand: robustness, security, capacity and invisibility. So far, researchers mostly focused on the first three, but seldom addressed the invisibility from a perceptual perspective and instead mostly relied on objective quality metrics.
In this paper, a novel DFT watermarking scheme featuring perceptually-optimal visibility versus robustness is proposed. The watermark, a noise-like square patch of coefficients, is embedded by substitution within the Fourier domain; the amplitude component adjusts the watermark strength, and the phase component holds the information. A perceptual model of the Human Visual System (HVS) based on the Contrast Sensitivity Function (CSF) and a local contrast pooling is used to determine the optimal strength at which the mark reaches the visibility threshold.
A novel blind detection method is proposed to assess the presence of the watermark. The proposed approach exhibits high robustness to various kind of attacks, including geometrical distortions. Experimental results show that the robustness of the proposed method is globally slightly better than state-of-the-art. A comparative study was conducted at the visibility threshold (from subjective data) and showed that the obtained performances are more stable across various kinds of contents.
Index Terms
Watermarking, visibility, robustness, contrast sensitivity, Fourier, subjective experiment, Grubbs’ test
I. INTRODUCTION
Facing the ever-growing quantity of digital documents transmitted over the internet, it is more than ever necessary for efficient and practical data hiding techniques to be designed in order to protect intellectual property rights.
Copyright (c) 2013 IEEE. Personal use of this material is permitted. However, permission to use this material for any other purposes must be obtained from the IEEE by sending a request to pubs-permissions@ieee.org
M. Urvoy, D. Goudia and F. Autrusseau are with LUNAM Universit´e, Universit´e de Nantes, IRCCyN UMR CNRS 6597, Institut de Recherche en Communications et Cybern´etique de Nantes, Polytech Nantes, rue Christian Pauc BP 50609 44306 Nantes Cedex 3.
Watermarking is one such technique and has been extensively studied for the past two decades; applied to still images, it comes down to embedding an invisible information, called watermark, that can be retrieved and matched even when the watermarked image was attacked to some degree.
Four key requirements have been driving researchers in designing watermarking algorithms: the invisibility, the robustness, the capacity and the security. Any watermarking algorithm should ideally provide the best tradeoff between these four aspects. Lately, security has been widely studied [1]; as for the invisibility, the robustness and the capacity, they influence each other and often must be addressed together. For instance, when the robustness is increased, the perceptual quality of the watermarked image inevitably decreases.
Yet, few works address the problem of invisibility from a perceptual perspective. Watson’s visual models [2], [3], in particular, have been used to compute Just Noticeable Differences (JND) masks, thus providing a perceptual model of the visibility of the watermark [4], [5] which was embedded either in the Discrete Cosine Transform (DCT) or the Discrete Wavelet Transform (DWT) domains. More recently, another Human Visual System (HVS) model was used for DWT embedding [6]. Some of these methods are non-blind [4] or require side information to be transmitted in order to reconstruct the JND mask at the receiver [5], [6]. Some other perceptual methods are fully blind but they use heuristics instead of HVS models to derive JND masks [7], [8], [9].
Alternatively, some approaches based on statistical Objective Quality Metrics (OQMs) tune the embedding strength based on the computed quality score [10], [11] and do not require any side information at the receiver either. However, two main problems emerge: these metrics often provide wrong estimates of the perceived quality; more importantly, OQMs provide a continuous quality scale and were not intended to scenarios, such as watermarking, targeting the visibility threshold. In practice, the only reliable way to assess the invisibility is to conduct a subjective experiment in which observers are asked whether they can notice the watermark or not. In addition, most comparisons between watermarking techniques found in the literature are also based on OQMs – most often the Peak Signal to Noise Ratio (PSNR) – which, as will be shown in this paper, can be misleading.
Besides invisibility, the robustness is also a key aspect in watermarking. None of the aforementioned techniques are robust to common attacks such as geometrical distortions: they cannot efficiently withstand their desynchronization effects. Rotation-Scale-Translation (RST) invariant techniques have been proposed to address this issue through the use of appropriate transform domains. In [12], the watermark is embedded in the Fourier-Mellin domain, to the cost of an important algorithmic complexity. Later, in [13], log-polar mapping of the Fourier domain is used to make the watermark robust against RST attacks. Another log-polar Fourier embedding technique is proposed in [14]. Besides these log-polar mapping techniques – that commonly exhibit an important computational load –, some directly embed the watermark within the modulus of the Discrete Fourier Transform (DFT). In [15], the watermark is made rotation invariant thanks to its circular shape. A similar technique is proposed in [16] where circular dots are embedded in the Fourier transformed coefficients.
The success of a watermarking algorithm not only depends on its embedding strategy, but also on its detection strategy. In particular, properly estimating the optimal detection threshold is crucial and thus has been extensively
with and without embedded watermark in the considered host content. In [17], [18], statistical models for the signal and the watermark are used to derive a theoretical threshold. Typically, these are Gaussian or binomial models; the threshold is chosen so as to limit the probability of false detections. However, the statistics of both the watermark and the host image are likely to change with various parameters (e.g. watermark size, embedded message, etc), thus impacting the parameters of the fitted models, which in turn requires for the detection threshold to be re-evaluated. Moreover, if the statistics of both the host image and the watermark do not quite strictly fit the derived models, the obtained threshold is likely not to be optimal.
In this work, a robust, blind, substitutive and perceptual watermarking technique is proposed. Various characteris-tics of the HVS are used to determine and adjust the visibility level of the embedded watermark, thus resulting in an optimal invisibility versus robustness tradeoff. The proposed technique is designed to be robust against various kinds of attacks (including geometrical distortions). In addition, a subjective experiment is conducted in order to assess the invisibility of the watermark. Finally, the proposed detection strategy is efficient and adapts to the statistics of the watermark.
II. OVERVIEW OF THE CONTRIBUTION
Similarly to [15], [16], it is proposed to embed the watermark in the Fourier domain; the magnitude is used to control the energy of the watermark while the phase is used to hold its information. For best robustness, the watermarked coefficients are grouped into two symmetrical square patches, which can be expressed as a sum of sinewaves. Once displayed, this results in a combination of sine gratings at various visual frequencies and orientations: a perceptual model is used to adjust their amplitude at the visibility threshold. The watermarked image is then obtained by inverse Fourier transform. Sec. III describes the perceptual model, then Sec. IV focuses on the embedding process. Sec. V details the detection process.
The proposed method is designed to be robust against multiple kinds of attacks. Sec. VI investigates the robustness of the proposed method in comparison to [15] and [16]. Sec. VII reports the results of a subjective experiment assessing the visibility of the watermark Sec. VIII then re-evaluate the robustness when the strength has been adjusted according to the observers feedback. Finally, Sec. IX validates the proposed approach in the context of low quality Print & Scan (P&S).
III. REACHING THE VISIBILITY THRESHOLD
Choosing the appropriate watermark strength is a delicate but crucial step while designing a watermarking technique. Over-estimations of the strength are likely to result in visible watermarks; on the contrary, under-estimations are likely to reduce the robustness performances. In this paper, it is proposed to use some properties of the HVS to automatically determine the perceptually optimal watermarking strength, at which the embedded watermark appears at the visibility threshold.
Computational models of the HVS providing estimates for the visibility of differences between an original and a distorted image have been proposed, such as in [19], [20], [21], [22] and [23]. They generally implement some
embed ourier rotation is the depends In threshold Usually, and without [13], atermark these IsRGB Gamma expansion Γ RGB to CIE XYZ Y Foveal filter Φ 1/x Fourier transform F(fk, θk) CSF (fk, θk) Psycho-metric function Pooling ! fk,θk Ψmark Viewing conditions IRGB Ymean Ylocal FY Cτ ∗ local Ψ(Cτ ∗ local)
Fig. 1. The proposed HVS model estimates the probabilityΨmark that a watermark – embedded in an imageIsRGBat visual frequenciesfk
and orientationsθk– is visible. Please refer to Section III for employed notations.
of the following elements: (1) non-linear sensitivity to the amplitude of the luminance, (2) conversion to contrast, (3) contrast sensitivity to visual frequencies, (4) oblique effect, (5) subband decomposition into visual channels, (6) masking effects, (7) psychometric probability of detection and (8) error pooling. A survey of these models can be found in [24].
Practical applications, however, may not implement all of these HVS properties; visual channels, for instance, may be discarded due to their high complexity and their rather small contribution to the visibility estimates [23]. In a preliminary subjective experiment involving 4 expert observers, it was reported that the proposed watermark is first noticed in uniform image areas where masking effects do not occur (see Sec. VII-B for experimental details). Therefore, the proposed HVS model is simplified and discards the perceptual channel decomposition. Moreover, excluding the masking effects from the model underestimates the visibility threshold and thus the watermark strength: the invisibility requirement is met anyway. The proposed model is illustrated in Fig. 1.
A. Modeling viewing conditions
Typically, HVS models require both the viewed image and the viewing conditions to be input. LetIsRGB(x, y)
denote an image to be watermarked, 0 ≤ x < Rx, 0 ≤ y < Ry, whereRx andRy are respectively its horizontal
and vertical resolutions. Let Sx andSy denote IsRGB’s displayed size in meters. The display illumination is noted
L; it is set to 280 cd.m−2 in the proposed model, a typical value for modern LCD monitors (slightly above the
advised illumination level in [25]). The viewing distanced is generally expressed as a multiplicative factor of the
B. From pixel values to perceived contrast
Contrast sensitivity models generally take physical luminance in cd.m−2 as an input; digital images on the other
hand are gamma encoded for display purposes. The proposed model assumes that a typical monitor (γ = 2.2) is used for display; the standard RGB (sRGB) color space [26] will thus be used. Gamma expansion (Γ) is first
applied toIsRGBin order to transform the original sRGB pixel values into linear RGB values:IRGB= Γ (IsRGB). In
a second step,IRGBis converted into the CIE XYZ color space, with D65 white point. LetIXYZ denote the obtained
image; its component Y is proportional to the physical luminance and will thus be used for contrast computation
and watermark embedding.
Michelson’s formula for contrast [27], when applied to a sine grating of peak amplitudeApeak, defines the contrast
as
C(x, y) = Apeak
Ymean(x, y)
, (1)
whereYmean is the mean illumination of the area supporting the sine grating. In typical images, the illumination
varies locally; Ymean thus needs to be computed locally as well. As proposed in [28], a raised cosine filter Φ of
diameter one degree of visual angle is applied to Y to obtain Ymean(x, y); this provides an estimate of the average
foveal illumination over the entire image domain. The Fourier domain, which is later used to embed the watermark,
is not spatially localized. Prior to applying such non-localized processing steps, it is proposed to normalizeY with
respect to the local luminance Ymean. The locally normalized luminance map Ylocal(x, y) = Y (x,y)/Ymean(x,y) may
then be input to Fourier computations. Within this normalized luminance space, the local contrast of a sine grating writes as
Clocal= Apeak . (2)
C. Contrast sensitivity
The sensitivity to contrast is influenced by numerous factors [29]. Intensive research has made available a large number of computational models known as Contrast Sensitivity Functions (CSFs), describing our sensitivity to contrast levels as a function of the visual frequency: the CSF returns the inverse of the threshold contrast above which a sine grating becomes visible. In [29], an accurate CSF is built by interlinking models for the optical Modulation Transfer Function, the photon noise, the lateral inhibition, and the neural noise. Some aspects of this model, though, are not theoretically supported; authors in [30] addressed these issues and incorporated better models for cone and midget ganglion cell densities. However, the resulting models are computationally intensive and do not fit practical applications such as ours.
CSFs with medium to low complexities have been made available as well. In [31], the CSF proposed by Mannos and Sakrison features a single parameter, the visual frequency. However, such a model lacks important factors such as light adaptation and stimulus size. In, the CSF proposed by Daly features key factors, but was designed to be used within his Visible Differences Predictor (VDP) quality model and should be used with caution in other contexts. In [32], finally, Barten provides a simplified formula for his initial CSF, which also incorporates the oblique effect
and the influence of the surround luminance. In this paper, the proposed Fourier watermark embedding technique (as will be further discussed in section IV), modifies frequency coefficients whose orientations are oblique. For this reason, it is necessary to implement the oblique effect as our sensitivity varies with the orientation of the visual pattern. Barten’s simplified CSF formula [32], at binocular viewing, will thus be used in the proposed model:
CSF(f, θ) = 5200 · e−0.0016·f2(1+100L ) 0.08 · 1 + 144 Θ2(I) + 0.64 · f 2· ⇣1 + 3 sin2(2θ)⌘ !−0.5 · ✓ 63 L0.83 + 1 1 − e−0.02f2 ◆−0.5 (3)
wheref is the visual frequency in cycles per degree (cpd), L is the adaptation luminance in cd.m−2and is assumed
to be equivalent to the display illumination (see Sec. III-A),Θ2(I) is the square angular area of the displayed image
I in square visual degrees, and θ the orientation angle.
From Eqs. (2) and (3), one may now obtain the threshold amplitudeAτ
peak(f, θ) of a sine grating
Aτpeak(f, θ) = C τ local(f, θ) = 1 CSF(f, θ) (4) whereCτ
local is the local contrast threshold.
D. Psychometric function
The psychometric function Ψ is typically used to relate the parameter of a physical stimulus to the subjective
responses. When applied to contrast sensitivity,Ψ may describe the relationship between the contrast level and the
probability that such contrast can be perceived [20]. In the proposed approach, Daly’s Weibull parametrization [20] is used: Ψ'Cτ ⇤ local ( = 1 − e−(Cτ ∗local)β , (5) whereCτ ⇤
local=Clocal/Clocalτ is the ratio between the locally normalized contrast and its threshold value given in Eq. (4). β is the slope of the psychometric curve; its value is usually obtained by fitting from experimental data. Typical
values forβ range from 1.3 (contrast discrimination) up to 4 (contrast detection) [33]. Moreover, the psychometric
function is typically applied locally, contrary to our model which applies it in the Fourier domain, hence globally.
For both these reasons, it is proposed to use β = 2, a rather low value which provides a large transition area
between invisible and visible domains.
E. Watermark frequency pooling
In this paper, the watermark is embedded into multiple Fourier coefficients, which results into the superimposing
of multiple sine gratingsGk,0 ≤ k < N , with visual frequencies fk and orientationsθk. The CSF solely provides
an estimate for the visibility of a single sine grating; a summation model is thus required to estimate the combined visibility level of all embedded gratings. Numerous models have been proposed [23], [20]. Recent findings suggest
that Minkowski summation [23] may not be adequate [34]; the proposed model will thus use probability summation as in [20].
LetClocalτ ⇤ (fk, θk) denote the contrast threshold ratio of Gk. As in [20], the probabilityΨmark that the watermark is perceived by an observer computes as
Ψmark= 1 −
N −1Y k=0 ⇣
1 − Ψ'Clocalτ ⇤ (fk, θk)(⌘ , (6)
whereΨmark is set according to Eq. (5):1 − e−(1)
β
= 0.632.
Let us now work our way back from the entire watermark to individual gratings. In the proposed approach, it
is assumed that all embedded gratings share the same probability of detectionΨ'Clocalτ ⇤ (fk, θk)
(
= ψ, ∀k ∈ [0, N [.
This probability can be derived from Ψmark by solving Eq. (6):
ψ = 1 − (1 − Ψmark)
1/N
. (7)
The corresponding normalized contrast, which is equal to the optimal grating peak amplitude, may thus be obtained by inversion of the psychometric function (Eq. (5))
Apeak(fk, θk) = Clocalτ (fk, θk) ·
− ln⇣(1 − Ψmark)1/N
⌘+1/β
(8)
IV. MAGNITUDE-PHASE SUBSTITUTIVE EMBEDDING
The proposed embedding technique relies on both the amplitude and the phase Fourier components to modulate a binary watermark. The amplitude allows to adjust the watermark strength whereas the phase holds the binary information.
Let an N-bits binary sequence M1..N be the message to embed. A binary watermark W(i, j), 0 ≤ i < M ,
0 ≤ j < M , is generated from M1..N using a PRNG and arranged into aM × M matrix.
LetFY (u, v) denote the Fourier transform of Ylocalover frequency domainΩ =
,
(u, v) : −Rx/2≤ u <Rx/2, −Ry/2≤ v <Ry/2 ,
whereu and v are the horizontal and vertical frequencies. Let Ω+W =
,
(u, v) : uw≤ u < uw+ M, vw≤ v < vw+ M }
andΩ−
W =
n
(u, v) : (−u, −v) ∈ Ω+Wobe two subsets ofΩ within which the watermark will be embedded; uwand
vware called watermark modulation frequencies. The watermarked spectrum is obtained by substitution as follows:
f FY(u, v) = 8 > > > > > < > > > > > : α/2· A⇤
peak(u, v) · eπ·W(u−uw,v−vw), (u, v) ∈ Ω
+ W α/2· A⇤ peak(u, v) · eπ· W(−u−uw,−v−vw), (u, v) ∈ Ω− W FY(u, v), elsewhere (9)
whereα is a weighting factor that controls the watermark energy relatively to the predicted visibility level. A⇤
peak(u, v)
equals to Apeak
'
f (u, v), θ(u, v)( and denotes the embedded grating’s optimal amplitude obtained in Eq. (8) for
discrete frequency(u, v); f (u, v) and θ(u, v) respectively denote its visual frequency and orientation. In this paper,
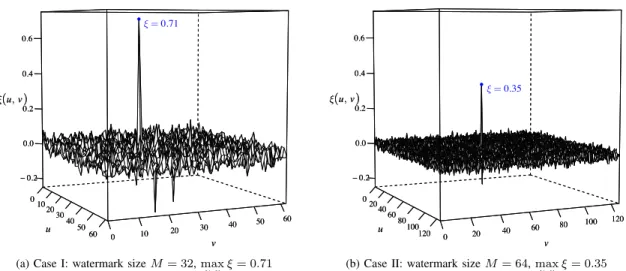
0 10 20 30 40 50 60 0 10 20 30 40 50 60 − 0.2 0.0 0.2 0.4 0.6 u v ξ(u, v) ● 0 10 20 30 40 50 60 0 10 20 30 40 50 60 − 0.2 0.0 0.2 0.4 0.6 u v ξ(u, v) ξ= 0.71
(a) Case I: watermark sizeM = 32, max
u,v ξ = 0.71 0 20 40 60 80 100 120 0 20 40 60 80 100 120 − 0.2 0.0 0.2 0.4 0.6 u v ξ(u, v) ● 0 20 40 60 80 100 120 0 20 40 60 80 100 120 − 0.2 0.0 0.2 0.4 0.6 u v ξ(u, v) ξ= 0.35
(b) Case II: watermark sizeM = 64, max
u,v ξ = 0.35
Fig. 2. Correlation matricesξ(u, v): how the dynamic range of the detection peaks and the surrounding noise varies with the watermark size M .
low sensitivity to watermarked frequencies, which induces high threshold amplitudes, hence high watermark energy.
Lower values for uw andvw were also experimented (20% of the maximum frequency), with similar robustness
performances.
The proposed embedding scheme given in Eq. (9) is a substitutive technique. Here, the choice for amplitude substitution is straightforward as it allows precise control over the energy of the watermark. Moreover, as can be seen in Eq. (9), phase substitution is performed in order to encode the binary watermark information: zeros are
coded as null phases, ones asπ phases. Eventually, the watermarked image is obtained by inverse Fourier transform,
local luminance de-normalization, and transform into the original color space.
V. TWO-STEPS BLIND WATERMARK DETECTION
Let [IsRGB be a supposedly watermarked image; it is assumed to have the same resolution and dimensions as
the original image IsRGB, otherwise it is re-scaled. Let Ylocal(bI) denote its locally normalized luminance map (see
Section III-B).
The proposed detection algorithm is blind, thus neither requires the original imageIsRGBnor the original Fourier
coefficients nor the CSF weighting coefficients. It is performed in two steps. At first, Template Matching (TM)
is used to compute a 2D correlation matrix between the Fourier transform of Ylocal(bI) – denoted cFY – and the
watermark to be detectedW(i, j). Then, outlier detection is performed to assess the presence of matching locations
within the correlation matrix, thus providing a binary decision (zero-bit watermarking).
A. A 2D-correlation algorithm based on template matching
Often, detection schemes are solely based on a correlation coefficient that is compared to a predefined threshold value (e.g. [4], [15]). Detectors based on cross-correlation, cross-covariance and their optimized variants [35]
generally perform better, at the cost of an increased computational load. Most often, however, one-dimensional correlation is performed [16], while the searched pattern is likely to be two-dimensional. Moreover, geometric distortions affect the location and shape of the watermark in the Fourier domain.
Not only does 2D cross-correlation account for the two-dimensional structure of the embedded watermark, but the displacement of its correlation peaks allows to estimate the geometrical distortions undergone by the input image
[
IsRGB. Therefore, it is proposed to perform two-dimensional TM similarly to [14]. Furthermore, no additional
re-synchronisation watermark is required (contrary to [36], [37], [38]); the TM is able to retrieve the watermark as long as it is located, even partially, within the searched area.
Typically, TM involves: (1) a supporting signal S, (2) a searched template T , (3) a search area ΩS and (4) a
matching criterion ρ. In our case, S is derived from cFY:
S(u, v) = 8 > > > < > > > : 7 7 7 cFY(u, v) 7 7 7 , −π/2< arg⇣Fc Y(u, v) ⌘ ≤π/2 −777 cFY(u, v) 7 7 7 , π/2< arg⇣Fc Y(u, v) ⌘ ≤ −π/2 (10)
which encompasses both the Fourier energy and the phase information into a single signed signal. This stands in contrast to Kang et al. [14], who perform phase-only correlation to cope with the large dynamic range of the energy of the watermarked coefficients. In our scenario, this range depends on the CSF; therefore it is rather low, which
allows us to take the energy level into account as well. The template T is derived from the binary watermark W
as follows:
∀(i, j) ∈ [0, M [2,
T (i, j) = A⇤
peak(uw+ i, vw+ j) · '2 · W(i, j) − 1(
(11)
which mapsW’s binary values from {0, 1} to {−1, 1} and accounts for the optimal amplitude A⇤
peakof the embedded
gratings (see Eq. (9)). The search areaΩS is centered around the original watermark modulation frequencies, such
thatΩS =,(u, v) : uw− M < u < uw+ M, vw− M < v < vw+ M }. Finally, Pearson’s correlation coefficient
serves as matching criterionρ, so that the final 2D correlation matrix is given by ξ(u, v) = ρ(T , S(ΩM ⇥M
u,v )), where
(u, v) ∈ ΩS andΩM ⇥Mu,v =
,
(u0, v0) : u ≤ u0 < u + M, v ≤ v0< v + M
.
B. Peak detection
Typically, watermark detection is granted when the correlation score exceeds some given threshold value. It is generally obtained by measuring [15] (experimentally) or estimating [18] (theoretically) the distribution of the values of the correlation matrix under true or false detection scenarios. On the one hand, theoretical approaches are based on statistical analysis, and thus make assumptions that may not hold in practice. On the other hand, experimental thresholds are only valid within the scope of the test signals. In any case, the obtained threshold is constant, and might not be optimal.
In contrast, the dynamic range of a correlation matrix varies with numerous parameters. To illustrate this, the proposed embedding method was used to watermark the Lena image. The watermarked image was then rotated
(1.5◦
) and blurred (Gaussian noise,σ = 2.0) to simulate an attack. Fig. 2 plots the obtained correlation matrices, for
M = 32 (Fig. 2a) and M = 64 (Fig. 2b). Although the detection peaks are obvious in both cases, their amplitude, as well as the amplitude of the surrounding noise, differ significantly. In other words, the detection decision should be driven by the relative difference in amplitude between the correlation peak(s) and the surrounding noise. In Fig. 2, for the same image, the same embedding method, and against the same attack, a fixed detection threshold (e.g. 0.4) would properly detect the correlation peak from Fig. 2a and miss the one from Fig. 2b.
Instead, detection peaks may be seen as outliers. Numerous methods for outlier detection have been proposed in the context of statistical analysis [39]. Grubbs’ test [40] is one such method, both robust and low computational, and solely requires that input correlation matrices are (approximately) normally distributed. This assumption is quite common [18]; Kolmogorov-Smirnov tests further confirmed Gaussianity of the correlation matrices in practical experiments. The proposed detection method features an iterative implementation of Grubbs’ test that removes one outlier value at a time, up to a predefined maximum number of outliers. Alternatively, the performances of the Extreme Studentized Deviate (ESD) test were also investigated and proved to be identical in practical experiments. Such an approach prevents us from fixing the threshold, and adapts the detection to the observed correlation matrix. Moreover, it can be applied to any correlation-based watermark embedding method. Last but not least, the test’s
significance levelαGcan be used to control the tradeoff between detection capacity and false alarm rate. High (resp.
low) values bring higher (resp. lower) True Positive (TP) and False Positive (FP) rates. In terms of complexity,
the proposed method proves to be very fast: with 1024 × 1024 images and 64 × 64 watermarks, both detection
and embedding steps took approximately 0.2s to perform on a mid-2012 Mac Book Pro (2.3 GHz Intel Core i7
processor, 8Gb of RAM), of which 0.26ms was needed to apply Grubbs’ test.
VI. EXPERIMENTAL RESULTS
Most experimental results were obtained from dataset Da containing nine images with resolution 512 × 768,
including six natural color images, two text images and one cartoon color image. They are listed in Table I. When
a larger number of images were required (e.g. threshold selection), a second datasetDb featuring 1000 natural color
images was used. The results are compared to those of [15] and [16]. Datasets, watermarked images and additional
data are available online1. Fig. 3 shows examples of watermarked images at default embedding strengthα
0(α = 1,
see Eq. (9)).
A. Grubbs significance level
In order to determine the optimal significance level for Grubbs’ test, Da’s images were watermarked with the
proposed algorithm. 90 attacks, from the Stirmark benchmark [43], were then applied to both original (hypothesis H0) and watermarked (hypothesis H1) images. Detection was finally run on each resulting image with varying
values forαG. This process was repeated for several watermark sizesM ∈ {16, 32, 64, 128}. The results obtained
for bothH0 and H1 scenarios are shown in Fig. 4.
TABLE I
DATASETDaUSED IN THE EXPERIMENTS
# Name Type Description
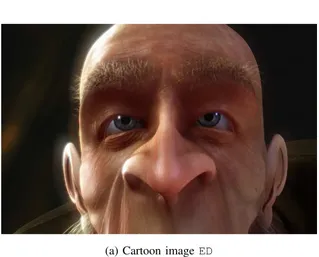
1 ED Cartoon Elephant dream (652ndframe, cropped)
2–7 k03 – k23 Natural Images 3, 7, 15, 20, 21 and 23 from [41] 8 dsc Text Scanned payslip, cropped
9 wilk Text Wilkins text [42]
(a) Cartoon image ED (b) Text image wilk
Fig. 3. Examples of atypical images (cartoon and text): watermarked images.
As can be seen from Fig. 4a, the TP rate slightly varies with αG, and mostly with the size of the embedded
watermark. As for the FP rate, it also increases with the size of the watermark, but exponentially increases with
αG. Therefore, the value ofαG may be adjusted according to the desired false alarm rate. In the next experiments,
we setM to 64 – in order to provide high detection performances – and αG to1e−4 – in order to ensure a low
FP rate (null in experimented images) –.
B. False alarms and true detections
To ensure optimal detection performances, the gap between the detection scores in watermarked images
(hy-pothesis H1) and those in un-marked images (hypothesis H0) need to be as large as possible. Detection scores
were collected on dataset Db (1000 images). Fig. 5 plots the histograms (solid lines) of the detection scores in
both scenarios H0 and H1, along with the fitted Gaussian models (colored areas). As can be seen, H0 and H1
distributions are clearly disjoint in the proposed technique, similarly to [15]. Conversely, Fig. 5 shows that the
distributions of H0 and H1 are much closer in [16], thus resulting in respectively higher and lower FP and TP
60 65 70 75 αG T P r a te (%) 10−7 10−6 10−5 10−4 10−3 10−2 5 ⋅ 10−2 ● ● ● ● ● ● ● ● ● ● ● ● ● ● ● ● ● ● ● ● ● ● ● ● Mark size M = 16 M = 32 M = 64 M = 128
(a) H1: TP detection rate versus αG
0 2 4 6 8 10 αG F P r a te (%) 10−7 10−6 10−5 10−4 10−3 10−2 0.05 ● ● ● ● ● ● ● ● ● ● ● ● ● ● ● ● ● ● ● ● ● ● ● ● Mark size M = 16 M = 32 M = 64 M = 128
(b) H0: FP detection rate versus αG
Fig. 4. True Positive and False Positive detection rates against Stirmark attacks on Da: influence of the watermark size (M ) and αG
C. Robustness to attacks
The robustness of the proposed watermarking algorithm to various attacks was measured with the Stirmark
benchmark [43]. All 90 Stirmark attacks were applied on datasetDa, thus resulting in 810 attacked images. The
robustness is reported in terms of maximum of correlation against experimented attacks; yet, the proposed detection scheme depends on the output of Grubbs’ test (absence/presence of outliers). Therefore, the robustness of the proposed algorithm is reported in terms of percentage of images with a positive detection (detection rate). The obtained results are compared with [15] and [16], where detection rates correspond to the percentage of images for which correlation is higher than the predefined thresholds.
The obtained results are plotted in Fig. 6; details for each attack are available online. For each attack, the dark bar(s) correspond to the best performing algorithm(s) and the light bar(s) to the least performing algorithm(s). Overall, it appears that the proposed technique performs best with an average detection rate of 62.5%, while [15] and [16] respectively reach 52.1% and 53.1%. It should be noted that [16] performs well against most kinds of
0 100 200 300 400 O ccu ren ces P roposed H0 H1 0 10 20 30 40 50 60 O ccu ren ces [16] H0 H1 0 20 40 60 80 100 120 140
Maximum of det ect ion
O ccu ren ces 0.0 0.2 0.4 0.6 0.8 1.0 [15] H0 H1
Fig. 5. H0 (original) versus H1 (marked): comparison with [15] and [16] on dataset Db. Solid lines represent the experimental histograms,
and colored areas represent the fitted Gaussian models.
attacks, although seldom performing best out of the three algorithms. The proposed technique is especially robust to geometric distortions such as rotations (despite the fact that [15] and [16] embed a circular watermark contrary to the proposed approach) and shearing. Still, only [16] withstands severe rotations and cropping. In addition, the proposed technique is nearly as robust as [15] to scaling and filtering operations, and nearly as robust as [16] to cropping. Moreover, it is significantly more robust to random bending, which randomly adds local geometrical distortions, as can be induced by severe P&S effects. On the downside, it appears that the proposed technique is not robust to severe JPEG compression, although this can be explained by the fact that the chosen watermark modulation frequencies are high and thus very likely to be strongly affected by compression. Better robustness against coding artifacts could be achieved by simply shifting the embedded watermark towards lower frequencies. Further information can be found in Table II which lists average detection rates amongst groups of attacks.
VII. SUBJECTIVE EXPERIMENT
Previously, we assessed the robustness of the proposed watermarking scheme at default strength α0 = 1 and
compared it to [15], [16] at suggested strengths. Yet, one may wonder whether these strengths are equivalent in terms of visibility, hence whether previous results are truly comparable. For this reason, a subjective experiment was conducted to determine the optimal strengths at which the watermarks appear at visibility threshold. Section VIII will re-assess the robustness of the compared algorithms at the obtained strengths.
0 20 40 60 80 100
P roposed
Rows & cols removal F ilt ering & sharpening Cropping F lip F MLR J P EG Linear Rat io Reduce colour Rot at ion Rot at ion & scale Scale Shearing Random bend
Det ect ion rat e (%)
0 20 40 60 80 100
[16]
0 20 40 60 80 100
[15]
Fig. 6. Robustness to Stirmark attacks at default embedding strength (α0): detection rates on dataset Da
A. Apparatus and methodology
Observers were seated in a standardized room [44] and watched experimental stimuli on a 40” TV Logic LVM401
TABLE II
STIRMARK BENCHMARK AT DEFAULT EMBEDDING STRENGTH:AVERAGE DETECTION RATESa(%)AMONGST GROUPS OF ATTACKS ON
DATASETDa. Alg. Ov erall Ro ws & cols remo v al Filtering &
sharpening Cropping JPEG Linear Ratio Rotation Rotation
&
scale Scale Shearing Random
bend
Prop. 62.5 100 88.9 29.6 27.8 100 100 51.4 50.0 88.9 94.5 55.6 [16] 53.1 77.8 71.1 33.3 51.9 59.3 76.4 45.8 48.6 64.8 40.7 44.4 [15] 52.1 100 100 0.0 100 92.6 100 11.8 11.1 100 42.6 11.1
a
In each column, the bold value designates the best performing algorithm.
Eye One Pro luminance meter: gamma correction was set to 2.2 and white point to 6600 K. Room illumination was
set to 30 cd.m−2 behind the screen, hence 15% of the perceived screen brightness. Finally, the viewing distance
was set to six times the height of the presented images (as in [6]).
The Two Alternative Forced Choice (2AFC) protocol was used as it is best suited to estimate visibility thresholds. 37 naive observers were recruited to participate to the experiment; screening tests ensured that they had a perfect visual acuity (Snellen chart) and no color deficiencies (Ishihara plates). The 2AFC methodology [45] (chap. 8, p. 258) was used to assess the visibility of the embedded watermarks. Nine anchor images were first presented for the observers to familiarize themselves with the sources and the type of degradations. All 243 images were then shown randomly to each observer. Observers were showed each pair of images (the watermarked image and its original version) during 10 seconds, at which point images were hidden. Observers were forced to vote for either one or the other image they thought was containing the watermark, before they could resume the experiment.
B. Stimuli set
Source images were taken from dataset Da. The nine images were then watermarked with three different
algorithms (proposed, [15] and [16]). This watermarking was repeated for various embedding strengthsαi= wi· α0,
1 ≤ i ≤ 9, where wi are weighting coefficients, and α0 is the default strength.α0= α = 1 according to Eq. (9)
in the proposed algorithm;α0= 0.3 in [15]; finally, α0 is image-adaptive in [16].
In 2AFC experiments, it is especially important to make sure that presented stimuli span the entire visibility range, therefore from completely invisible to severely distorted: the obtained results can thus be best fitted to the expected
psychometric curve. Table III lists the values for wi, whose suitability was assessed by 4 expert observers who
performed the proposed experiment prior to naive observers. In total, 243 images were included in the subjective experiment.
TABLE III
DATASETDa:WATERMARK STRENGTH WEIGHTING COEFFICIENTSwi
Algorithm Img. w1 w2 w3 w4 w5 w6 w7 w8 w9 Proposed 1–7 0.13 0.25 0.50 0.75 1.00 1.50 2.00 4.00 6.00 8–9 0.25 0.50 0.75 1.00 1.25 1.38 1.50 2.00 4.00 [15] 1–7 0.06 0.13 0.19 0.25 0.38 0.50 1.00 2.00 3.00 8–9 0.03 0.06 0.09 0.13 0.15 0.17 0.25 0.50 1.00 [16] 1–7 0.25 0.37 0.50 0.75 1.00 2.00 5.00 10.00 20.00 8–9 0.50 0.75 1.00 2.00 3.00 5.00 7.00 10.00 20.00 C. Analysis
Let V(i, j) denote the vote of the jth observer at theith image: it is equal to 1 if the watermarked image was
correctly identified, and to 0 otherwise. For each of the 243 watermarked images, the percentage of observers
who correctly identified the watermarked image R(i) = 1/N
obs·
PNobs
j=1V(i, j) is called the 2AFC detection rate,
whereNobs= 37 is the number of observers. A clustering-based analysis revealed 6 observers whose votes were
inconsistent, these were removed from subsequent analysis, thus reducingNobs to 31.
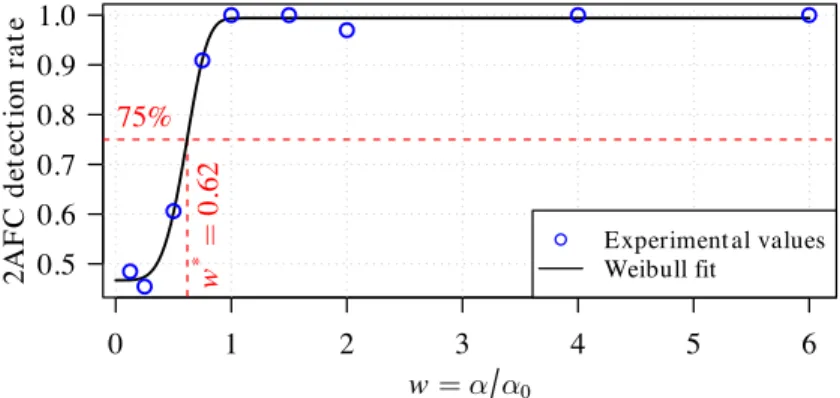
Fig. 7 plots the 2AFC detection ratesR(i) obtained for image ED from dataset Da (circles) against the strength
weighting coefficients wi. Typically, the visibility threshold is assumed to be obtained for a 2AFC score of 75%
[45]. Experimental data are fitted to a sigmoidal Weibull curve to obtain the corresponding psychometric curve,
from which the threshold value and therefore optimal watermarking strengthα⇤
can be obtained. Fig. 7 also shows
the corresponding Weibull fit (solid line), along with the 75% threshold which is reached for strengthα⇤= w⇤· α
0, withw⇤= 0.62. 0 1 2 3 4 5 6 0.5 0.6 0.7 0.8 0.9 1.0 w = α α0 2A F C d et ect ion r a te ● ● ● ● ● ● ● ● ● w * = 0. 62 75% ● Experiment al values Weibull fit
Fig. 7. Proposed method: 2AFC analysis on image ED - dataset Da
optimized strengthsα⇤
= w⇤
· α0. Table IV lists the obtained weightsw⇤. Fig. 8 plotsw⇤’s distributions for each of
the three algorithms; for plotting purposes, the histogram was computed on the binary logarithm ofw⇤
:log2(w
⇤ ) = 0
therefore corresponds toα = α0,log2(w
⇤
) = 1 to α = 2 · α0 andlog2(w
⇤
) = −1 to α = 0.5 · α0. These strengths
α⇤
, in the scope of experimented images, optimize the robustness versus visibility tradeoff. The further away the
default strength α0 is from its optimum α⇤, the more (in)visible is the watermark. When the default strength α0
is greater than its optimumα⇤
(i.e. log2(w⇤) < 0), the watermark is likely to become visible. Conversely, when
α0 is less thanα⇤ (i.e. log2(w⇤) > 0), the watermark is invisible but the strength is not maximized, hence likely
resulting in a loss of robustness.
TABLE IV
DATASETDa:PERCEPTUALLY OPTIMAL STRENGTH WEIGHTING COEFFICIENTSw∗
Algorithm ED k03 k07 k15 k20 k21 k23 dsc wilk Proposed 0.62 2.10 2.98 1.46 0.46 1.96 3.00 0.84 0.55 [15] 0.32 0.48 0.30 0.20 0.18 0.14 0.22 0.14 0.16 [16] 0.88 1.08 0.72 1.01 1.04 0.49 0.96 3.64 1.30 F req u en cy 01 2 34 P roposed F req u en cy 01 23 4 [16] log2(α*α0) F req u en cy − 3 − 2 − 1 0 1 2 012 34 − 3 − 2 − 1 0 1 2 [15] α *= α0
Fig. 8. Distribution of perceptually optimized weightsw∗= α∗/α0on D a.
Fig. 8 shows that algorithm [15] overestimates the watermarking strength by factors ranging from 2 to 8: the embedded watermark is always visible at default strength. The other two algorithms perform much better in this
regard: the distribution of their w⇤
within the[0.46; 3.64] range (Table V). In addition, both of these algorithms are more likely to under-estimate the strength than to over-estimate it, which is preferable as it keeps the watermark invisible.
TABLE V
PERCEPTUALLY OPTIMAL STRENGTH WEIGHTING FACTORS:A SUMMARY.
Algorithm
Optimal weightw∗ Estimation Adequacy (%)
min. max. average over-est. under-est. Proposed 0.46 3.00 1.55 44.4 55.6
[15] 0.14 0.48 0.24 100.0 0.0
[16] 0.49 3.64 1.24 44.4 55.6
Above all, these results tend to show that the proposed HVS model provides good estimates for the visibility threshold. While [16] does not feature any kind of psychophysical model, the embedded watermark also nears the visibility threshold.
VIII. PERFORMANCES AT THE VISIBILITY THRESHOLD
Here, the algorithms are re-evaluated with the obtained perceptually optimized strengthsα⇤
. Images from dataset
Da are thus watermarked usingα⇤ instead ofα0.
A. Robustness to attacks
The robustness benchmark performed in section VI-C was thus rerun atα⇤
. The obtained results are plotted in Fig. 9; again, the darkest bar(s) correspond to the best performing algorithm(s) and the light bar(s) to the least performing algorithm(s). Table VI summarizes average detection rates amongst groups of attacks.
In average, the three algorithms now feature similar robustness percentages: [15] and [16] tie at 65.3%, and the proposed method reaches 63.2%. In the proposed method, the robustness to individual attacks is very similar to the scores obtained at default strength (see Fig. 6). Still, the robustness to filtering, shearing and random bending moderately improves with optimal strengths. In [16], the robustness is significantly improved for all kinds of attacks; it even slightly outperforms our method against JPEG, rotation, and the rotation & scaling. As a consequence, the introduction of a perceptual model into [16] would be very likely to significantly enhance its robustness instead of targeting a given PSNR.
Surprisingly in [15], there is no overall loss in robustness despite the strong reduction in the embedding strength
(α⇤
= 0.24 · α0 in average), but on the contrary a drastic improvement. This can be explained by the fact that the
normalized correlation value in [15] is inversely proportional to the embedding strength. The detection threshold from [15] being fixed, the FP rate is likely to rise.
Besides high detection capabilities, providing stable performances over a rather large range of embedding strengths is also essential. In the proposed technique, variations in the embedding strength do not significantly affect the
0 20 40 60 80 100
P roposed
Rows & cols removal F ilt ering & sharpening Cropping F lip F MLR J P EG Linear Rat io Reduce colour Rot at ion Rot at ion & scale Scale Shearing Random bend
Det ect ion rat e (%)
0 20 40 60 80 100
[16]
0 20 40 60 80 100
[15]
Fig. 9. Robustness to Stirmark attacks at visibility threshold (α∗): detection rates on dataset Da
robustness thanks to the efficiency of the perceptual model that accurately set the watermark strength with respect to its visibility threshold. Conversely in [15] and [16], small variations in the embedding strength strongly affect their robustness, in other words, unstable performances.
TABLE VI
STIRMARK BENCHMARK AT VISIBILITY THRESHOLD:AVERAGE DETECTION RATESa(%)AMONGST GROUPS OF ATTACKS COMPARED TO
BASELINE RATESb Alg. Ov erall Ro ws & cols remo v al Filtering &
sharpening Cropping JPEG Linear Ratio Rotation Rotation
&
scale Scale Shearing Random
bend Prop. 63.2 100 95.0 30.6 30.2 100 100 50.8 50.0 85.4 97.9 62.5 Diff. +0.7 – +6.1 +0.9 +2.4 – – -0.6 – -3.5 +3.5 +6.9 [16] 65.3 95.6 97.8 49.4 40.7 77.8 88.9 61.8 59.0 90.7 51.9 77.8 Diff.+12.2 +17.8 +26.7 +16.1 -11.1 +18.5 +12.5 +16.0 +10.4 +25.9 +11.1 +33.3 [15] 65.3 77.8 100 18.5 100 100 100 33.3 35.4 100 79.6 66.7 Diff.+13.0 -22.2 – +18.5 – +7.4 – +21.5 +24.3 – +37.0 +55.6 a
In each column, the bold value designates the best performing algorithm.
b
Rows “Diff.” indicate the difference in detection rate w.r.t. baseline rates obtained at default embedding strengths – see Table II.
B. Objective quality
Among the three tested algorithms, three different strategies are observed. In the proposed method, a perceptual model automatically adjusts the watermark strength at the visibility threshold. In [15], the embedding strength is fixed and is thus independent of the image content. In [16], the embedding strength is progressively increased, so as to reach a target PSNR of 40 dB. Although it is widely accepted that the PSNR does not reflect image quality, it is still a recurrent quality metric when assessing the visibility of a watermark.
Fig. 10 plots the 2AFC detection rate as a function of the PSNR for image k21. The numerical values next
to each point within the figure gives the detection performances for various wi against 90 Stimark attacks (in
percents). At a constant PSNR of∼ 37.9 dB (see the vertical dimension line A in Fig. 10), the proposed watermark
is invisible (2AFC percentage of 27.3%), while the watermark from [15] is highly visible (2AFC percentage of 93.9%). Focusing now on data points close to the visibility threshold (see the horizontal dimension line B in Fig. 10), it appears that the obtained PSNRs significantly differ between [16] (43.2 db) and the proposed method (29.3 dB), while the watermark in [16] is slightly above the visibility threshold (81.8%) and the proposed watermark is slightly under the threshold (69.7%). In addition, the robustness of the proposed method is higher (62%) than the one of [16] (56%). Therefore, assessing the quality of experimented algorithms, from their PSNRs only, would conflict with the subjective results (ground truth), which in turn would lead to erroneous conclusions.
Concerning the robustness performances, one can see that experimented algorithms behave differently with varying
wi. As it was already seen in section VIII-A, slight variations in embedding strength have a significant impact on the
remain stable across experimented wi; in [16], they are dramatically reduced (from 78% down to 5%) at low wi;
surprisingly in [15], they increase (from 52% up to 88%) with decreasing wi.
P SNR (dB)
2A
F
C
d
et
ect
ion
r
a
te
15
20
25
30
35
40
45
50
0.3
0.4
0.5
0.6
0.7
0.8
0.9
1.0
V isibilit y t hreshold ( 75%) ● ● ● ● ● ● ● ● ● ∆P SNR=− 14 dB, ∆Rob= +6.2 % invisible visibleB
∆ P SN R = − 0. 08 dB , ∆ R ob = − 1 % in v is ib le v is ib leA
60 60 60 63 61 62 62 63 68 5 21 56 75 73 76 77 78 78 88 79 61 70 55 55 54 53 52 ● P roposed [16] [15]Fig. 10. 2AFC visibility percentage versus PSNR for Da’s image k21
This effect was already observed in Sec. VIII-A (see Fig. 9). We further investigated this unexpected behavior and studied the Receiver Operating Characteristics (ROCs) of [15]. The ROC curves obtained for various strengths
w · α0, with w ranging from 0.24 (the average w⇤ across dataset Da in [15]) to 0.14 (the minimum w⇤). While
the ROC curve remains near-optimal for w = 0.24, it quickly declines at lower strengths. At w = 0.14, the TP
rate starts decreasing at high FP rates (10−1) and drops to 0.1 for an FP rate of10−16. Neither in the proposed
technique nor in [16] was this observed.
0. 2 0. 4 0. 6 0. 8 1. 0
False P osit ive rat e
T r u e P os it ive r a t e 10− 16 10− 12 10− 8 10− 4 100 α = 0.14 ⋅ α0 α = 0.18 ⋅ α0 α = 0.2 ⋅ α0 α = 0.24 ⋅ α0
C. Content-dependency: some aspects
Fig. 12 plots, for each algorithm, the average robustness to Stirmark attacks in each image belonging to dataset
Da, at default strength (dashed line) and optimal strength (solid line). In addition, the bars in Fig. 12 plot the
absolute difference in robustness between default and optimal strengths, i.e. the gain or loss in robustness when
switching from α0 to α⇤. It can be seen that the performances are consistent across all images in the proposed
approach. Conversely in [15] and [16], performances are much more inconsistent. This can be explained by the fact that, thanks to the accurate estimation of the visibility threshold provided by the proposed perceptual model, the watermark strength is properly adapted to the visual contents whilst this is not the case in [15] and [16].
R ob u st n es s (%) 0 20 40 60 80 ● ● ● ● ● ● ● ● ● P roposed ● Embedding st rengt h α0 α* R ob u st n es s (%) 0 20 40 60 80 ● ● ● ● ● ● ● ● ● [16] ED k03 k07 k15 k20 k21 k23 dsc wilk Images R ob u st n es s (%) 0 20 40 60 80 ● ● ● ● ● ● ● ● ● [15]
Fig. 12. Average robustness per image for dataset Daat default strengthα0(dashed lines) and optimal strengthα∗(solid line). The bars plot
the corresponding difference in robustness.
IX. ROBUSTNESS TOPRINT& SCAN
In order to validate the proposed scheme in a more realistic scenario, the robustness to Print & Scan (P&S) of
the proposed method was evaluated on seven512 × 512 standard images (Baboon , Barbara, Boats, Fruits,
Lena, Monarch and Peppers denoted as Di
s, 1 ≤ i ≤ 7, in Table VII) and nine images of the Da database
(denoted Dj
a,1 ≤ j ≤ 9). As demonstrated in Sec. VII-C, default (α0) and optimal (α⇤) strengths are close; here,
images were watermarked at α0. To ensure best reproducibility, each watermarked image was first printed five
75, 150, 200 and 300 ppi with a Lexmark CX410de scanner, thus leading to 320 scanned images (images were placed approximately straight on the scanner glass).
TABLE VII
ROBUSTNESS TOPRINT& SCAN:NUMBER OF DETECTED IMAGESaIN FIVE STANDARD512 × 512IMAGES AT SEVERAL SCANNING
RESOLUTIONS Image D1 s D 2 s D 3 s D 4 s D 5 s D 6 s D 7 s D 1 a D 2 a D 3 a D 4 a D 5 a D 6 a D 7 a D 8 a D 9 a Average 75 ppi 0 1 3 4 2 0 1 0 0 0 0 0 2 0 0 0 16.25 % 150 ppi 5 5 5 5 4 5 5 4 5 5 5 5 5 5 0 0 85.00 % 200 ppi 5 5 5 5 4 5 5 3 5 5 5 5 5 5 0 0 83.75 % 300 ppi 5 5 5 5 4 5 5 4 5 5 5 5 5 5 0 0 85.00 % a
Out of five printed & scanned copies.
For each watermarked image and scanning resolution, Table VII lists the number of images (out of five) for which the watermark was detected. As can be seen, the proposed approach is not robust to very low scanning quality (75 ppi), but is robust to slightly higher resolutions 150 to 300 ppi. The detection fails only in text images wilk (see Fig. 3b) and dsc. In comparison, [16] is robust to a combination of print (600 ppi) and scan (150 ppi). The technique in [37] is not robust to scanning resolutions below 600 ppi, while the technique in [14] can withstand resolutions as low as 100 ppi.
An informal 2AFC subjective test was run on the 16 prints with 8 observers. The results show that the watermark remains under the visibility threshold (53.1% of detection).
X. CONCLUSION
This paper proposes a new watermarking method. The watermark, a square patch of coefficients, is embedded within the Fourier domain by substitution of both the magnitude (energy) and the phase (information). The watermark strength is perceptually optimized. The detection features both template matching and outlier detection, the latter being applied to the obtained correlation matrix. The decision is positive if at least one outlier is detected, and negative otherwise.
The proposed method was extensively compared to two competing algorithms from the literature. A subjective experiment was conducted in order to determine the perceptually optimized watermarking strengths (i.e. at the visibility threshold). The performances of both the proposed and the compared algorithms were evaluated twice: at default then perceptually optimal strengths. Experimental results showed that:
1) the proposed perceptual model accurately sets the watermark to its visibility threshold and is stable across all kinds of experimented contents;
2) the template matching accurately locates the watermark for slight geometrical distortions; 3) Grubbs’ test for outlier performs very well both in terms of True Positives and False Positives;
4) the proposed method is robust against Print & Scan and shows state-of-the-art performances. ACKNOWLEDGMENT
This work was partially supported by project OSEO A1202004 R, from which the author MU was funded.
REFERENCES
[1] F. Cayre, C. Fontaine, and T. Furon, “Watermarking security: theory and practice,” IEEE Trans. on Sig. Proc., vol. 53, no. 10, pp. 3976–3987, Oct. 2005.
[2] A. B. Watson, “DCT quantization matrices visually optimized for individual images,” in Proc. SPIE 1913, Human Vision, Visual Processing, and Digital Display IV, vol. 1913, Sep. 1993, pp. 202–216.
[3] A. B. Watson, G. Y. Yang, J. A. Solomon, and J. D. Villasenor, “Visual thresholds for wavelet quantization error,” in Proc. of SPIE, Human Vision and Electronic Imaging, vol. 2657, Apr. 1996, pp. 382–392.
[4] C. I. Podilchuk and W. Zeng, “Image-adaptive watermarking using visual models,” IEEE J. Sel. Areas Commun., vol. 16, no. 4, pp. 525–539, May 1998.
[5] H.-H. Tsai, C.-C. Liu, and K.-C. Wang, “Blind Wavelet-based Image Watermarking Based on HVS and Neural Networks,” in Proc. of the 9th Joint Conference on Information Sciences (JCIS), 2006, pp. 5–8.
[6] C.-H. Chou and K.-C. Liu, “A perceptually tuned watermarking scheme for color images.” IEEE Trans. on Image Process., vol. 19, no. 11, pp. 2966–2982, Nov. 2010.
[7] F. Bartolini, M. Barni, V. Cappellini, and A. Piva, “Mask building for perceptually hiding frequency embedded watermarks,” in Proc. Intl. Conf. on Image Processing 1998. ICIP98, vol. 1, 1998, pp. 450–454.
[8] S. Voloshynovskiy, A. Herrigel, N. Baumgaertner, and T. Pun, “A stochastic approach to content adaptive digital image watermarking,” in Proc. of 3rd Intl. Workshop on Info. Hiding, IH99, 1999, pp. 211–236.
[9] A. Mairgiotis and N. Galatsanos, “Bayesian watermark detection and new perceptual mask based on a spatially weighted Total Variation image prior,” in 2010 IEEE Intl. Workshop on Information Forensics and Security, Dec. 2010, pp. 1–6.
[10] F. Zhang, W. Liu, W. Lin, and K. N. Ngan, “Spread spectrum image watermarking based on perceptual quality metric.” IEEE Trans. on Image Process., vol. 20, no. 11, pp. 3207–18, Nov. 2011.
[11] P. B. Nguyen, M. Luong, and A. Beghdadi, “Statistical Analysis of Image Quality Metrics for Watermark Transparency Assessment,” in Advances in Multimedia Information Processing - PCM 2010, 2010, vol. 6297, pp. 685–696.
[12] J. O’Ruanaidh and T. Pun, “Rotation, scale and translation invariant digital image watermarking,” in Proceedings of International Conference on Image Processing, vol. 1. IEEE, 1997, pp. 536–539.
[13] C. Y. Lin, M. Wu, J. A. Bloom, I. J. Cox, M. L. Miller, and Y. M. Lui, “Rotation, scale, and translation resilient watermarking for images.” IEEE Trans. on Image Process., vol. 10, no. 5, pp. 767–82, Jan. 2001.
[14] X. Kang, J. Huang, and W. Zeng, “Efficient General Print-Scanning Resilient Data Hiding Based on Uniform Log-Polar Mapping,” IEEE Trans. Inf. Forensics Security, vol. 5, no. 1, pp. 1–12, Mar. 2010.
[15] V. Solachidis and I. Pitas, “Circularly symmetric watermark embedding in 2-D DFT domain.” IEEE Trans. Image Process., vol. 10(11), pp. 1741–53, Jan. 2001.
[16] A. Poljicak, M. Mandic, and D. Agic, “Discrete Fourier transformbased watermarking method with an optimal implementation radius,” Journal of Electronic Imaging, vol. 20, no. 3, pp. 033 008–1–8, Jul. 2011.
[17] A. Piva, M. Barni, F. Bartolini, and V. Cappellini, “Threshold Selection for Correlation-Based Watermark Detection,” in Proc. COST254 Workshop on Intelligent Communications, 1998, pp. 5—-6.
[18] M. Barni, F. Bartolini, and A. Piva, “Improved wavelet-based watermarking through pixel-wise masking.” IEEE Trans. Image Process., vol. 10, no. 5, pp. 783–91, Jan. 2001.
[19] P. Barten, “Evaluation of subjective image quality with the square-root integral method,” JOSA A, vol. 7, no. 10, pp. 2024–2031, 1990. [20] S. J. Daly, “Visible differences predictor: an algorithm for the assessment of image fidelity,” in Digital Images and Human Vision, A. B.
Watson, Ed. The MIT Press, Aug. 1993, pp. 179–206.
[22] A. B. Watson and J. A. Solomon, “Model of visual contrast gain control and pattern masking.” J. Opt. Soc. Am. A, Optics, image science, and vision, vol. 14, no. 9, pp. 2379–91, Sep. 1997.
[23] A. B. Watson and A. J. Ahumada, “A standard model for foveal detection of spatial contrast ModelFest experiment,” Journal of vision, vol. 5, pp. 717–740, 2005.
[24] L. Zhang-ge, “Numerical Observers for the Objective Quality Assessment of Medical Images,” Ph.D. dissertation, LUNAM University, Universit´e de Nantes, 2012.
[25] ITU-R BT.2022, “General viewing conditions for subjective assessment of quality of SDTV and HDTV television pictures on flat panel displays BT Series Broadcasting service,” Tech. Rep., 2012.
[26] IEC-61966-2-1:1999, “Multimedia systems and equipment - Colour measurement and management - Part 2-1: Colour management - Default RGB colour space - sRGB,” International Electrotechnical Commission (IEC), Tech. Rep., 1999.
[27] A. A. Michelson and H. B. Lemon, Studies in Optics. University of Chicago Science Series, University of Chicago Press, 1927. [28] R. A. Frazor and W. S. Geisler, “Local luminance and contrast in natural images.” Vision Res., vol. 46(10), pp. 1585–98, May 2006. [29] P. Barten, Contrast sensitivity of the human eye and its effect on image quality. SPIE Press, 1999.
[30] A. Roka, P. Galambos, and P. Baranyi, “Contrast sensitivity model of the human eye,” in 2009 4th Intl. Symposium on Computational Intelligence and Intelligent Informatics, vol. 1. IEEE, 2009, pp. 93–99.
[31] J. Mannos and D. Sakrison, “The effects of a visual fidelity criterion of the encoding of images,” IEEE Trans. Inf. Theory, vol. 20, no. 4, pp. 525–536, Jul. 1974.
[32] P. Barten, “Formula for the contrast sensitivity of the human eye,” Electronic Imaging 2004, vol. 5294, pp. 231–238, 2003.
[33] S. a. Wallis, D. H. Baker, T. S. Meese, and M. a. Georgeson, “The slope of the psychometric function and non-stationarity of thresholds in spatiotemporal contrast vision.” Vision Res., vol. 76, pp. 1–10, 2013.
[34] T. S. Meese and R. J. Summers, “Theory and data for area summation of contrast with and without uncertainty: evidence for a noisy energy model.” Journal of vision, vol. 12, no. 11, pp. 1–28, Jan. 2012.
[35] J. P. Lewis, “Fast normalized cross-correlation,” in Vision interface, 1995, pp. 120–123.
[36] K. Solanki, U. Madhow, B. Manjunath, and S. Chandrasekaran, “Estimating and undoing rotation for print-scan resilient data hiding,” in IEEE Intl. Conf. on Image Process., 2004, vol. 1, 2004, pp. 39–42.
[37] K. Solanki, U. Madhow, B. S. Manjunath, S. Chandrasekaran, and I. El-Khalil, “‘Print and Scan’ Resilient Data Hiding in Images,” IEEE Trans. Inf. Forensics Security, vol. 1, no. 4, pp. 464–478, Dec. 2006.
[38] S. Pereira, J. O’Ruanaidh, F. Deguillaume, G. Csurka, and T. Pun, “Template based recovery of Fourier-based watermarks using log-polar and log-log maps,” in Proc. IEEE International Conference on Multimedia Computing and Systems, vol. 1, 1999, pp. 870–874. [39] V. Hodge and J. Austin, “A Survey of Outlier Detection Methodologies,” Artificial Intelligence Review, vol. 22, no. 2, pp. 85–126, Oct.
2004.
[40] F. E. Grubbs, “Procedures for detecting outlying observations in samples,” Technometrics, vol. 11, no. 1, pp. 1–21, 1969. [41] R. Franzen, “Kodak Lossless True Color Image Suite,” 2004.
[42] A. J. Wilkins, R. J. Jeanes, P. D. Pumfrey, and M. Laskier, “Rate of Reading Test: its reliability, and its validity in the assessment of the effects of coloured overlays.” Ophthalmic & physiological optics : the journal of the British College of Ophthalmic Opticians (Optometrists), vol. 16, no. 6, pp. 491–7, Dec. 1996.
[43] F. A. Petitcolas, R. J. Anderson, and M. G. Kuhn, “Attacks on copyright marking systems,” Information Hiding, vol. 1525, pp. 218–238, 1998.
[44] ITU-R-BT.500-11, “Methodology for the subjective assessment of the quality of television pictures,” Intl. Telecom. Union, Tech. Rep., 2004.
[45] I. J. Cox, M. L. Miller, J. A. Bloom, J. Fridrich, and T. Kalker, Digital Watermarking and Steganography, 2nd ed. San Francisco, CA, USA: The Morgan Kaufmann Series in Mult. Inf. and Sys., 2007.
Matthieu Urvoy received the Eng. degree in Electronics and Computer Engineering from the INSA in Rennes (France) and the M.Sc. degree in Electronics and Electrical Engineering from Strathclyde University (Glasgow, Scotland) in 2007. He received the Ph.D. degree on Signal and Image Processing at the University of Rennes in 2011. Since then, he is a post-doctoral fellow at Polytech’Nantes (IRCCyN lab). His research interests include video compression, human vision, 3D QoE and watermarking.
Dalila Goudia was born in Algeria in 1970. She received M.Sc. degree in Software Engineering and MS degree in Electronics, Vision and Pattern Recognition from the University of Science and Technology of Oran, Algeria, in 1994 and 2006 respectively. She also received the Ph.D. degree in Computer Science in 2011 from the University of Montpellier 2, France. Her current research interests include image processing, compression, and digital watermarking.
Florent Autrusseau received the M.Sc. degree in Image Processing from the University of Nantes (France) in 1999 and the Ph.D. degree on digital watermarking and perceptual modeling in 2002 at the IRCCyN lab in Nantes. In 2003–2004, he was a post-doctoral fellow at the Visual Science Labs in the University of Chicago. Since 2004, he is a research engineer at Polytech’Nantes, IRCCyN lab. His research interests include digital watermarking, HVS models, Color perception and Image analysis.


![Fig. 5. H 0 (original) versus H 1 (marked): comparison with [15] and [16] on dataset D b](https://thumb-eu.123doks.com/thumbv2/123doknet/8149476.273558/14.918.220.700.111.524/fig-h-original-versus-h-marked-comparison-dataset.webp)