T
T
H
H
È
È
S
S
E
E
En vue de l'obtention duD
D
O
O
C
C
T
T
O
O
R
R
A
A
T
T
D
D
E
E
L
L
’
’
U
U
N
N
I
I
V
V
E
E
R
R
S
S
I
I
T
T
É
É
D
D
E
E
T
T
O
O
U
U
L
L
O
O
U
U
S
S
E
E
Délivré par l'Université Toulouse III - Paul Sabatieren cotutelle avec l'Universitat de València, Espagne
Discipline ou spécialité : Télédétection
Présentée et soutenue par María del Carmen González Sanpedro Le 01-12-2008
Titre : Optical and Radar Remote Sensing applied to agricultural areas in Europe.
Télédétection radar et optique appliquée aux régions agricoles en Europe.
JURY
José Antonio Sobrino Rodriguez, Professeur de l’Universitat de València (Président de jury) Francesco Mattia, Chercheur CNR (Examinateur)
Jean-Philippe Gastellu-Etchegorry, Professeur UPS Toulouse III (Directeur de thèse) Thuy Le Toan, Ingenieur de recherche CNRS au CESBIO (Directeur de thèse) José F. Moreno Méndez, Professeur de l’Universitat de València (Directeur de thèse)
Ecole doctorale : Sciences de l'univers de l'environnement et de l'espace Unité de recherche : CESBIO
Directeur(s) de Thèse : Jean-Philippe Gastellu-Etchegorry, Thuy Le Toan et José F. Moreno Rapporteurs : Martine Guérif (Directeur de Recherche, INRA) et José Antonio Sobrino (Professeur
ACKNOWLEDGEMENTS
I would like to thank my advisors, Dr. Tuy Le Toan and Dr. José Moreno for giving me the opportunity of working with them at CESBIO and at the University of Valencia respectively, as well as for helping me to accomplish this thesis. I am also very grateful with Dr. Martine Guèrif, Dr. Francesco Mattia, and Dr. José Sobrino who, as reviewers of my report, provided careful corrections.
I am extremely grateful with my friends and colleagues at CESBIO. In particular I would like to mention Dr. Laurent Kergoat for his priceless scientific discussions and encouragement.
Pendant cette étape dans le monde de la recherche j’ai eu la chance de rencontrer des personnes qui ont devenu très importantes pour moi. Je tiens donc à remercier toutes ces personnes et à leur transmetre ici toute mon amitié. Sans aucun doute, vous avez été le meilleur de cette étape.
Au CESBIO je remercie spécialement à Manuela Grippa (et à la famiglia Balochi au complet: Andrea, Mattia et Gaia). Également je remercie à Nicolas Delbart, Claire Gruhier, Silvia Juglea, Iskander Benhadj, Arnaud Mialon, Philippe Richaume, Olivier Merlin, Alex Bouvet, Frederic Frappart et Ahmad Albitar. Merci aussi à Julie Gardelle, qui a eu le courage de partager un bureau avec moi a la fin de ma thèse (bonne chance pour la suite!). Je remercie aussi d’autres amis qui ont passé par ce laboratoire il y a quelque temps: Erick Lopez, Daniel Kristoff (et Andrea “la otra”), Joost Hodges, Sergio Vicente, Alberto García, Julianne l’Hermitte, Yannick Le Page, Mª José Escorihuela, Sylvie Duthoit, Laurent Coret, et Ferran Gascon. J’ai de très bons souvenirs du temps passé à Toulouse avec Lizbeth Guijarro qui sera toujours une bonne amie, même si elle est de l’autre côté de l’Atlantique. Un grand merci aussi aux permanents et “quasi-permanets” du CESBIO qui ont toujours été très aimables avec moi, spécialement je veux remercier à François Cabot (est-ce que tu sais ou il est Laurent?), Olivier Hagolle, Valérie Le Dantec, Valérie Demarez, Philippe Maisongrande (vive le Tour!), Pierre Hiernaux, Eric Mougin, et encore à Laurent et à Thuy.
Je pense aussi tout particulièrement à Françoise Guichard, toujours très douce et très gentille avec moi.
También quiero agradecer de corazón a quienes han sido mis compañeros de laboratorio en la Universidad de Valencia y con quienes compartí muchas risas: Luis Alonso (por los momentos frikis), José Carlos García, Carlos Cuñat, José Manuel Martínez, Luis Guanter, Juan Carlos Fortea y Gloria Fernández. También quiero agradecer muy especialmente a Siham Lanjeri todo su cariño y amistad. Por supuesto que no puedo olvidar tampoco a otros compañeros del departamento como Fernando Camacho. Tengo también un recuerdo para los buenos ratos pasados allá bajo el sol de la Mancha junto con Michael Whiting, Bob Zomer, y la lista es demasiado larga.., (gracias!). Y a mis compañeros de la facultad: Ana Campos, Antonio Pérez, Oscar Soler, Javier Cervera, José Juan Esteve, Julio Trujillo, María José Yusá, muy particularmente a Víctor Estellés, quien siempre supo ser un gran amigo incluso a distancia.
Tengo un recuerdo muy bueno de mis amigas en Valencia: Laura, Pilar, Maribel, Meriam. Finalmente, quiero agradeceros a vosotras: Desirée, Carmen María, Rosaura, Ana, María Jesús, Rosa y Maite por vuestra paciencia y todas las veces que os dije “tengo que trabajar”.
A mis padres.
ABSTRACT
The global population growth, as well as the social and economic importance that the agricultural sector has in many regions of the world, makes it very important to develop methods to monitor the status of crops, to improve their management, as well as to be able to make early estimates of the agricultural production. One of the main causes of uncertainty in the production of crops is due to the weather, for example, in arid and semiarid regions of the world, periods of drought can generate big losses in agricultural production, which may result in famine. Thus, FAO, during their summit in June 2008, stressed the need to increase agricultural production as a measure to strengthen food security and reduce malnutrition in the world.
Concern for increasing crop production, has generated, during the last decades, significant changes in agricultural techniques. For example, there has been a widespread use of pesticides, genetically modified crops, as well as an increase in intensive farming. In turn, the market influences crop rotations, and as a consequence, changes in the spatial distribution of crops are very common. Therefore, in order to make estimates of agricultural production, it is also necessary to map regularly the crop fields, as well as their state of development.
The aim of this thesis is to develop methods based on remote sensing data, in the radar and optical spectral regions, in order to monitor crops, as well as a to map them. The results of this thesis can be combined with other techniques, especially with models of crop growth, to improve the prediction of crops.
The optical remote sensing methods for classifying and for the cartography of crops are well established and can be considered almost operational. The disadvantage of the methods based on optical data is that they are not applicable to regions of the world where cloud coverage is frequent. In such cases, the use of radar data is more advisable. However, the classification methods using radar data are not as well established as the optical ones, therefore, there is a need for more scientific studies in this field. As a consequence, this thesis focuses on the classification of crops using radar data, particularly using AIRSAR airborne data and ASAR satellite data.
The monitoring of crops by remote sensing is based on the estimation of biophysical parameters and their evolution over time. These parameters are, among others, LAI (leaf area index), chlorophyll and biomass. In this thesis, satellite data from LANSAT-TM are used for the inversion of LAI, and ENVISAT-MERIS data for estimating LAI and chlorophyll. Finally, ENVISAT-ASAR radar data are used to investigate its potential in the estimation of the biomass of cereals.
Chapter 1 of the thesis introduces the context of this study and its scientific objectives. Chapter 2 presents the theoretical basis of optical remote sensing.
Chapter 3 is dedicated to the inversion of LAI in the region of Barrax (Castilla-La Mancha, Spain) using 12 LANDSAT-TM images acquired during the same agricultural season. The LAI is calculated using LUTs (Look Up Tables) to invert the radiative transfer model SAIL, which is coupled to the model of leaf reflectance PROSPECT. The results are validated with experimental measurements acquired during the field campaign ESA SPARC-2003, showing a good correlation.
Chapter 4 proposes a method to invert, at the same time, LAI and chlorophyll data from ENVISAT-MERIS. This method involves an inversion of the same model, PROSPECT + SAIL, which was used in Chapter 3, but with the special addition of a temporal constraint. Thus, instead of inverting a single value of LAI and chlorophyll for each date, a curve for the entire crop cycle is inverted. This method seeks to take as much information as possible from the temporal dimension of the data. The results show that the multitemporal method works better than the inversions on a single date. However, the inversion of chlorophyll still requires further study.
Chapter 5 introduces the concepts related to the radar remote sensing, which will be used along the second part of this thesis.
In Chapter 6 a method of hierarchical classification of crops is developed. It uses polarimetric data in C band, from the airborne instrument AIRSAR. The method is applied to images in Flevoland (Netherland) and is validated with field observations.
Chapter 7 investigates the use of ENVISAT-ASAR data for agricultural applications in the region of Toulouse. The first part discusses the possibilities for classification of crops. The second part investigates the potential of the polarization ratio HH / VV to estimate the biomass of wheat. It is confirmed that there is a clear link between this ratio and the biomass of wheat, however, this relationship depends on many other factors and seems to be dependent on the experimental site. Therefore, more studies needs to be conducted.
The findings of this study, as well as their prospects are outlined in greater detail in Chapter 8.
To sum up, this thesis investigates the use of optical and radar remote sensing to the monitoring of agricultural areas. Four different instruments, three on board satellites (LANDSAT-TM, ENVISAT-MERIS, and ENVISAT-ASAR) and 1 airborne instrument (AIRSAR) are used, in three areas of study in Europe (Barrax, Toulouse and Flevoland), as well as an important number of field measurements. This study highlights the importance of the multi-temporal aspect in agricultural studies using remote sensing.
RESUMÉ
À cause de l'importance sociale et économique que le secteur agricole a dans des nombreuses régions du monde, il est très important de développer des méthodes pour surveiller l'état des cultures, pour améliorer leur gestion et pour pouvoir faire une estimation précoce de la production agricole. L'une des principales causes d'incertitude dans la production des cultures est due aux conditions météorologiques, par exemple dans les zones arides et semi-arides du monde, des longues périodes de sécheresse peuvent générer des grandes pertes dans la production agricole, ce qui, parfois, provoque des famines. Ainsi, la FAO, au cours du sommet de juin 2008, a souligné la nécessité d'accroître la production agricole comme une mesure visant à renforcer la sécurité alimentaire et réduire la malnutrition dans le monde.
Le souci d'améliorer la production agricole a suscité, au cours des dernières décennies, des changements importants dans les techniques agricoles. Par exemple, il y a eu une utilisation généralisée des produits phytosanitaires, une augmentation des cultures génétiquement modifiées, ainsi qu'une augmentation de l'agriculture intensive. Quant à, la rotation des cultures, elle est de plus en plus influencée par le marché. En conséquence, des changements dans la répartition spatiale des cultures sont très fréquents. Ainsi, afin de faire des estimations de la production agricole, il est nécessaire de pouvoir produire, régulièrement des cartes des cultures ainsi que leur état de développement.
L'objectif de cette thèse est de développer des méthodes basées sur des données de télédétection, radar et optiques, afin d'assurer le suivi des cultures, ainsi que leur cartographie. Les résultats de cette thèse pourront être combinés avec d'autres techniques, notamment avec des modèles de croissance des cultures, pour améliorer la prévision des récoltes.
Les méthodes de télédétection optique pour classifier et cartographier les cultures sont bien établies et peuvent être considérées comme quasi opérationnelles, mais leur inconvénient est qu'elles ne sont pas applicables à des régions du monde où la couverture nuageuse est fréquente. Dans ce cas, l'utilisation des données radar est plus souhaitable. Toutefois, les méthodes de classification basées sur des données radar n’étant pas aussi bien établies que celles qui sont basées sur l'optique, il y a donc un besoin de plus d'études scientifiques dans ce domaine. En conséquence, cette thèse porte sur la classification des cultures utilisant des données radar, en particulier des données aéroportées AIRSAR et de données ASAR du satellite ENVISAT.
La surveillance des cultures par télédétection est basée sur l'estimation des paramètres biophysiques et de leur évolution au fil du temps. Ces paramètres sont, entre autres, le LAI (indice de surface foliaire), la chlorophylle et la biomasse. Dans cette thèse, les données satellitaires LANSAT-TM sont utilisées pour l'inversion du LAI et les données ENVISAT-MERIS sont utilisées pour l'estimation combinée du LAI et de la chlorophylle. Enfin, le potentiel
des données radar ENVISAT ASAR pour étudier leur potentiel dans l'estimation de la biomasse des céréales est évalué.
Le premier chapitre de la thèse présente le contexte de cette étude et ses objectifs scientifiques.
Le deuxième chapitre présente les fondements théoriques de la télédétection optique. Le troisième chapitre est consacré à l'inversion du LAI dans la région de Barrax (Castilla-La Mancha, Espagne) à l'aide de 12 images LANDSAT-TM acquises au cours du même cycle de culture. Le LAI est calculé en utilisant des LUTs (Look Up Tables) pour inverser le modèle de transfert radiatif SAIL, qui est couplé au modèle de réflexion des feuilles PROSPECT. Les résultats sont validés avec des mesures expérimentales acquises au cours de la campagne sur le terrain ESA SPARC-2003, montrant une bonne corrélation.
Le Chapitre 4 propose une méthode inverser à la fois le LAI et la chlorophylle avec les données ENVISAT-MERIS. Cette méthode implique une inversion du même modèle, PROSPECT + SAIL, utilisé dans le Chapitre 3, mais avec une contrainte temporelle. Ainsi, au lieu d'inverser une valeur unique du LAI et de la chlorophylle pour chaque date, une courbe pour l'ensemble du cycle de culture est inversée. Cette méthode cherche à tirer parti, autant que possible, de la dimension temporelle des données. Les résultats montrent que la méthode multitemporelle fonctionne mieux que les inversions sur une date unique. Toutefois, l'inversion de la chlorophylle nécessite encore une étude plus approfondie.
Le Chapitre 5 présente les concepts liés à la télédétection radar, qui seront utilisés le long de la deuxième partie de cette thèse.
Dans le Chapitre 6, une méthode de classification hiérarchique des cultures est développée. Elle utilise des données polarimétriques en bande C de l'instrument aéroporté AIRSAR. La méthode est appliquée à des images dans le Flevoland (Pays-Bas) et est validée avec des observations sur le terrain.
Le Chapitre 7 examine l'utilisation des données ENVISAT ASAR pour les applications agricoles dans la région de Toulouse. La première partie examine les possibilités offertes pour obtenir une classification des cultures. La deuxième partie étudie le potentiel du rapport de polarisation HH / VV pour estimer la biomasse du blé. Il est confirmé qu'il existe un lien entre ce rapport et la biomasse du blé, cependant, cette relation dépend de nombreux facteurs et semble être dépendante du site d’expérimentation. Par conséquent, une étude plus approfondie est nécessaire.
Les conclusions de cette étude, ainsi que ses perspectives, sont décrites plus en détail dans le Chapitre 8.
En résumé, la thèse porte sur la télédétection optique et radar pour le suivi des zones agricoles. Quatre instruments différents, 3 satellitaires (LANDSAT-TM, ENVISAT-MERIS,
ENVISAT-ASAR) et 1 aéroporté (AIRSAR) sont utilisés dans trois régions d'étude en Europe (Barrax, Toulouse et Flevoland), ainsi qu'un nombre important de mesures sur le terrain. Cette étude souligne l'importance de l'aspect multitemporel dans les études agricoles au moyen de la télédétection.
RESUMEN
El aumento de la población mundial, así como la importancia social y económica que el sector agrícola tiene en muchas regiones del mundo, hace que sea muy importante desarrollar métodos que permitan hacer un seguimiento del estado de los cultivos, mejorar la gestión de los mismos, así como poder realizar una estimación temprana de la producción. La principal causa de incertidumbre en la producción de las cosechas es debida a las condiciones meteorológicas, por ejemplo, en las regiones áridas y semiáridas del mundo los períodos de sequía generan grandes pérdidas en la producción agrícola, la cuales se traducen en hambrunas. Así, la FAO, durante su cumbre de Junio 2008, insistió en la necesidad de aumentar a producción agrícola como una medida para reforzar la seguridad alimentaria y reducir la desnutrición en el mundo.
La preocupación por aumentar la producción de cultivos, ha generado, durante las últimas décadas, importantes cambios en las técnicas agrícolas. Por ejemplo, se ha producido un uso generalizado de productos fitosanirios, de cultivos modificados genéticamente, así como un aumento de la agricultura intensiva. A su vez, la rotación de cultivos está cada vez más influenciada por el mercado, siendo los cambios en la distribución espacial de los cultivos muy frecuentes. Por lo tanto, para poder hacer estimaciones de la producción agrícola, es necesario producir periódicamente mapas de cultivos, así como cartografiar su estado de desarrollo.
La presente tesis doctoral tiene como objetivo desarrollar métodos basados en datos de teledetección, en la región del óptico y en la región del radar, que permitan realizar un seguimiento de los cultivos, así como una cartografía de los mismos. Los resultados de esta tesis pueden combinarse con otras técnicas, especialmente con los modelos de crecimiento de cultivo, para mejorar la predicción de las cosechas.
Los métodos de teledetección para la clasificación y la cartografía de cultivos utilizando datos en la región del óptico están bien establecidos y pueden considerarse casi operacionales. La desventaja de estos estudios basados en datos ópticos es que no pueden aplicarse a regiones donde la cobertura nubosa es frecuente. En esos casos, la utilización de datos radar es más recomendable. Sin embargo, los métodos de clasificación utilizando datos radar no están tan bien establecidos y es necesario realizar más estudios científicos en este campo. Es por ello, que esta tesis se centra en la clasificación de cultivos mediante datos radar, concretamente datos aerotransportados AIRSAR y datos ASAR del satélite ENVISAT.
El seguimiento de los cultivos mediante teledetección se basa en la estimación de parámetros biofísicos y su evolución en el tiempo. Estos parámetros son, entre otros, LAI (índice de área foliar), clorofila y biomasa. En esta tesis se han utilizado datos del satélite LANSAT-TM para la inversión de LAI, y datos ENVISAT-MERIS para la estimación de LAI y clorofila.
Finalmente, se ha investigado el uso de datos radar ENVISAT-ASAR para investigar su potencial en la estimación de la biomasa de los cereales.
El Capítulo 1 de la tesis presenta el contexto y los objetivos científicos de este estudio. El Capítulo 2 presenta las bases teóricas sobre la teledetección en el óptico.
El Capítulo 3 está dedicado a la inversión de LAI en la región de Barrax, en Castilla-La Mancha, utilizando 12 imágenes LANDSAT-TM adquiridas durante la misma temporada agrícola. El LAI se ha calculado utilizando LUTs (Look Up Tables) para invertir el modelo de transferencia radiativa SAIL acoplado al modelo de reflectividad de hoja PROSPECT. Los resultados se han validado con medidas experimentales adquiridas durante la campaña de campo de ESA, SPARC-2003, mostrando una muy buena correlación.
El Capítulo 4 propone un método para invertir a la vez LAI y clorofila a partir de datos ENVISAT-MERIS. Este método consiste en una inversión de mismo modelo PROSPECT+SAIL que se utilizó en el Capítulo 3, pero con la particularidad de que se añade una ligadura temporal. De esta forma, en vez de invertir un único valor de LAI y clorofila para cada fecha, se invierte una curva válida para todo el ciclo del cultivo. Este método intenta aprovechar al máximo la dimensión temporal de los datos. Los resultados obtenidos muestran que el método multitemporal da mejores resultados que las inversiones fecha a fecha. Sin embargo, la inversión de clorofila todavía requiere más estudio.
El Capítulo 5 introduce los conceptos relacionados con la teledetección radar que se manejan a lo largo de la segunda parte de esta tesis.
En el Capítulo 6 se ha desarrollado un método de clasificación de cultivos jerarquizado, que utiliza datos polarimétricos en banda C, del instrumento aerotransportado AIRSAR. El método se ha aplicado a imágenes en Flevoland (Paises Bajos) y se ha validado con observaciones de campo.
El Capítulo 7 se investiga el uso de los datos ENVISAT-ASAR para aplicaciones agrícolas en la región de Toulouse. En la primera parte se analizan las posibilidades para la clasificación de cultivos. Finalmente se investiga el potencial del cociente de polarizaciones HH/VV para estimar la biomasa del trigo. Se ha confirmado que hay una relación clara entre este cociente y la biomasa del trigo, sin embargo, dicha relación depende de muchos otros factores y parece ser dependiente del lugar de estudio. Por lo tanto, los algoritmos de inversión necesitan mucho más análisis.
Las conclusiones de este estudio, así como sus perspectivas, están expuestas con mayor detalle en el Capítulo 8.
En resumen, esta tesis doctoral ilustra las aplicaciones de la teledetección en el óptico y en el radar para el estudio de zonas agrícolas. Se han utilizado cuatro instrumentos distintos, tres a bordo de satélites (LANDSAT-TM, ENVISAT-MERIS, ENVISAT-ASAR y uno
aerotransportado (AIRSAR) en tres zonas de estudio europeas (Barrax, Toulouse y Flevoland), así como una serie importante de medidas de campo. Este estudio pone de manifiesto la importancia del aspecto multitemporal en los estudios agrícolas mediante teledetección.
TABLE OF CONTENTS
Acknowledgements. i Abstract. iii Resumé. v Resumen. ixTable of contents. xiii
CHAPTER 1: Introduction.
1.1 Scientific context. 1
1.1.1 Need for an agricultural monitoring. 1
1.1.2 Crop monitoring. 3
1.2 The role of remote sensing in agricultural studies. 6
1.3 Objectives of this study. 9
1.4 Organisation of the thesis report. 10
PART-I
CHAPTER 2: Biophysical parameters and optical data.
2.1 Physical definitions. 13
2.2 Optical remote sensing system. 14
2.3 Satellite and sensor characteristics. 16
2.4 The atmospheric effect and its correction. 19
2.5 Vegetation reflectance and biophysical parameters. 22
2.5.1 Leaf optical properties. 22
2.5.2 Leaf models. 25
2.5.3 The PROSPECT model. 25
2.5.4 The SAIL model for canopy reflectance. 28
2.5.5 Model inversion. 34
2.6 Current capabilities to retrieve biophysical parameters. 35
CHAPTER 3: Seasonal variations of leaf area index of agricultural fields
retrieved from Landsat data.
3.1 Introduction. 40
3.2 Site description and datasets. 41
3.2.1 Site description. 41
3.2.2 Ground biophysical measurements. 41
3.2.3 Remote sensing data. 44
3.3 Methodology. 45
3.4 Results and validation. 49
CHAPTER 4: LAI and Chlorophyll retrieval in agricultural areas using
multi-temporal optical data.
4.1 Description of the methodology with multi-temporal constraints. 66
4.2 Test with simulated data. 68
4.3 Analysis of the first results with MERIS data. 71
4.3.1 Selection of “pure” vegetation pixels. 72
4.3.2 Background soils. 72
4.3.3 Date-by-date inversions 73
4.3.4 Results with the multi-temporal method. 77
4.4 Discussion and perspectives. 86
PART-II
CHAPTER 5: Biophysical parameters and radar remote sensing.
5.1 Active Radar systems in Earth Observation. 87
5.1.1 Concepts related to a SAR system. 93
5.2 Radar equation, backscattering cross-section and backscattering coefficient. 95 5.3 Backscattering measurements used to describe polarimetric properties. 96
5.4 The speckle phenomenon in a SAR image. 96
5.5 Scattering mechanisms in natural surfaces. 99
5.6 Surface scattering. 100
5.7 Volume scattering. 101
5.8 Scattering of agricultural crops. 104
5.8.1 Radar characteristics affecting the scattering of crops. 105
5.8.2 Characteristics crops 107
CHAPTER 6: C Band Polarisation data for the classification of crops.
6.1 SAR classification. 112
6.2 Test site and dataset 113
6.2.1 Test site. 113
6.2.2 Ground data. 113
6.2.3 SAR images. 113
6.2.4 ERA-ORA database. 114
6.3 Angular variation of polarisation features. 115
6.3.1 Single intensity measurements (HH, VV and HV). 115 6.3.2 Polarisation ratios of singe intensity measurements (HH, VV and HV). 116
6.3.3 Circular polarisation (RR and LL). 120
6.3.4 HHVV correlation. 120
6.3.5 The issue of the angle of incidence. 120
6.4 Analysis of backscatter measurements in view of crop classification. 123
6.4.1 HV versus VV. 123
6.4.2 HV versus Correlation between HH and VV. 124
6.4.3 HV/VV versus Correlation between HH and VV. 124
6.4.5 HH/VV versus HV/VV. 124
6.5 Selection of backscattering measurements for crop classification. 129 6.5.1 Discrimination between vegetation and bare soils. 129 6.5.2 Separation between broad leaf and small stem crops. 129 6.5.3 Separation of plants with different biomass levels. 130
6.6 Summary of the ERA-ORA database analysis. 130
6.7 Physical based crop classification. 131
6.7.1 Proposed classification scheme. 131
6.7.2 Results for July 12. 132
6.7.3 Results for July 28. 138
6.7.4 Results for July 3. 139
6.8 Discrimination of crops using AIRSAR data in the area of Barrax. 143
6.8.1 Data analysis. 143
6.9 General conclusion. 147
CHAPTER 7: Use of ENVISAT ASAR-APP data for crop studies.
7.1 Test site and dataset. 149
7.1.1 Description of the field measurements. 150
7.1.2 Radar images. 155
7.1.3 Ancillary data. 156
7.2 Image processing. 157
7.3 Evaluation of the consistency of the measured backscattering. 163 7.4 Analysis of ASAR temporal backscattering measurements of crops. 165 7.5 Relationships between biomass and the backscattering coefficient for wheat
canopies. 170
7.6 Backscattering coefficient from a wheat canopy. 171
7.7 Study of the backscattering coefficient of a wheat canopy. 172 7.7.1 ASAR measurements in a wheat field in the Toulouse area. 172
7.7.2 Biomass relationship. 175
7.7.3 Discussion and conclusion on the retrieval of wheat biomass. 177
CHAPTER 8: Conclusions.
8.1 Conclusions. 179
REFERENCES
-Adiós -dijo Ana, reteniendo la mano de Levin y mirándole a los ojos con una mirada que le conturbó-. Me siento muy dichosa de que la glace soit rompue.
Leon Tolstoi, Ana Karenina
CHAPTER 1:
INTRODUCTION
1.1
Scientific context.
1.1.1. Need for an agricultural monitoring.
The economic and social importance of the agricultural sector in many regions of the world, together with the concern about world population increase, economic development and the uncertainty in the changes of production caused by climate change, made necessary the development of procedures and techniques to monitor the conditions of crops, to improve the crop field management and also to be able to make early prediction of crop production. This need for an efficient crop monitoring and management, as well as, the prediction of crop production is thus enhanced by climate change issues and by the changes in agriculture related to human activities.
Regarding human activities, the Food and Agricultural Organization of the United Nations (FAO) states that the world population will increase at a rate of 43 millions per year in the period 2045-2050 (Bruinsma, 2003). This rise of human beings in the world will be a consequence of the population growth in developing countries (45 millions), and prognosis is that half of this accruement will occur in the sub-Saharan Africa (23 millions). In those developing countries, especially in Africa, the increase of population will aggravate even more the current world undernourished state. It is expected that industrial countries will have some reactions for increasing food production in concordance to this population growth. Thus, there is a matter of fact that it exists a general concern about increasing agricultural production.
Furthermore in the frame of what is also known as food security strategies, there is an interest in predicting problems like pest infections and drought periods than can damage the crop production. In the large arid and semiarid regions of the world droughts are frequent and they commonly cause a decrease or a total failure of crop production, important economic losses in
developed countries, and famine in undeveloped countries. An increase of some of these problems is expected with climate change, mainly in the Mediterranean region, which might be one of the most vulnerable regions to global change in Europe. Climate change projections for the Mediterranean region show a reduction of agricultural areas and losses of agricultural potential during the twentieth century (Schröter et al., 2005) due to the pronounced decrease in precipitation that is predicted (Giorgi and Lionello, 2008).
The current change of diet habits in some important emerging countries, like India and China is increasing the demand for agricultural products. In these countries, a growing sector of the population is becoming wealthy enough to change from a mostly vegetarian diet, based on rice and other cereals, to a diet that includes more meat. Livestock needs to be fed with cereals, which increases the demand and, therefore, market prices. Furthermore, some developed countries are increasing their production of biofuels, which diminishes the quantity of crops used for human consumption. This is also helping to increase the prices of cereals. Last, but not least, the upward trend of prices is attracting speculators to the markets. This increase of prices is causing political tensions, as happened during the spring of 2008 in countries like Haiti, where the prime minister had to resign, Cameroon, Senegal, but also Egypt or Thailand. A means for limiting price increases would be to increase production, which would need an increase of agricultural productivity. In fact, during the FAO summit of June 2008, it was stated that more investments should be done to increase agricultural productivity.
The need for an increase of production has induced important changes in the agricultural practises during the last decades. For example the use of fertilizers has been extended worldwide and genetically modified crops are used as a solution for a “sustainable” production increase (Qaim and Wilberman, 2003). There is also a concern about the impacts associated with these new agricultural practises. The expansion of agriculture needs to be done in a sustainable way as the generalized use of fertilizers or over exploitation of water resources represents environmental risks and can even have consequences for human health. The increase intensive processes like irrigation and/or the abuse of fertilizers also might produce some negative consequences on water quality and the degradation of irrigated lands for instance as a consequence of salinisation.
Finally, another noticeable change in modern agriculture is that more and more frequently crop rotations are decided by market fluctuations and policy regulations (especially in the E.U.). This introduces an additional dynamics in crop distribution, which make necessary to update crop maps with a high temporal frequency.
The other important issue that requires a system for crop monitoring is the impacts of climate change in agriculture. Studies conducted over the last decades have provided evidence about the modifications of several climatic parameters (Solomon et al., 2007). For instance,
noticeable trends in surface temperatures have been recorded during the twentieth century at the global scale (Jones and Moberg, 2003). Satellite observations using AVHRR and ATSR data confirmed an increase in global sea temperature (+0.13ºC in a decade). An increase of extreme events such as hot waves, droughts and extreme precipitation events has also been recorded in different regions (Karl and Easterling, 1999). The existing models of climate agree on the increase of global surface temperatures for the second half of the 21st century. For instance, after a doubling of the concentration of CO2, the increase in temperature is likely to be in a range that
goes from 2 to 4.5°C, with a best estimate of about 3°C. Nevertheless, although this is the general pattern predicted at the global scale, models indicate an important spatial diversity in the manifestation of the effects of climate (Räisänen, 2007).
The feedback effect of climate change on agriculture is complex. The increase in temperature and the increase in the concentration of atmospheric CO2 could affect the plant
biological processes (photosynthesis, respiration, growth, etc) (Barnes et al., 1995; Booker et al., 2005). The fertilizing effect of the atmospheric carbon could produce a general increase of the vegetation activity and production (Long et al., 2005). Nevertheless, the positive response of vegetation activity and production to climate change is only expected in areas with an adequate availability of water, on the contrary, the areas affected by an increase of temperatures and evapotranspiration together with a decrease of precipitation will suffer from a higher water stress in vegetation, which, in turn, would cause a decrease of the production (Vicente-Serrano et al., 2006). Finally, extreme events (hot waves, droughts, extreme rainfalls) have a negative effect in crop production (Vicente-Serrano, 2007). The undesirable impacts that climatic change can have in crop production show the strong requirement for the monitoring of crops at present and to be maintained in the future.
1.1.2. Crop monitoring.
In the previous section it was highlighted that the relationship between agriculture and climate and the important changes in agriculture practises during the last part of the 20th century
shows that agricultural monitoring systems are necessary. To be efficient, such systems should satisfy at least the three requirements listed hereafter: they should be able to provide a map of crops timely, to survey the growth of crops and if possible to predict the yields. Below, each of these requirements is discussed in more detail.
Crop mapping.
in the distribution of crops within the land devoted to agriculture. Therefore, the timely identification, inventory and cartography of crops becomes necessary for estimations of crop yield. In addition to the crop production assessment, crop mapping is also useful for the management of water resources or the estimations of sequestration of carbon by the soil, among others.
Crop growth survey.
Crop growth survey consists in the monitoring during the growth period of several crop and soil parameters, which are indicators of the plant condition, together with the actual plant phenological stage. Those parameters are for example plant height, LAI (Leaf Area Index), biomass or nitrogen content. Typically, the survey of crop growth is focused in the following issues, which are in-turn interconnected:
- Phenology development: which is the succession of biological events during the plant life. The survey of phenology implies, for example, the observation of the exact moment in which certain crop organs appear (ex. wheat ears). Phenology is often simulated in terms of the sum of degree-days and crop specific characteristics, for instance vernalisation factors.
- Canopy development: it can be quantified by the measurement of the LAI, the plant biomass of the plant height. In terms of biological processes, canopy development is the result of photosynthesis, respiration and biomass allocation. The amount of energy received and the capacity of the plant to use this energy will determine the biomass production. The amount of intercepted radiation is a function of the LAI. Only a part of the intercepted radiation, denoted as fPAR, is efficiently used by the crop and will be used for biomass accumulation. The way in which biomass partitioning is performed is specific to each cultivar type. In the modelling of canopy development the high vegetative structural diversity is controlled by genetic variables that intervene in this partitioning.
- Roots growth and uptake ability: the function of plant roots is to uptake water and nutrients from the soil. This is closely related to the soil chemical and physical properties as well as the soil moisture conditions. Any lack of nutrients, especially nitrogen, or any water deficiencies would negatively impact the plant development. The shortages in mineral content or basic nutrients in the soil can be detected with periodical analysis of soil samplings and compensate with fertilization. The monitoring of moisture conditions is also necessary. Regarding biological aspects, there is a big difference between the root system of annual crops (ex. wheat, corn, potatoes…) and perennial crops (ex. vineyards).
- Water balance among the plant, the soil and the atmosphere. The water requirements of a crop in a particular moment depend on the environmental variables (ex. air temperature), the soil conditions and the crop phenology. The processes involved in the water
balance include evaporation and transpiration, both in the soil and in the plant. The list of variables that take part in the water balance, mainly describing the soil status and soil water behaviour, can be very extensive (soil albedo, drainage coefficients, etc….) but the most important is soil moisture.
- Nitrogen balance in the soil and in the plant. The content of nitrogen in the soil can change as a result of organic decompositions, fertilisation, etc. Crops absorb nitrogen through the roots system and fix it in their elements. The nitrogen content in the leaves is related to the chlorophyll content, which is easier to measure than nitrogen content.
The information obtained from the survey of the previous points through the quantification of several parameters is of great valuable for the management of fields and are the basis of the human interventions like the use of fertilizers or a particular irrigation schedule. However, the monitoring of the parameters of crops along a growing season is expensive and time consuming, and therefore, there is a need for developing remote sensing techniques that will be useful in this context.
Prediction of crop yield.
Several techniques have been used to obtain an early prediction of crop production, most of them based on previous climate conditions summarised by means of drought indices, vegetation indices obtained from remote sensing data (e.g., Mkhabela et al., 2005; Kalularme et al., 2003; Royo et al., 2003) and both of them (Vicente-Serrano et al., 2006). These methods are based on regression models between the final crop yields, the climate data and vegetation indices. Although these methods are widely used, they have the problem that predictions are site specific from local measurements and sometimes the spatial extrapolation is difficult, as a consequence of the geographic and topographic diversity and the different crop types. To solve these problems, more complex models, based on biophysical processes, can also be used. These are likely to be more general than the statistical methods based on local regressions. A model of crop growth describes how a plant grows, that is, how the carbon is allocated in the plant. These models require daily meteorological data: incoming solar radiation, temperature and precipitation. Many models have been developed or adapted to a unique cultivar, a reduced number of them or to particular crop conditions like water stress, nitrogen stress, salinity conditions, etc. and make use of many parameters. Thus, the benefits of using a monitoring system that provides crop parameters describing canopy development, for instance LAI would be very important for model calibration, forcing, etc.
A huge diversity of crop growth models exists in the scientific literature. Some well-known models and their related ‘families’ are SUCROS (Simple and Universal Crop Growth Simulator) (Spitters et al., 1989), CERES (Crop Environment Resource Synthesis) (Jones and
Kiriny, 1986; Ritchie et al., 1985) that was developed for cereals, CROPGRO (Hoogenboom, 1992) is a family of grain legumes models and STICS (Simulateur mulTIdisciplinaire pour les Cultures Standard) (Brisson et al., 1998) developed at the INRA, France. There are also software “packages” like DDSAT (Decision Support System for Agrotechnology Transfer) (Jones et al., 2003) and APSIM (Agricultural Production Systems sIMulator) (McCown, 1986) that integrate several of the previously cited models.
Nevertheless, despite the great usefulness of these models, there are noticeable limitations concerning its calibration. Crop parameters describing canopy development and dynamic are commonly needed for the calibration of the models. This involves time and cost consuming field samplings and very often there is a lack of spatial representation, mainly in areas in which spatial diversity of crops, soil characteristics and climate are important.
Therefore, due to these limitations, there is a need to develop methods based on remote sensing data, which allow the monitoring of crop parameters over large areas, to improve the yield prediction.
1.2. The role of remote sensing in crop monitoring.
The monitoring of crops can be done by means of ground survey at the local scale. However, at a regional scale, remote sensing appears appropriate booth in terms of spatial and temporal coverage.
Crop mapping.
As it was said before, crop mapping is necessary in land change studies, climate change, hydrological studies and other applications like yield prediction and the efficient management of water resources, the later usually based in the estimates of evapotranspiration (Simonneaux et al., 2008). Crop maps are usually used in combination with crop growth models for yield prediction or to model for example soil carbon sequestration (Doraiswamy et al., 2007).
Because of the amount of applications, the classification of crops using remote sensing images is an important topic in remote sensing research. The advantages of using remote sensing techniques, instead of field survey, are the lower cost and the possibility of covering large areas. Another important reason is that it is easier to update the classifications, due to the possibility of repeated time frequency of the data.
The use of optical remote sensing data is well established for crop mapping and the methodologies have been proved to be quasi operational. Crop classification using optical data is often performed with data with a spatial resolution compatible with the field size: in general Landsat-TM or SPOT-HRV data at regional scale are used. Medium-resolution data (200 Km -
1Km) and coarse resolution data (> 1Km) are often considered as insufficient with regard to the size of the fields. Those data (AVHRR, MODIS, MERIS, SPOT-VGT) are mostly used for multi-year temporal surveys, and to obtain land use/land cover maps at continental or global scales (Loveland et al., 2000; Strahler et al., 1999; Bartholomé and Belward, 2005). A well-known limitation of optical data is the presence of the cloud cover that prevents the acquisition of images at the desiderate time. Radar data, in contrast, has the advantage of being independent from cloud cover and thus show a high potential for crop classification. It may also happen that vegetation needs to be monitored at a specific phenology stage. This is the case, for example, when two crops have similar behaviour during the growing season except for a specific development stage. However, satellite radar data have not often been used for this purpose, (Saich and Borgeaud, 2000; Schotten et al., 1995; Tso and Mather, 1999) mainly because, until very recently, satellites were only able to measure single linear polarisations at a single frequency: ERS-1 and ERS-2 operate at C Band at VV polarisation, RADARSAT operated at C band and HH polarisation, JERS operated at L Band, HH polarisation. Future missions will measure the complete scattering matrix at a single frequency and there is a need for developing adequate classification methods.
Several algorithms use radar data for the classification of crops. In a general way, they can be classified into knowledge-based approaches, classification by scattering mechanism and statistical data-driven methods (Oliver and Quegan, 1998). Knowledge-based approaches are based on the analysis of the physics that determines the measured backscattering for each crop type. Those classifiers have the advantage of being more robust and easier to adapt to the specific conditions of the area to classify.
Crop condition and growth survey using remote sensing data.
Remote sensing data can be used to estimate biophysical parameters, which are indicators of the crop condition along the growing season. Multi-temporal estimations of these parameters contribute to the growth survey. Biophysical variables like LAI, fraction of photosynthetically active radiation (fPAR), biomass or nitrogen content are important because they contribute to the understanding of the crops dynamics and environmental dynamic at any spatial scale. In spite of the availability of radar data under any weather conditions, the retrieval of biophysical parameters is more frequently done using optical data, mainly because the interaction between the radar signal and the vegetation is more complex than with the optical signal and it is more difficult to establish the biophysical relationships. Generally they can only be established for one type of crop, because it has a particular structure. In addition it is complex to handle radar data compared with optical data. A large amount of papers were published on the derivation of biophysical parameters at leaf and canopy level from optical data. Many examples
can also be found for LAI (Turner et al., 1999; Weiss et al. 2000; Combal et al, 2002a), Duchemin et al., 2006), fPAR, canopy water content and leaf chlorophyll content. For agricultural crops, for which temporal changes are more rapid than for instance forest surfaces, multi-temporal observations are very important. Few papers have addressed the effective inversion of multi-temporal and high-resolution satellite images for various crop types. Thus, more work needs to be done on the retrieval of biophysical parameters using multi-temporal data.
In the radar domain, multi-angular, polarimetric and interferometric data have been shown to be of interest for the retrieval of biogeophysical parameters like crop height, plant water content, LAI and biomass (Le Toan et al., 1984). Those studies were mainly conducted with the X and C Bands. It has been demonstrated that if the vegetation cover has components with specific orientations, the penetration depth, the volume scattering, and the attenuation may be different at different polarisation states (Ferrazzoli et al., 1999; Picard et al., 2003, and Mattia et al. 2003). This phenomenon was the base used to develop an algorithm to map rice fields (Le Toan et al., 1989).
As with crop mapping the retrieval of biophysical parameters using radar satellite data have been limited by type of data. The ASAR sensor onboard ENVISAT allowed, for the first time, to measure two simultaneous polarisations HH/VV, HH/HV and VV/HV at different non-simultaneous incidence angles in Band-C. This motivated studies on the use of polarimetry for biomass retrieval of wheat (Mattia et al., 2003). This work studies the potential of polarized radar data in the derivation of biomass for small grain cereals using ENVISAT-ASAR data.
The role of Remote Sensing in combination with crop growth models for crop yield prediction.
It is difficult for the models to account for the spatial heterogeneity in vegetation and soil conditions as well as the inherent difficulties of phenology modelling. Crop growth depends on many factors (weather, species, soil status, soil characteristics and management strategies) and, as a result, models need many parameters. For instance STICS v3.0 depends on 132 parameters (Ruget et al., 2002). It is frequent that some of these parameters, like the sowing date, are unknown, or need to be adjusted for each crop type or geographical location. One solution consists in calibrating the models using measurements of biophysical parameters (e.g. Brisson et al., 1998; Spitters et al., 1989; Bondeau et al., 1999; Launay and Guerif; 2005). LAI, which accounts for the leaf surface intercepting in-coming radiation, and biomass are key variables to calibrate crop growth models.
The calibration can be done with in-situ measurement of biophysical parameters. However, in-situ measurements are expensive and time consuming and generally can only be done at a limited number of fields. Thus, calibration has the risk of becoming site and
specific. In this context satellite remote sensing is useful when integrated in the models of crop growth as it provides spatial information on actual vegetation status. Remote sensing can be used to estimate key variables in the models: LAI, aboveground biomass and other crop characteristics like chlorophyll or nitrogen content. This information can be integrated in the calibration process using for example forcing methodologies (Clevers and van Leeuwen, 1996; Moulin et al., 1998).
1.3. Objectives of this study.
The general objective of this thesis is the assessment and development of methods based on remote sensing data, which are useful to the monitoring of crops, and can contribute, when combined with other methods, to improve yield prediction. The thesis focuses on two main topics: the classification of crop types and the retrieval of vegetation parameters. Furthermore, a relevant aspect addressed in this thesis is the benefits of using multi-temporal data. To achieve the goals of this study it has been necessary to deal with the complexity of using many different instruments, data types, test sites and ground measurements.
This study is based on two types of remote sensing data: optical and radar. The satellite optical instruments that are used are LANDSAT-TM and ENVISAT-MERIS. The radar data come from the satellite instrument, ENVISAT-ASAR, as well as from an airborne sensor, JPL-AIRSAR. More details about these sensors and satellites are commented in the following chapters.
For agricultural applications, the use of both optical and radar data is needed to overcome the limitations that each type of data have on their own. For example, although there are operational methods for the classification of crops using optical data, these methods cannot be applied in regions with a frequent presence of clouds. In this sense, this study is a demonstration of the complementarities of both types of data in crop studies. Optical data are used to perform a multi-temporal LAI monitoring, and to retrieve LAI & Chlorophyll. Forthcoming and recent satellite radar data are used for crop mapping. Finally, the retrieval of biomass using radar data is also investigated.
Concerning the retrieval of biophysical parameters, the objectives of this study are three: - The derivation of seasonal LAI variations from LANDSAT images for the
different crops in an agricultural area.
- The development of multi-temporal method for the inversion of LAI & Chlorophyll using MERIS-FR data.
- To investigate the crop monitoring of small grain cereals with ASAR-APP data and the possibilities of biomass retrieval of small grain cereals.
Regarding crop mapping the objective in this thesis is the development of a hierarchical classification method and its validation. In view of applications to present and future satellite data fully polarimetric C-Band AIRSAR data are used. The potential of ENVISAT-ASAR data is also investigated in the last part of this work.
This study has been developed in three agricultural areas in Europe:
- Barrax in Castilla-La Mancha, Spain. Chapter 3 describes more in detail the region as well as the ground measurements acquired during the ESA/SPARC-2003 campaign.
- Flevoland, North of The Netherlands. More details are given in Chapter 6. - Toulouse, South of France. The description of the experiment developed in a
wheat field for the collection of wheat biomass and other measurements is done in Chapter 7.
1.4
Organisation of the thesis report.
The present thesis has been organised in two parts: optical and radar. The thesis will provide background information needed for the understanding of the remote sensing signal with respect to the agricultural crops. Chapter 1 is a general introduction.
Part I presents the results obtained from the optical data in the area of Barrax.
- Chapter 2 gives the physical basis of the optical remote sensing. A description
of the models used for the inversion of optical data is presented, as well as a review of existing algorithms for LAI, Chlorophyll and biomass retrieval is presented. The atmospheric correction method that was applied to the optical data is also described.
- Chapter 3 focus on the retrieval of LAI using LANDSAT-TM data. The study
was conducted in the region of Barrax. LAI was inverted using images at twelve dates during year 2003 and validated with ground measurements from the ESA/SPARC-2003 campaign.
- Chapter 4 gives results on the retrieval of LAI & Chlorophyll with MERIS-FR
from multi-temporal inversion. The study was also in the region of Barrax.
Part II refers to the work done using radar data. The three study areas are involved. Chapters 5 to 7 are organised as follows:
- Chapter 5 gives the theoretical context or radar remote sensing necessary for Chapters 6 and 7.
- Chapter 6 reports the performance of a hierarchical crop classification
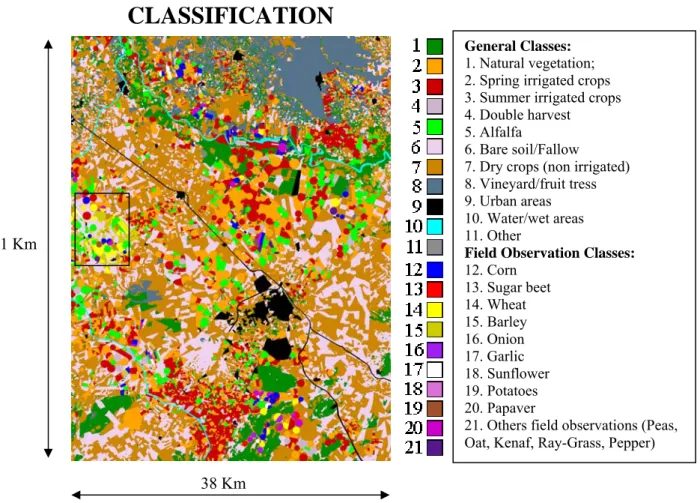
method, based on C-Band polarimetric measurements from synthetic aperture radar. AirSAR data collected on the Flevoland site in the frame of the ESA MAC-Europe campaign, and the European RAdar-Optical Research Assemblage (ERA-ORA) library
(http://eraora.disp.uniroma2.it/) were used. The results obtained in classifying 5 types of crops and a soil class were validated with a ground truth map of the site. Some of the algorithm rules were also tested in the region of Barrax.
- Chapter 7 deals with the applications of ASAR-APP data in crop
classification, and the retrieval of biomass for small grain cereals using ENVISAT ASAR data, in the Toulouse region. The field campaing that was conducted in Toulouse to measure the biophysical parameters of a wheat field is presented. Results on the use of ASAR-APP data in Barrax for crop classification are also shown. Finally, the processing applied to ENVISAT-ASAR data is also described in that chapter.
¿Dónde está mi ciencia? He sido un testarudo, he perseguido un simulacro de orden, cuando debía saber muy bien que no existe orden en el universo. -Pero, sin embargo, imaginando órdenes falsos habéis encontrado algo...
Umberto Eco, El Nombre de la Rosa
CHAPTER 2:
BIOPHYSICAL PARAMETERS AND OPTICAL DATA
Prior to the assessment of optical remote sensing methods, this chapter gives a brief introduction to the conceptual basis of optical remote sensing. Those are presented as the background relevant to the thesis, with the aim of understanding the relationships between the signal measured by the optical sensors and the vegetation properties. First, a general scheme of the remote sensing problem is outlined. The effect of the atmosphere on the sun radiation is explained and the atmospheric correction method that has been applied to the data is presented. The models that have been used in this work to describe the interaction of solar radiation with the vegetation canopy are also presented. The chapter ends with a review of bibliography concerning the derivation of biophysical parameters, LAI and Leaf Chorophyll Content using optical data.
2.1
Physical definitions.
In this section the definition of some physical magnitudes used in radiometry are given. They will be used along this work.
Flux, (W): ! Energy coming from or arriving to a surface per unit of time. It is also called power.
Intensity, (W· sr-1):
I Flux per unit of solid angle.
Irradiance, (W· m-2):
E The incident flux on a surface.
Radiance, (W· sr-1· m-2):
L Flux per unit solid angle per unit projected source area. L" d
2#
dAd$cos% [Eq. 2.1]
(W· sr-1· m-2 · 'm-1): the integral of all spectral radiances from a surface.
Reflectance, (unit-less): ( The reflectance is the ratio between the incident flux (irradiance) and the reflected flux (reflected irradiance) from a surface. It is a unit-less quantity.
(" E(reflected ) E(incident ) [Eq. 2.2] BRDF (sr-1): !!fr( "! $)r, "!
$)i) The bidirectional reflectance distribution function
(BRDF) is the ratio of reflected radiance coming from a surface in a particular direction
!!
$)
"!
r to the irradiance incident on the surface from direction $)!"!i.It is dimensionless. Spectral BRDF (sr-1nm-1):
!!fr(&;
"!
$)i,$)"!r) The spectral BRDF describes the BRDF as a
function of wavelength.
For a much more complete summary of radiation related magnitudes see, the classical reference Nicodemus (1977).
2.2
Optical remote sensing system.
Figure 2.1. Basic scheme of the remote sensing system.
(Source : http://landsat.usgs.gov/) The elements involved in the observation of
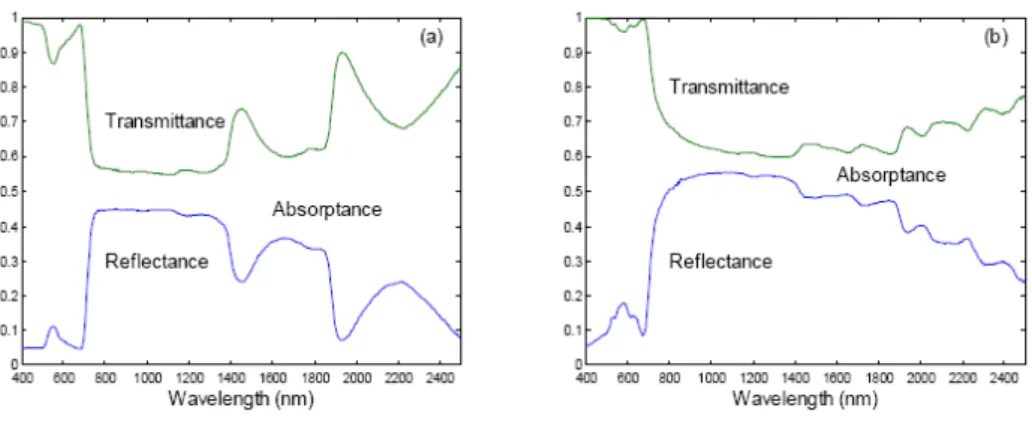
vegetation using an optical remote sensing system are outlined in Figure 2.1. Basically, the system is composed of the following elements: the sun, the atmosphere, the observed surface and the satellite sensor. The solar radiation is transmitted through the atmosphere before interacting with the surface. Part of the solar radiation that reaches the surface is reflected and transmitted back through the atmosphere towards the sensor.
The sun is the source of energy of the system. The sun radiation on top of the atmosphere is close to the radiation emitted by a black body with a surface temperature of around 5900 K (see, Figure 2.2). The sun radiation on top of the atmosphere is well
characterised. It is strongly directional and in the remote sensing problem it is considered as a punctual source of energy placed in the infinite. Thus, the geometry of the sun is defined with the sun zenith and azimuth angles.
Before reaching the surface, the sun radiation crosses the atmosphere, in which absorption and dispersion processes occur. The absorptions produced by the atmospheric gases are well known (see Figure 2.3). The main spectral regions for which atmospheric absorption is small are called the atmospheric windows. The part of the radiation that is absorbed will be re-emitted in another wavelength range. The constituents of the atmosphere also diffuse part of the solar radiation in all directions. The angular distribution of atmospheric radiance is difficult to be described; it depends on the particles size, quantity and shape, and can be very variable spatially.
Figure 2.2. Solar irradiance curve on top of the atmosphere, at see level and blackbody emission. The principal atmospheric gases absorptions are also indicated. Source: http://msis.jsc.nasa.gov/.
Figure 2.3. Atmosphere transmission. The spectral regions with a high transmission are the so-called atmospheric windows. The principal atmospheric gases absorptions are also indicated. Source:
http://tncweeds.ucdavis.edu/.
frequently observed, it may occur for instance on a free water surface. Most of the natural surfaces show diffuse reflection. In diffuse reflection, the returning reflection of the directional incoming radiation flux is scattered in many directions. Diffuse reflectance is often characterised by means of the bidirectional reflectance distribution function (BRDF). A particular case of diffuse reflection is that of a Lambertian surface. The intensity of light scattered from a point on a reflecting lambertian surface follows a cosine relationship:
*
+ ,
%s -*0cos%s [Eq. 2.3]where is the incident light intensity and *0 %sis the angle of the scattered light. In lambertian
surfaces, no dependence on azimuthal angle of the incident or scattered light is assumed. The lambertian case is the ideal case corresponding to a rough surface, in which many random reflections occur before the light leaves the surface.
Finally, the reflected light reaches the remote sensing sensor. In the solar domain there are many sensors having different spatial and temporal resolutions as well as a different spectral bands configuration.
2.3. Satellite and sensors characteristics.
As explained in Chapter 1, in this work we make use of LANDSAT-TM and ENVISAT-MERIS sensors. The basic characteristics of these instruments are resumed below.
LANDSAT/TM:
The NASA Landsat program (http://landsat.gsfc.nasa.gov/) has been providing earth observation data for more than 30 years. The first satellite of the family (Landsat-1) was launch in 1972 ant the most recent (Landsat-7) in 1999. Up to day there are two Landsat satellites operational: Landsat-5 (only TM instrument) and Landsat-7 (although in 2003 there was a failure of the Scan Line Corrector, SLC). The continuation of the program will be the Landsat Data Continuity Mission (LDCM).
Landsat-5 and Landsat-7 Orbital characteristics: Orbit: Polar, sun-synchronous
Altitude: 705 Km
Repeat coverage: 16 days Instruments:
Landsat-5: Thematic Mapper (TM), Multispectral Scanner (MSS) Landsat-7: Enhanced Thematic Mapper Plus (ETM+)
Landsat-5 : 185km x172km Landsat-7 : 183km x170km
The spectral bands and Instantaneous Field Of View (IFOV) of TM and ETM+ sensors are detailed in Tables 2.1 and 2.2.
Band Number µm Resolution (m)
1 0.45-0.52 30 2 0.52-0.60 30 3 0.63-0.69 30 4 0.76-0.90 30 5 1.55-1.75 30 6 10.4-12.5 120 7 2.08-2.35 30
Table 2.1. TM Bands. Band 5 is for termal infrared radiation, acquired at night.
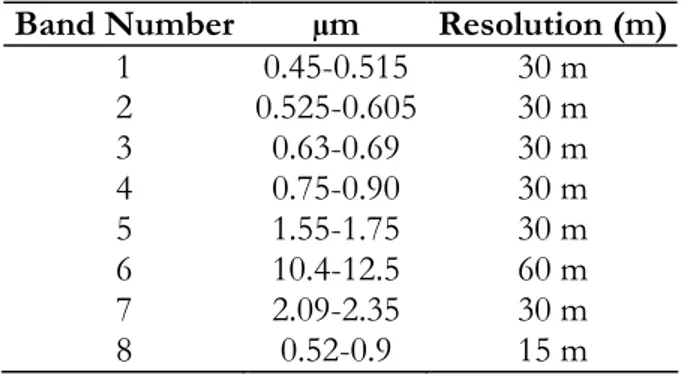
Band Number µm Resolution (m)
1 0.45-0.515 30 m 2 0.525-0.605 30 m 3 0.63-0.69 30 m 4 0.75-0.90 30 m 5 1.55-1.75 30 m 6 10.4-12.5 60 m 7 2.09-2.35 30 m 8 0.52-0.9 15 m
Table 2.2. ETM+ Bands. New features on Landsat 7 are a panchromatic band with 15 m spatial resolution.
ENVISAT/MERIS:
ENVISAT satellite was launched in March 2002. ENVISAT Orbital characteristics:
Source: http://www.esa.int/esaEO/SEMWYN2VQUD_index_0_m.html. Orbit: Sun synchronous
Mean Altitude: 800 km Repeat cycle: 35 days. Instruments:
ASAR Advanced Synthetic Aperture Radar. C Band GOMOS Global Ozone Monitoring by Occultation of Stars
LRR Laser Retroreflector (Passive array of corner cubes for satellite ranging)
MERIS MEdium Resolution Imaging Spectrometer Instrument
MWR Microwave Radiometer (measure the integrated atmospheric water vapour column and cloud liquid water content, as correction terms for the radar altimeter signal).
RA-2 Radar Altimeter.
AATSR Advanced Along Track Scanning Radiometer. (Measures surface temperatures).
DORIS Doppler Orbitography and Radioposition Integrated by Satellite. (Trackig system to provides orbit accuracy on order of centimeters).
SCIAMACHY SCanning IMaging Absorption SpectoMeter for Atmospheric CHartographY (measures traces gases in atmosphere).
In depth information can be found at ESA, 2006 http://envisat.esa.int/instruments/. MERIS is a 68.5º field-of-view pushbroom imaging spectrometer that measures the solar radiation reflected by the Earth, in 15 spectral bands, in the visible and near infra-red. The bands are progamable in position, width and gain, but expect for particular experiments, the instrument is set to the bands shown in Table 2.3. In Full Resolution mode (FR), MERIS has an spatial resolution of 300 m, and in Reduced Resolution (RR) of 1200 m. MERIS allows global coverage of the Earth in 3 days. MERIS was designed for measuring ocean color.
Band Number Band center (µm) Bandwith (nm)
1 412.5 10 2 442.5 10 3 490 10 4 510 10 5 560 10 6 620 10 7 665 10 8 681.25 7.5 9 708.75 10 10 753.75 7.5 11 760.625 3.75 12 778.75 15 13 865 20 14 885 10 15 900 10
Table 2.3. MERIS spectral bands characteristics. (Source: :