ÉCOLE DE TECHNOLOGIE SUPÉRIEURE UNIVERSITÉ DU QUÉBEC
THESIS PRESENTED TO
ÉCOLE DE TECHNOLOGIE SUPÉRIEURE
IN PARTIAL FULFILLMENT OF THE REQUIREMENTS FOR A MASTER’S DEGREE IN MECHANICAL ENGINEERING
M. A. Sc.
BY
Hong Den NGUYEN
NUMERICAL SIMULATION OF FORMING OF THERMOPLASTIC COMPOSITES PPS / CARBON FIBER
MONTREAL, SEPTEMBER 28, 2015 © Copyright 2015 reserved by Hong Den Nguyen
© Copyright
Reproduction, saving or sharing of the content of this document, in whole or in part, is prohibited. A reader who wishes to print this document or save it on any medium must first obtain the author’s permission.
BOARD OF EXAMINERS
THIS THESIS HAS BEEN EVALUATED BY THE FOLLOWING BOARD OF EXAMINERS:
Professor Zhaoheng Liu, President of the jury
Mechanical Engineering Department, École de technologie supérieure
Professor Ricardo Zednik, Jury member, Examiner
Mechanical Engineering Department, École de technologie supérieure
Professor Tan Pham, Jury member, Thesis supervisor
Mechanical Engineering Department, École de technologie supérieure
THIS THESIS WAS PRENSENTED AND DEFENDED
IN THE PRESENCE OF A BOARD OF EXAMINERS AND THE PUBLIC ON SEPTEMBER 24 2015
ACKNOWLEDGMENTS
I would like to express my deep gratitude to Professor Tan Pham, my research supervisor, for his patient guidance, enthusiastic encouragement and useful critiques of this work. My research project would not have been finished without the precious support that I received from my director.
I would like to thank my thesis committee members: Professor Liu, Professor Zednik, for their evaluation, insightful comments and questions.
I also gratefully acknowledge all the partners who collaborated to this project: Professor Hoa Van Suong and his Ph.D. student, Amir Bahram Kaganj, from Concordia university, Professor Martine Dubé and her Master’s student, Thibault Jamin from École de Technologie supérieure, Stéphane Héroux from Delastek company and all partners from Bombardier company and Canada National Research Council.
I would like to thank the technicians of the laboratory of the mechanical department for their help in using technical equipment that supported my research work.
I would also like to extend my thanks to Dr. René Ten Thije and Dr. Sebastiaan Haanappel from University of Twente, for supporting me in my use of Aniform software.
Finally, I must sincerely thank my family and my friends for their encouragement during the tough times when I live very far from them, and from my country.
SIMULATION NUMÉRIQUE DU FORMAGE DES COMPOSITES THERMOPLASTIQUES PPS/FIBRE CARBONE
Hong Den NGUYEN RÉSUMÉ
Cette recherche a pour but la modélisation du procédé de formage par estampage des composites thermoplastiques pour prédire les distorsions de forme lors du formage tel que les rides, l’orientation des fibres et la distribution des épaisseurs. Le formage de stratifié multicouche de composites de polysulfure de phénylène et fibre de carbone (PPS/CF) a été réalisé avec succès pour plusieurs géométries de simples formes à des complexes. Les mécanismes de déformation primaires du matériau PPS/CF ont été étudiés dans cette recherche. Les modèles numériques qui pourraient prendre en compte ces mécanismes de déformation ont été déterminés. Une bonne combinaison des modèles numériques primaires pour la prédiction de formation a été étudiée dans cette étude. Le cisaillement intra-pli, la flexion et la logique de contact entre les plis individuels et entre outil-pli ont été bien considérés dans ce travail. Les effets de frottement entre outil/plis et entre les plis sur la qualité du formage ont été particulièrement étudiés. Les différences entre les résultats expérimentaux et les résultats numériques en termes d'épaisseur, d’orientation des fibres et de distribution de rides ont été minimisées en utilisant une technique d'optimisation multi-objectif pour identifier les paramètres du modèle de matériau. Un bon accord a été trouvé entre les résultats expérimentaux et la prédiction numérique. Les données obtenues, y compris les paramètres de matériaux optimisés et la bonne combinaison de modèles numériques ont été appliquées pour simuler le formage de plusieurs autres géométries et de différentes séquences d’empilement de stratifiés. Dans cette recherche, les simulations numériques ont été utilisées avec succès comme un outil efficace et à faible coût pour la conception optimisée des moules pour l’estampage des matériaux composites thermoplastiques PPS/CF.
Mots-clés: Composites, modélisation, thermoplastiques, optimisation, simulation, formage-estampage
NUMERICAL SIMULATION OF FORMING OF THERMOPLASTIC COMPOSITES PPS/ CARBON FIBER
Hong Den NGUYEN ABSTRACT
This research aims to model the stamp-forming process of polyphenylene sulfide/carbon fiber (PPS/CF) thermoplastic composite to predict the shape distortions during the forming process, such as wrinkles, fiber orientations and thickness distribution. Forming simulations and experiments of multi-layer laminates of PPS/CF composites were successfully performed for several geometries from simple to complex shapes. The primary deformation mechanisms of PPS/CF material were examined in this study. Numerical models that could take into account these mechanisms were determined. A good combination of primary numerical models used for stamp-forming prediction was investigated. Intra-ply shear, bending behaviours and the contact logic between the individual plies and between tool-ply were considered in this work. The effects of friction between tool/ply and between ply/ply on the quality of stamp forming were investigated. The differences between experimental and numerical results in terms of thickness, shear-angle and wrinkle distributions were minimized using a multi-objective optimization technique to identify the material parameters used for forming simulations. A good agreement was found between the experimental results and the predicted results. The obtained data including the optimized material parameters and the best numerical model combination were applied for the stamp-forming of several other geometries and different laminate stacking sequences. In this research project, forming simulations were successfully used as an efficient and low cost tool for mold design for the stamp-forming of thermoplastic composite PPS/CF materials.
TABLE OF CONTENTS
Page
INTRODUCTION ...1
CHAPTER 1 LITERATURE REVIEW ...3
1.1 Composite materials...3
1.2 Forming in composite manufacturing ...3
1.2.1 Compression moulding of thermoplastic composites ... 3
1.2.2 Stamp forming of thermoplastic composites ... 4
1.2.3 Vacuum moulding ... 5
1.2.4 Hydroforming ... 6
1.3 Deformation mechanisms ...7
1.3.1 Intra-ply shear ... 7
1.3.2 Axial loading ... 7
1.3.3 Ply-tool and ply-ply shear ... 8
1.3.4 Ply bending ... 8
1.3.5 Compaction/consolidation ... 9
1.4 Mathematical modelling of thermoplastic composite forming ...10
1.4.1 Isotropic elastic model ... 10
1.4.2 Cross viscosity fluid model ... 11
1.4.3 Elastic fiber model ... 12
1.4.4 Mooney-Rivlin model ... 12
1.4.5 Fabric reinforced viscous fluid (FRVF) model ... 13
1.4.6 Penalty-polymer model ... 14
1.4.7 Adhesion model ... 17
CHAPTER 2 RESEARCH STRATEGY ...19
2.1 Research objective ...19
2.2 Research strategy ...19
CHAPTER 3 FORMING EXPERIMENT OF THE SINGLE CURVATURE SHAPE - PHASE I...23
3.1 Material properties ...23
3.2 Experimental process ...23
CHAPTER 4 INVERSE CHARACTERIZATION OF MATERIAL PROPERTIES FOR SIMULATION OF STAMP-FORMING OF MULTI-LAYER THERMOPLASTIC PPS/CF COMPOSITES ...27
4.1 Introduction ...27
4.2 Forming experiment ...29
4.3 Deformation mechanisms ...31
4.4.1 Numerical models and material properties ... 32
4.4.2 Simulation setup... 34
4.4.3 Predicted result and experimental validation ... 35
4.5 Inverse material characterization procedure and the effects of material properties on forming predictions ...39
4.5.1 Simulation-based inverse characterization procedure ... 39
4.5.2 Inverse characterization result analysis ... 41
4.6 Validation of optimized material properties and numerical models in term of wrinkle distribution...46
4.7 Conclusions ...47
CHAPTER 5 SIMULATION-ASSISTED MOULD DESIGN FOR THE FORMING OF PPS/CF COMPOSITE MATERIALS ...49
5.1 Mould design for the stamp forming of phase II with a ten-layer laminate ...49
5.1.1 Virtual mould design with numerical parametric study ... 49
5.1.2 Mould design to avoid friction force ... 51
5.2 Mould design for stamp forming of phase III with an eight-layer laminate ...56
CONCLUSIONS AND PERSPECTIVES ...61
LIST OF TABLES
Page
Table 2.1 Laminate setups for three phases ...20
Table 3.1 Experimental processing parameters for forming of phase I ...25
Table 4.1 Numerical models ...33
Table 4.2 Material properties ...34
Table 4.3 Material parameters for optimization ...41
Table 4.4 Optimization results ...45
Table 4.5 Coefficient of determination for evaluating the thickness distribution ...46
Table 4.6 Coefficient of determination for evaluating the shear angle distribution ..46
Table 5.1 Virtual mould dimensions ...49
LIST OF FIGURES
Page
Figure 1.1 Compression press ...4
Figure 1.2 The stamp forming method: (a) heating, (b) the blank in the press, (c) moulding ...5
Figure 1.3 Vacuum forming method ...5
Figure 1.4 Hydroforming ...6
Figure 1.5 Intra-ply shear ...7
Figure 1.6 Axial loading ...8
Figure 1.7 Tool-ply and ply-ply shear ...8
Figure 1.8 Ply bending ...9
Figure 1.9 Compaction/consolidation ...9
Figure 1.10 A body in initial state and in the deformed state. ...12
Figure 1.11 Constant tangential contribution ...16
Figure 2.1 Three phases of the project ...20
Figure 2.2 Research strategy ...21
Figure 3.1 The blank was placed onto the Kapton film. ...24
Figure 3.2 The mould was fully closed ...24
Figure 3.3 The formed part ...25
Figure 4.1 Stamp forming system ...30
Figure 4.2 Blank is in the oven...30
Figure 4.3 The formed part ...31
Figure 4.4 Deformation mechanisms ...32
Figure 4.6 General deformation ...36
Figure 4.7 Measurement positions ...37
Figure 4.8 Draw lines on the blank ...37
Figure 4.9 Thickness distribution ...38
Figure 4.10 Shear-angle distribution ...38
Figure 4.11 Simulation-based inverse characterization procedure ...40
Figure 4.12 Optimization iteration history plot for F x y( , ) ...42
Figure 4.13 Thickness comparison between iterations ...43
Figure 4.14 Thickness difference between the predicted results and the experimental results ...43
Figure 4.15 Shear angle comparison between iterations ...44
Figure 4.16 Shear angle difference between the predicted results and the experimental results ...44
Figure 4.17 Wrinkle comparison between the experimental and predicted results of the ten-layer part ...47
Figure 4.18 Wrinkle comparison between the experimental and predicted results of the four-layer part ...47
Figure 5.1 Mould geometry ...50
Figure 5.2 Simulation setup of mould C ...51
Figure 5.3 Forming predicted results of the mould C: (a) Shear angle; (b) Thickness51 Figure 5.4 Mould C2 ...52
Figure 5.5 Simulation setup for mould C2 ...52
Figure 5.6 Forming prediction of the mould C2: (a) Shear angle; (b) Thickness ...53
Figure 5.7 Real mould design (a) Two half- moulds; (b) The mould installed in the press ...53
Figure 5.8 Pin locations ...54
XVII
Figure 5.10 Result comparison: (a) Experiment; (b) Simulation ...55
Figure 5.11 Predicted result: (a) Thickness; (b) Shear angle ...55
Figure 5.12 Contact between the blank and the mould ...56
Figure 5.13 Phase III mould design: (a) Mould design; (b) Virtual formed part ...57
Figure 5.14 Forming simulation: (a) Simulation setup; (b) General deformation ...57
Figure 5.15 Simulation results: (a) Closed mould; (b) Shear angle values ...58
Figure 5.16 Experiment: (a) Forming process, (b) Final shape ...59
Figure 5.17 Measurement: (a) Measurement positions; (b) Sample cutting lines ...59
Figure 5.18 Thickness comparison ...60
LIST OF ABREVIATIONS CFRP Continuous Fiber Reinforced Polymer CFRTP Continuous Fiber Reinforced ThermoPlastics
CF Carbon Fiber
FRVF Fabric Reinforced Viscous Fluid CP Cross-Ply FE(M) Finite Element (Method)
FLD Forming Limit Diagram
LTR Linear/simplex TRiangular element
PPS PolyPhenylene Sulfide
LIST OF SYMBOLS AND UNITS OF MEASUREMENTS
Scalars
C Mooney-Rivlin material parameters
E Young’s modulus, MPa
h film thickness, mm
I invariants of the left Cauchy strain tensor
J Jacobian, volume ratio
ℓ, L length, mm
p hydrostatic pressure, MPa
q scalar weight function
R radius, mm R constraint ratio T time, s u, v, w displacement in x, y, z directions, mm V volume γ shear deformation δ increment ε strain η viscosity, MPa⋅s ν volume fraction ρ density, 103 kg/mm3 σ stress, MPa
Vectors a fiber direction n normal vector u displacement, mm v velocity, mm/s X Lagrangian vector x Eulerian vector τ interface traction Tensors
B left Cauchy-Green strain
C right Cauchy-Green strain
D rate of deformation
d invariant rate of deformation
F deformation gradient
G stretch tensor
I second order unit tensor
σ Cauchy stress
INTRODUCTION
Thermoplastic PPS/Carbon Fiber composite (PPS/CF) is one of the most frequently used thermoplastic composite materials for aircraft structures. It has excellent mechanical properties, high temperature resistance and good chemical resistance. Many advantages of thermoplastic composites are not present in thermoset composites. For example: thermoplastic composites are highly recyclable and can be used for remoulding and reshaping. Thermoplastic composites are also lighter and easier to colour than thermoset materials. Thanks to their advantageous properties, thermoplastic composites are gradually replacing thermoset composites for laminate fabrication, particularly for high volume applications. However, there are a lot of difficulties in stamp-forming thermoplastic composite materials. The process must be performed at an elevated temperature and high pressure. Thermoplastic forming may produce wrinkles and thickness variation in formed parts. High slippages between layers may appear due to the change of friction between tool-ply and between tool-ply-tool-ply. The process becomes much more challenging when dealing with multi-layer laminates and complex mould geometries.
The CRIAQ-COMP512 project was created to study the formability of PPS/CF composite material by stamp-forming. The main objective of this project is to determine the process window for stamp-forming multi-layer PPS/CF material with complex geometries and the limits of the process. The work presented in this master thesis is a part of this project.
This work mainly focussed on the numerical simulation of the stamp-forming process which is necessary to predict shape distortions during the forming process, such as fiber orientations, thickness distribution and wrinkle apparition. Numerical simulations of stamping process were performed using the software Aniform. The work involved four steps: the first step is to determine primary deformation mechanisms during the forming process; the second step is to identify the numerical models that could take into account these deformation mechanisms; the third step is to determine the material parameters for these numerical models; and the final step is to run a new series of numerical simulations using
data obtained from the previous steps for new mould design. The content of this Master’s thesis is presented in fives chapters and the conclusion as follows:
• Chapter 1: Literature review on composite materials forming; • Chapter 2: Research strategy;
• Chapter 3: Forming experiment of the single curvature shape;
• Chapter 4: Inverse characterization of material properties for simulation of stamp-forming of multi-layer thermoplastic PPS/CF composites;
• Chapter 5: Simulation-assisted mould design for the forming of PPS/CF composite materials;
• Conclusions and perspectives.
Chapter 1 presented the literature review on composite materials forming, including the modelling works. In Chapter 2, the research strategy was analysed. There were three phases in this research. It started from the forming of a very simple geometry mentioned in Chapter 3 to determine the parameters of the forming process. The second phase was for forming more complex shapes and material stacking sequences. This work was also employed to perform inverse characterization of material parameters using simulation-based multi-objective optimization technique. The study of the second phase was written as a journal article and reproduced as Chapter 4 in this thesis. Chapter 5 presented the mould design assisted by numerical simulations for forming of PPS/CF composites. This part of work was published as a conference paper from which this chapter was reproduced. Finally, the conclusions and perspectives were presented.
CHAPTER 1 LITERATURE REVIEW
1.1 Composite materials
Composite materials are made from two or more constituent materials with significantly different physical or chemical properties that, when combined, produce a material with characteristics different from the individual components. The individual components remain separate and distinct within the final structure. The new material may be preferred for many reasons: stronger, lighter, or less expensive than traditional materials. There are two main categories of constituent materials: matrix and reinforcement. The matrix material surrounds and supports the reinforcement materials by maintaining their relative positions. The reinforcements impart their special mechanical and physical properties to enhance the matrix properties. A synergism produces material properties absent in the individual constituent materials, while the wide variety of matrix and strengthening materials allows the designer of the product or structure to choose an optimum combination (Gibson, 1994).
1.2 Forming in composite manufacturing
1.2.1 Compression moulding of thermoplastic composites
Compression moulding is a forming process whereby a composite material is placed directly into a heated metal mould, softened by the heat, and forced to conform to the shape of the mould as the mould closes. The presses used for compression moulding are manufactured in a wide variety of sizes. Most presses utilize a hydraulic ram in order to produce sufficient force during the moulding operation. The tools consist of a male mould plunger and a female mould. The amount of heat required and instruments necessary to produce the desired product vary. Some plastics require temperature in excess of 700oF (371oC), while others are
in the low 200oF (93oC) range. Time is also a factor. Material type, pressure, and part thickness are all factors that will determine how much time the part will need to be in the mould. For thermoplastics, the part and the mould will need to be cooled to an extent, so that the formed part becomes rigid. The force with which the object is compressed will depend on what the object can withstand, particularly in its heated state. For fiber reinforced composite parts being compression moulded, the higher the pressure, the better the consolidation of the laminate, and ultimately the stronger the part. Figure 1.1 shows a compression mould press (Robert et al., 1994).
Figure 1.1 Compression press 1.2.2 Stamp forming of thermoplastic composites
In stamp forming, a stack of thermoplastic composites is heated to the softening or melting temperature. The heated stack is then transferred to a moulding press where the laminate is forced into its final shape by a two-part moulding tool. The mould temperatures are maintained constant, below the solidification temperature of the thermoplastic. Figure 1.2 illustrates the stamp forming method (Trudel-Boucher, 2005).
5
Figure 1.2 The stamp forming method: (a) heating, (b) the blank in the press, (c) moulding
1.2.3 Vacuum moulding
Vacuum moulding is used to make single and/or large composite parts with a one-sided tool and a vacuum bag to form the component. Vacuum forming of thermoplastic composites is a process whereby the laminate is heated to the point that it becomes pliable, allowing it to be formed around a plug or male mould. Vacuum forming of thermoplastic composites has some additional advantages over the traditional forming methods of composite materials: short cycle times, low mould and tooling costs, low machine costs and environmentally friendly production methods (compared to thermoset composites). Figure 1.3 shows the vacuum forming method (Trudel-Boucher, 2005).
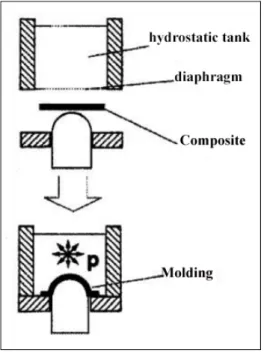
1.2.4 Hydroforming
To produce a hydroformed composite part, a diaphragm is lowered onto the blank and an initial fluid pressure is applied that deforms it onto the retracted punch piece. The punch is then extended, forcing the blank material between the punch piece and the pressurized "forming chamber" created as the diaphragm deforms. The punch continues to extend and draws the part until the desired depth and other dimensions are attained. Next, the diaphragm pressure is relieved, and the diaphragm and punch piece are retracted, leaving the formed part to cool and to be processed further. The even hydrostatic pressure applied by the diaphragm helps to prevent fiber wrinkling and other defects. In addition, the diaphragm support also provides for more uniform part thickness and reduces the propensity for part thinning or "necking" as is common in other material drawing processes. The hydroforming schematic is presented in Figure 1.4 (Trudel-Boucher, 2005).
7
1.3 Deformation mechanisms
This paragraph presents the deformation mechanisms that occur during the forming process of continuous, aligned fiber materials. These have been categorised by several authors (Haanappel, 2013; Long, 2007; Ten Thije, 2007)
1.3.1 Intra-ply shear
Intra-ply shear is usually considered to be the primary deformation mechanism for aligned fiber-based materials. It includes the sliding of parallel tows within a fabric layer or composite ply (longitudinal intra-ply shearing), and rotation of tows at their crossovers (transverse intra-ply shearing) as shown in Figure 1.5 (Haanappel, 2013).
Figure 1.5 Intra-ply shear 1.3.2 Axial loading
The deformation under axial loading is of secondary importance. Loading of aligned fiber based materials along the fiber axis or axes typically results in very large forces and very low maximum strains in comparison to intra-ply shear. The axial loading is illustrated in Figure 1.6 (Haanappel, 2013)
Figure 1.6 Axial loading 1.3.3 Ply-tool and ply-ply shear
During the forming process, friction between the material and forming tools governs the transfer of loads to the material. In multi-layer forming processes, friction between individual layers of material is also of importance. To model forming processes accurately, measurement of friction at ply/tool and ply/ply interfaces is important (Long, 2007). The tool-ply and ply-ply shear is illustrated in Figure 1.7 (Ten Thije, 2007).
Figure 1.7 Tool-ply and ply-ply shear 1.3.4 Ply bending
The ability of fabric or prepregs to bend out of plane is of course critical for forming of curved components. The bending resistance is usually orders of magnitude lower than intra-ply shear resistance, which in turn is significantly lower than tensile stiffness in the fiber direction (Long, 2007). Figure 4 shows the ply bending behaviours.
9
Figure 1.8 Ply bending 1.3.5 Compaction/consolidation
At the end of a forming process, the material must be compacted or consolidated to increase the fiber volume fraction and eliminate voids. For multi-layer, multi-material reinforcement preforms, the compressibility of each material type is likely to be different, so that each layer attains a different fiber volume fraction under the imposed compaction pressure (Long, 2007). Figure 1.9 shows the compaction behaviours.
1.4 Mathematical modelling of thermoplastic composite forming
There are many material models which were developed and published recently. This paragraph presents several important models and the parameters used for composite forming simulations.
1.4.1 Isotropic elastic model
Following Hook's law, the second Piola-Kirchhoff stress tensor S is calculated as follows (Jones, 1999): [ ] (1 )(1 2 ) xx xx yy yy zz zz xy xy yz yz xz xz S S S E S S S ε ε ε ε ν ν ε ε = + − D (1.1) with 1 0 0 0 1 0 0 0 1 0 0 0 [ ] 0 0 0 1 2 0 0 0 0 0 0 1 2 0 0 0 0 0 0 1 2 ν ν ν ν ν ν ν ν ν ν ν ν − − − = − − − D (1.2)
and
{ }
ε denotes the Green-Lagrange strain tensor. The relation between the Cauchy stress and the second Piola-Kirchhoff stress is given by:1
. . . T
J =
σ F S F (1.3)
11
1.4.2 Cross viscosity fluid model
The cross model is a shear rate dependent viscosity model. It is used to model power law type fluids and has a viscosity plateau region at low and high shear rates, respectively. This model was originally developed by Malcom M. Cross in 1965. The Cauchy stress is given by: . 2 ( ) J η γ = σ D (1.4) where D is the rate of deformation tensor, J is the Jacobian. The viscosity η depends on the
equivalent shear rateγ and is given by (Cross, 1965): .
0 ( )γ 1η ηm (1n) η η γ ∞− ∞ − = + + (1.5)
where η0 is the limiting viscosity at zero rate of shear, η∞is the limiting viscosity at an infinite rate of shear, m and n are two independent constants and γ is the rate of shear which . is defined as:
(
2 :)
1.4.3 Elastic fiber model
Figure 1.10 A body in initial state and in the deformed state.
Figure 1.10 shows a body in the initial state and in the final deformed state (Ten Thije, 2007). The fiber strain is determined by (Ten Thije, 2014):
(
)
2 0 1 : / l 2 = 0 0 − ε a a C I (1.7)where a is the initial direction vector of the fiber, and l0 0 are the initial length of the fiber. Finally, the Cauchy stress tensor is calculated by the following (Ten Thije, 2014):
(
)
f 4 0 0 ρ.E : 2ρ l = 0 0 − σ aaa a C I (1.8)where Ef is the Young’s module of fiber and a denotes the final direction vector of the fiber.
1.4.4 Mooney-Rivlin model
The Mooney–Rivlin model for hyper-elastic materials is commonly used in connection with simulations of rubber-like or other polymeric structures in, e.g., analytical or finite element contexts. It is based on the work by Mooney (Mooney, 1940), and Rivlin (Rivlin, 1940). The corresponding stress can be expressed as:
13 2 ij ij ij ∂ ∂ = = ∂ ∂ W W S E C (1.9)
where W is the strain energy, E is the Green strain tensor and C is the right Cauchy Green deformation tensor. We have the following relationship between E and C:
(
)
1 2
= −
E C I (1.10)
where I is the second-order unit tensor. For an isotropic material, W is given by:
(
)
= 1 2 3
W W I ,I ,I (1.11) For an incompressible material, the condition I3=1 must be fulfilled and then we have the
general form as follows:
(
1) (
2)
0 0 3 3 n i j ij i i ∞ = = =
− − W C I I (1.12)For the Money-Rivlin model with only two parameters, the Cauchy stress tensor is given by:
(
1)
10 01 1 . 2C 2C − = − σ B B J (1.13)where C10 and C01 are two parameters and B the left Cauchy-Green deformation tensor.
1.4.5 Fabric reinforced viscous fluid (FRVF) model
The fabric reinforced viscous fluid (FRVF) model is a general form for a viscous material with two fiber directions of reinforcement. The Cauchy stress tensor of a FRVF with two fiber directions is determined by (Spencer, 2000):
(
)
(
)
(
)
(
)
1 T 2 3 4 2 2 . . 2 . . + 2η . . 2η . . a b p T T η η η = − + + + + + + + + + + σ I A B D A D D A B D D B C D D C C D D C (1.14)where η η η η η, , , , 1 2 3 4 are the viscosities, p the pressure, D the rate of deformation tensor, Ta and Tb the tensions of fiber respectively in fiber directions a and b. The viscosities are in general functions of a and b which are related to the angle 2Φ between the two fiber directions by:
. =cos 2Φ
a b (1.15)
The tensors A , B and C are given by:
T
; ; ;
= ⊗ = ⊗ = ⊗ = ⊗
A a a B b b C a b C a b (1.16)
where the symbol ⊗stands for the tensor product, the superscript T denotes the transpose and a , b denote the actual fiber directions related to the initial directions a0 and b0 by:
0 0
. and .
= =
a F a b F b (1.17)
1.4.6 Penalty-polymer model (Ten Thije, 2007)
The penalty-polymer model includes penalty contact in combination with a viscous type of friction. The frictional properties are calculated using the shear deformation of a fluid film, present between the two contact surfaces. The frictional properties depend on the contact pressure and slip velocity. This model is suited for modelling the friction between surfaces, lubricated by molten polymers. The total traction vector τ is calculated as:
p f 0
= + +
τ τ τ τ (1.18)
where τ denotes the contribution of the penalty contact, p τfthe contribution of the fluid film
deformation and τ a constant tangential contribution. The penalty contact is modelled by a 0 penalty formulation: 0 0 p = p τ (1.19)
15
p
p E .δ= (1.20)
with the penalty stiffness and the penetration depth. The traction due to the fluid film deformation is calculated as:
. x . y η. 0 γ γ = f τ (1.21)
in which and are the shear rates in the fluid film defined as follows:
1 x x y y v v h γ γ = (1.22)
where h denotes the thickness of the fluid film and and are the relative slip velocities of the contact surfaces. These are described as:
1 x x y y v u v t u = Δ (1.23)
with △t the time increment and and the relative incremental displacements of the contact surfaces. The viscosity η of the fluid is given by:
η=cp cη (1.24)
in which c is a function to include the effect of the contact pressure p and is given by: p
(
0)
b p
c =a p + p (1.25)
The parameters a , b and c are the fitting parameters. The viscosity of the polymer filmp , is modeled by a cross viscosity model as follows:
( )
0 ( )1 1 c n q C η η γ − = + (1.26)with , C and n the fitting parameters and the equivalent shear rate: 2 2
q x y
γ = γ +γ (1.27)
Some lubricants show a constant level of friction at low slip velocities. A constant tangential traction τ is added to the model to capture this behaviour. The top figure (Figure 1.11) 0 shows the contribution of the two components τ and f τ separately. The bottom figure 0 (Figure 1.11) shows the summed contribution of τ and f τ . 0
Figure 1.11 Constant tangential contribution
A constant c is introduced to create a well-defined transition when the velocity v is 0
reversed. This allows the numerical calculations to run smoother. The proportional tangential traction τ equals: pt 0. 0 x y pt v c v = τ (1.28)
Finally, is calculated by scaling τ if its length exceeds the user supplied scalar value . pt
pt if pt
= ≤
0 0
17 . pt pt pt if = > 0 0 0 τ τ τ τ τ τ (1.30) 1.4.7 Adhesion model
The adhesion model for the contact interface is used to model the 'tackiness' between surfaces. The normal pressure nτ on the contact surface equals:
n t
τ = − (1.31)
where t denotes the tension that keeps the surfaces together. Trigger distances can be set to activate and deactivate the adhesion model.
CHAPTER 2
RESEARCH STRATEGY 2.1 Research objective
The objective of this research is to study the formability of thermoplastic PPS/CF composite material. Based on experimental results, primary material models and their parameters were investigated for the numerical simulation of the stamp forming process. Then, forming simulations were performed to predict the shape deformations in the stamp forming of PPS/CF composite material and to optimize the mould designs for the forming of diverse geometries, a process which would be very difficult to realize by experimental processes, since the costs of mould designs and fabrication are very high.
2.2 Research strategy
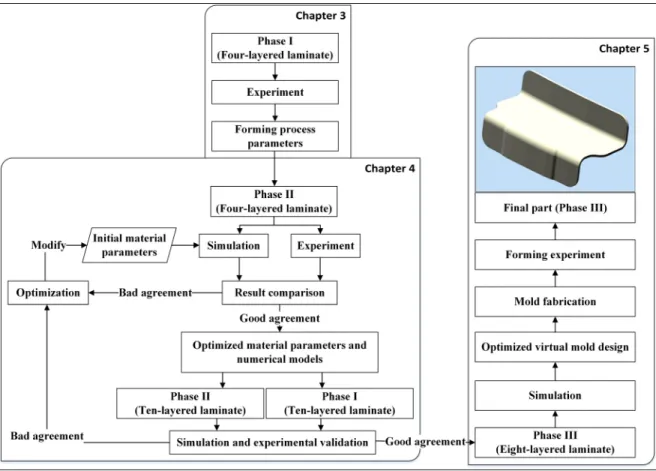
To study the effects of material properties and experimental parameters on the forming results, this research project was divided into three phases, with different forming geometries for each phase as presented in Figure 2.1. These phases progress from a single curvature geometry (phase I) to a double curvature geometry (phase II) and a complex geometry (phase III), which is a real application in airplane structures. In each phase, forming simulations and experiments have been performed for several laminates with different stacking sequences and number of plies, as illustrated in Table 2.1.
Figure 2.2 presents the research strategy. Firstly, forming experiments will be performed for phase I geometry with a four-layer laminate to study the forming process parameters such as blank temperature, mould temperature and forming pressure. Secondly, forming experiments and simulations for phase II geometry with a four-layer laminate will be done. The differences between simulation results and experimental results will be minimized using a simulation-based optimization technique to characterize a subset of material parameters. The
optimized material parameters will be validated by comparing the numerical predictions with the experimental results obtained in phase II with a ten-layer laminate and in phase I with a four-layer laminate. Then, a new series of forming simulations will be performed for a real case of mould design in phase III in which many different shapes and laminate stacking sequences will be investigated.
Table 2.1 Laminate setups for three phases
Phase Stacking sequence Number of plies Thickness (mm)
Phase I (0,90)4 4 1.24
[(0,90)/(±45) /(0,90)/(±45)/(0,90)]s 10 3.1
Phase II (0,90)4 4 1.24
[(0,90)/(±45) /(0,90)/(±45)/(0,90)]s 10 3.1
Phase III [(0,90)/(±45)/(±45)/(0,90)]s 8 2.48
21
CHAPTER 3
FORMING EXPERIMENT OF THE SINGLE CURVATURE SHAPE - PHASE I 3.1 Material properties
The base material used is the pre-consolidated carbon fiber-reinforced polyphenylene sulphide (CF/PPS) commercialized by Royal Tencate Corp. It is composed of a polyphenylene sulphide (PPS) matrix reinforced by carbon fiber. The fiber volume fraction (Vf) is 50% and the stacking sequence is (0, 90)4. The thickness of the four-layer laminate is 1.24±0.02 mm. The blank was 315 mm long and 205 mm wide.
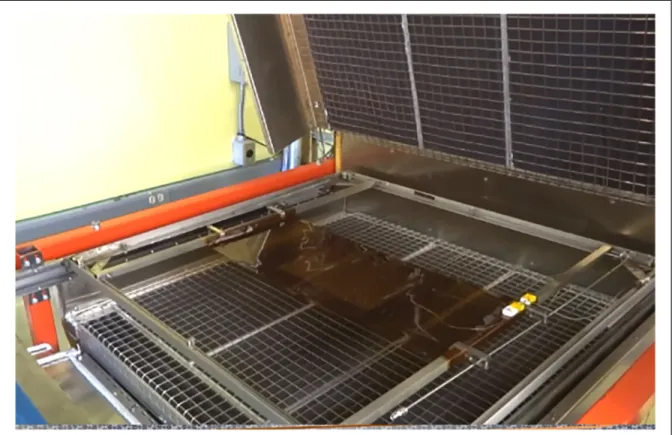
3.2 Experimental process
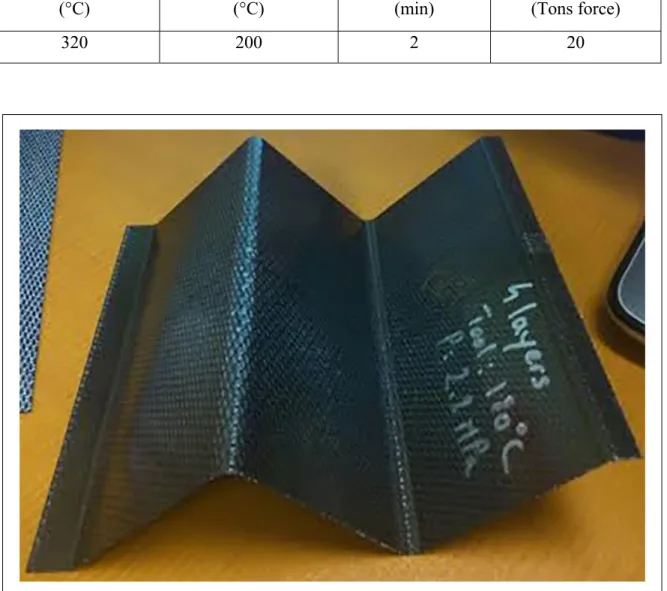
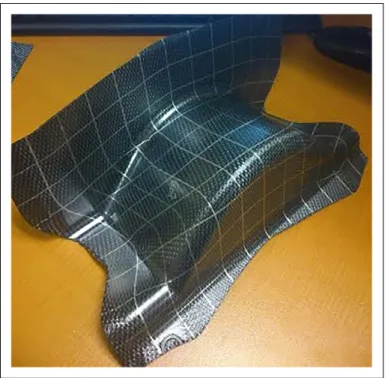
The experimental setup included an infrared oven used as heating unit for the blank. A support frame was used to transfer the blank from the oven to the mould. Moulds were installed on the press and the computer was used to control the forming process. Firstly, the blank was placed onto the Kapton film and centered in the frame. Then the frame was placed in the infrared oven as shown in Figure 3.1. The blank was heated to the temperature of 320 0C, transferred to the press and placed between two half -moulds. The two half- moulds were also heated to 200 0C. The mould was then closed and the blank pressurized in order to form the laminate to the mould geometry, as illustrated in Figure 3.2. Thereafter, the mould cooling- down process was started and maintained up to the moulding temperature. Finally, the mould was opened and the part was removed. The pressing, holding and demoulding processes in the forming station were fully programmed through LabVIEW control system. The experimental parameters are presented in Table 3.1 and the formed part is shown in Figure 3.3. The part surfaces are very smooth without any wrinkles or unwanted distortions.
Figure 3.1 The blank was placed onto the Kapton film.
25
Table 3.1 Experimental processing parameters for forming of phase I Blank temperature (°C) Mould temperature (°C) Holding time (min) Stamping force (Tons force) 320 200 2 20
CHAPTER 4
INVERSE CHARACTERIZATION OF MATERIAL PROPERTIES FOR SIMULATION OF STAMP-FORMING OF MULTI-LAYER THERMOPLASTIC
PPS/CF COMPOSITES*
Abstract
In this paper, the stamp forming of four-layer laminate and ten-layer laminate of PPS/CF composites has been well researched in both experiment and simulation. The effects of numerical model combinations and material properties on forming predictions have been studied. A good numerical model combination for stamp-forming prediction has been investigated. The optimized material properties for forming simulation of multi-layer laminate of PPS/CF composites have been identified using multi-objective optimization technique that minimizes the difference between experimental and numerical results in term of thickness, shear-angle and wrinkle distributions. Intra-ply shear, bending behaviours and the contact logic between the individual plies and between tool-ply have been modelled in these simulations. The predicted results agreed well with the experimental results. The optimized material properties and the studied numerical model combination have been successfully used to predict the forming process for several geometries and different laminate stacking sequences.
Keywords
Composites, modelling, thermoplastic, optimization, stamp-forming, simulation
4.1 Introduction
There are considerable applications of fiber-reinforced thermoplastic composite (FRTPC) materials for aerospace and automotive components. There are many advantageous
* Reproduced from: Hong-Den Nguyen, Xuan-Tan Pham and Martin Deshaies. Inverse characterization of material
properties for modelling of stamp-forming of multi-layered thermoplastic PPS/CF composite. Prepared for Journal of
characteristics of thermoplastic composites compared to thermoset composites. For instance, thermoplastic composite components may be thermoformed with short cycle times. They are highly recyclable and they could be used for remoulding and reshaping. Thermoplastic composites have excellent mechanical properties, high temperature resistance, high impact resistance and good chemical resistance. Thermoplastic composites are also lighter and easier to colour than thermoset materials. These are just some to be named here, but not all. Thanks to their advantages, thermoplastic composites are gradually replacing thermoset composites for laminate fabrication particularly for high volume applications.
However, there are still various difficulties in forming of thermoplastic composite materials. The forming must be performed at elevated temperature and high pressure. High slippages between layers may appear at high temperature due to the change of friction between tool-ply and between ply-ply (Nguyen et al., 2015). Thermoplastic composite forming may create wrinkles and thickness variation in formed parts. The practical difficulties of forming successfully thermoplastic composite components have led to a requirement for understanding the mechanical properties of FRTPC sheets and for the development of computational techniques for process simulations based on these properties. While experimental methods may be used to understand the forming of these materials, numerical simulations offer an efficient and rapid tool to study the mechanism of deformation of FRTPC sheets.
For numerical simulations, it is indispensable to understand the deformation mechanisms of materials during the forming process, to identify the numerical models that could take into account these deformation mechanisms and to determine the material parameters for these numerical models. The deformation mechanisms of thermoplastic composites have been studied in several research papers (Haanappel, 2013; Long, 2007; Ten Thije, 2007). Some mechanical behaviours such as bending behaviour, intra-ply shear and axial loading deformation have been studied as primary deformation mechanisms. Many numerical models have been developed and published during last few years. However, it has not been yet determined how to combine these primary numerical models to better predict a forming
29
process, and this will be the main object of the current research in which the stamp-forming of thermoplastic PPS/ Carbon fiber composite (PPS/CF) is studied. The PPS/CF composite is one of the most frequently used thermoplastic composite materials for aircraft structures. The properties of this material have been investigated in several researches (Díez-Pascual et al., 2012; Liu et al., 2015). However, it is sometimes quite hard to get good values of material parameters just by characterization tests since the stamp-forming process is at high temperature and high pressure. The friction properties are not significant in single-layer forming simulations (Hamila et al., 2013; Hussein et al., 2013), but they are very important in multi-layer forming simulations. It is observed that the friction between tool-ply or between ply-ply is not easy to be measured at this forming condition. On the one hand, this research will study the effect of the material parameters to the forming prediction and identify material parameters using simulation-based optimization technique based on experimental results. On the other hand, forming predictions of different geometries and different laminate stacking sequences for PPS/CF composites using the optimized material properties and the best choice of material model combination will be validated with experimental forming results in terms of wrinkles apparition, thickness distribution and fiber shear angles.
4.2 Forming experiment
Experiments were performed using a stamp-forming system at National Research Council Canada - Aerospace as shown in Figure 4.1. The composite material used in these experiments is the pre-consolidated carbon fiber-reinforced polyphenylene sulphide (CF/PPS) commercialized by Royal Tencate Corp. It is composed of a polyphenylene sulphide (PPS) matrix and carbon fiber fabrics. The fiber volume fraction (Vf) is 50% and the layer thickness is 0.31 mm. The blank was installed in the oven using a frame as shown in Figure 4.2 and it was heated to 320oC. Once the prescribed temperature was reached, the blank was transferred from the oven to the stamp-forming machine and placed between the two half moulds. The mould was then closed and the blank was pressurized with 35
tons-force in order to form the laminate to the mould geometry. Figure 4.3 presents an example of formed part from this system.
Figure 4.1 Stamp forming system
31
Figure 4.3 The formed part 4.3 Deformation mechanisms
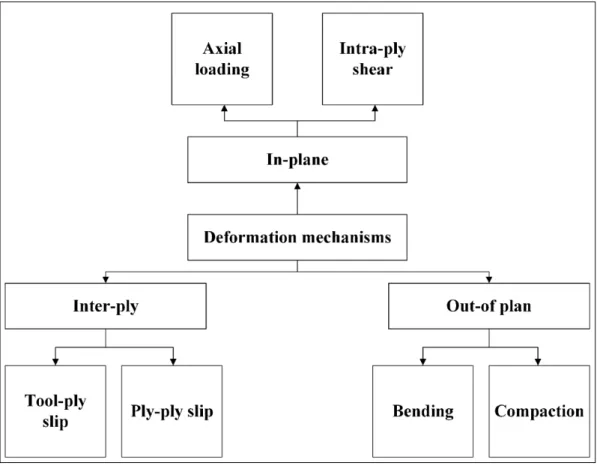
The deformation mechanisms of PPS/CF composite material can be divided into three main categories: plan, inter-ply and out-of-plane mechanisms as depicted in Figure 4.4. The in-plan behaviour includes the axial loading deformation and the intra-ply shear deformation. The intra-ply shear is usually considered as a primary deformation mechanism for aligned fiber-based materials. It includes the longitudinal intra-ply shearing which is the sliding of parallel tows within a composite ply, and the transverse intra-ply shearing which is the rotation of tows at their crossovers (Long, 2007). It is observed that the loading along the fiber axis results in very large forces and low maximum strains in comparison to intra-ply shear. The out-of-plan behaviour includes the bending and the compaction deformation. During the forming process, the friction between the material and forming tools plays an important role in the transfer of loads to the material. In multi-layer forming processes, the friction between individual layers of material is also of importance. The values of friction at ply-tool and ply-ply interfaces are a key factor to simulate accurately the forming process.
Figure 4.4 Deformation mechanisms
4.4 The effects of numerical model combinations on forming predictions 4.4.1 Numerical models and material properties
The simulations with two different material model combinations were performed to study the effects of the material model combinations on forming predictions in order to determine the best choice of numerical model combination for future forming predictions. Table 4.1 shows the numerical models that could take into account the deformation mechanisms of PPS/CF composites. The Isotropic Elastic model (Annin et al., 2015) is used to model the ply bending. The tool-ply and ply-ply contact interactions are modelled by the Penalty-Polymer model (Ten Thije, 2007) and the Adhesion model (He et al., 2013). The difference between two options is the choice of material models used for modelling the in-plane behaviour of the plies as presented in Table 4.1. In option A, the in-plane behaviour was modelled by an
33
assembly of three models: the Fabric Reinforced Viscous Fluid (FRVF) model (Spencer, 2000), the Newton fluid model and the elastic fiber model. Meanwhile, the elastic fiber model (Jones, 1999), the Mooney Rivlin model (Eriksson et al., 2014) and the Cross Viscosity model (Cross, 1965) were used for the in-plane behaviour in the option B. The material characterization tests to identify the material parameters of PPS/CF composites have been carried out in several researches. The current study focused only on the way to find out the best choice of the numerical model combination and to determined material properties through an advanced multi-objective optimization technique based on the initial material properties collected from the literature (Díez-Pascual et al., 2012; Haanappel, 2013; Ten Thije, 2007; Ten Thije et al., 2011; Ten Thije et al., 2007) as shown in Table 4.2.
Table 4.1 Numerical models
Deformation Description Option A Option B
In-plane Axial loading deformation Elastic fiber Elastic fiber Intra-ply shear deformation RFVF Mooney Rivlin
Newton fluid Cross Viscosity Out-of-plan Bending and compaction Isotropic Elastic Isotropic Elastic
Inter-ply Tool-ply slip Penalty-polymer Penalty-polymer
Table 4.2 Material properties Numerical model Material
parameter
Description Unit Value
Isotropic Elastic E Young’s module [MPa] 15000
υ Poisson’s ratio 0.33
Cross Viscosity ηo viscosity at low shear rate [MPa.s] 0.682
η∞ viscosity at high shear rate [MPa.s] 0 Elastic fiber E f Young's modulus of the
fiber
[MPa] 70000
ρ density of the material [kg/mm3] 1350x10-9 Mooney-Rivlin c 10 material constant [MPa] 0.165
01
c material constant [MPa] 0.00524
Newton fluid ρ density of the material [kg/mm3] 1350x10-9
η viscosity [MPa.s] 0.1
Penalty-polymer h film thickness [mm] 0.02
0
η viscosity [MPa.s] 750x10-6
p
E penalty stiffness 1
Adhesion t adhesion [MPa] 0.1
4.4.2 Simulation setup
Figure 4.5 illustrates the stamp-forming simulation setup. Both the mould and the punch were modelled as rigid surfaces with around 20000 triangular elements for each. Meanwhile, each material ply was modelled with 12000 triangular elements. The blank was laminated by four layers of 285 mm long and 241 mm wide with the stacking sequence (0,90)4. The forming process was simulated by moving the punch downward. Firstly, the punch was moved very quickly to the laminate surface. Secondly, the punch was moved downward slowly at the speed of 20 mm/s until the gap between the punch surface and the mould surface was equal to the laminate thickness.
35
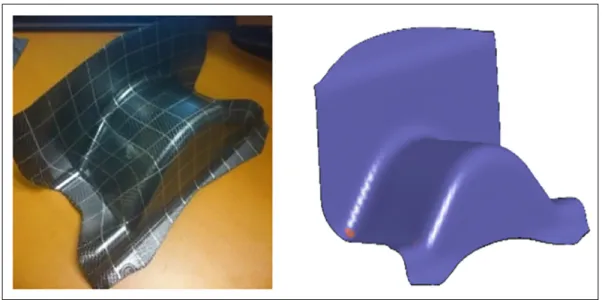
Figure 4.5 Simulation setup 4.4.3 Predicted result and experimental validation
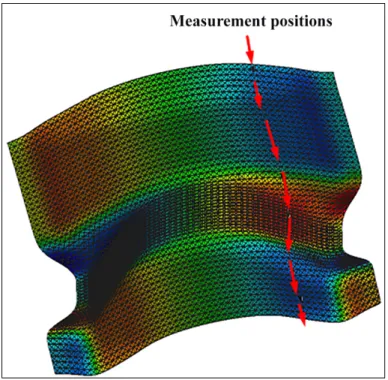
Forming simulations of multi-layer PPS/CF composites were successfully performed. The predicted results in terms of shape deformation and wrinkle distribution agreed very well with the experimental results. There was no wrinkle in the predicted and experimental results as shown in Figure 4.6. The formed parts were cut out to measure the thickness using a digital calliper. Thickness and shear-angle were measured along a line as depicted in Figure 4.7. Fiber orientations were evaluated based on shear-angle values which are the difference between the initial angles and the formed angles between two fiber families. The experimental shear-angles were evaluated based on the initial angles and formed angles between horizontal lines and vertical lines which were drawn onto the blank as illustrated in Figure 4.8.
Figure 4.6 General deformation
The thickness and shear-angle distributions are presented in Figure 4.9 and Figure 4.10, respectively. The predicted results in option B showed a better agreement with the experimental results than that in option A. The initial thickness was 1.24 mm. It was observed that the thickness increased everywhere in the formed part after the deformation. The highest experimental thickness value was 1.36 mm. It increased more than 9.5% in comparison to the initial thickness. The maximum shear-angle measured from the formed part as high as 26 degrees. It was remarked that the choice of numerical models and the combination between them have very high effects to the predicted results. The material model combination that gave the best prediction of PPS/CF composite forming was found as shown in Table 4.1 (Option B).
37
Figure 4.7 Measurement positions
Figure 4.9 Thickness distribution
39
4.5 Inverse material characterization procedure and the effects of material properties on forming predictions
4.5.1 Simulation-based inverse characterization procedure
The best combination of numerical models found in the previous paragraph corresponded to option B in which the primary numerical models and the material parameters were shown in Table 4.1 and Table 4.2, respectively. It is noted that more than thirty material parameters are required in a numerical simulation with Aniform. Some of them were obtained by material characterization tests and the others were found in the literature such as density, Young’s modulus, Poisson’s ratio of this material. It is quite hard if not impossible to get the accurate values for some parameters from material characterization tests, for example, the tool-ply friction, the ply-ply friction or the penalty stiffness between plies for numerical models. In this study, an inverse characterization method using simulation-based optimization technique was employed in order to determine a set of parameters which minimizes the discrepancy between the experimental and predicted results in term of thickness and shear-angle variation. The inverse material characterization procedure is presented in Figure 4.11. In this simulation-based inverse characterization method, the initial values for the optimization procedure are the results of the numerical simulation performed with the initial materials parameters shown in Table 4.2 which are correspondingly for the numerical models of option B as mentioned above. The predicted results are compared with the experimental results through a multi-objective function (Equation 3) in term of thickness and shear-angle values evaluated at a number of positions on the formed part as the following.
Figure 4.11 Simulation-based inverse characterization procedure
The difference between the predicted thickness and the experimental thickness is evaluated by the residual sum of squares:
exp sim 2 ( ) ( ) 1 n F x xj xj j = − = (4.1) where sim j x and exp j
x are the predicted and experimental thickness values at point j and n is the
total number of points used for the evaluation. Similarly, the difference between the predicted shear-angles and the experimental shear-angle is expressed by:
41 exp sim 2 (y) ( ) 1 n F y y j j j = − = (4.2)
where y and simj
exp
j
y are the predicted and experimental shear-angle values at point j. The
multi-objective function is then defined from Equations 1 and 2 as follows:
(x, y) (x) (y)
F =F +F (4.3)
The optimization loop is repeated to minimize this objective function until the convergence criteria are satisfied for that an optimized set of materials parameters are finally identified.
4.5.2 Inverse characterization result analysis
It was observed in the previous paragraph that the numerical results (with option B) using the initial material parameters were slightly different from the experimental results as shown in Figure 4.9 and Figure 4.10. It is due to the fact that it is quite hard to get good values just by material characterization tests for a group of seven material parameters as presented in Table 4.3. The values of these parameters were obtained by inverse characterization. Each parameter is a continuous variable and bounded by minimum and maximum values.
Table 4.3 Material parameters for optimization
Parameter Description Unit Initial Minimum Maximum 1
Ep penalty stiffness tool-blank 1 0.3 1.5
2
Ep penalty stiffness ply-ply 1 0.3 1.5
01
η tool-ply viscosity [MPa.s] 750x10-6 0.0001 0.0009
02
η ply-ply viscosity [MPa.s] 750x10-6 0.0001 0.0009
10
c material constant [MPa] 0.165 0.1 0.25
03
η viscosity of Cross Viscosity model
[MPa.s] 0.682 0.1 0.9
Figure 4.12 Optimization iteration history plot for F x y( , )
Thickness and shear-angle were measured along a line as depicted in Figure 4.7. The variation of the objective function during the optimization process is presented in Figure 4.12. It was observed that the optimization process was successfully completed after twenty-two iterations using the Adaptive Response Surface Method (ARSM) in the Altair Hyper-Study software. The optimized material parameters obtained at the 22th iteration are shown in Table 4.4 for that the thickness and shear-angle variations between the experimental results and the predicted results were minimized. Figure 4.13 and Figure 4.15 present respectively the comparison of the thickness and shear-angle values obtained from the initial set of parameters (1st iteration), the best set (22th iteration), the worst set (13th iteration) together with the experimental results. The differences between the experimental values and the predicted values are illustrated in Figure 4.14 and Figure 4.16. The maximum thickness difference between the predicted thickness and the experimental thickness was only 0.03 mm which is in the range of the manufacturing tolerances as high as 0.03 mm or measurement tolerances up to 0.02 mm. It was observed that the maximum shear angle difference was 7 degrees at the border of the part where the experimental part was affected by the delamination of the laminate and the slippages between plies. Since practically it is not easy to measure the fiber orientations of the formed part, the shear angle measurement tolerances may be as high as 5 degrees in these locations.
43
Figure 4.13 Thickness comparison between iterations
Figure 4.14 Thickness difference between the predicted results and the experimental results
Figure 4.15 Shear angle comparison between iterations
Figure 4.16 Shear angle difference between the predicted results and the experimental results
45
Table 4.4 Optimization results
Iteration Ep 1 Ep 2 η01 η02 c 10 η03 t F x( ) F y( ) F xy( )
1 1.0 1.0 75·10-5 75·10-5 0.165 0.682 0.10 0.0088 639.84 639.85 22 0.9 0.787 0.0009 0.0005 0.190 0.674 0.15 0.0087 593.63 593.64
To evaluate how well the predicted thickness values fit the experimental thickness values, the coefficient of determination, denoted by 2
x R , is calculated as follows: 2 ( ) 1 ( ) x tot F x R F x = − (4.4)
where F(x) is the residual sum of squares which was calculated by Equation (1) and F(x)tot is the total sum of squares defined by the following expression:
exp sim 2 ( ) ( ) 1 tot n F x xj xj j = − = (4.5) in which xsim
j is the predicted thickness value at node j and expxj denotes the mean of the
experimental thickness values:
1 1 exp n exp xj xj n =
(4.6)The coefficient of determination 2
x
R was calculated at two iterations and was presented in Table 4.5. The coefficient of determination increased from 0.750 to 0.767 at the end of the optimization. It means that a better agreement in average was found between the predicted and experimental data by the inverse characterization technique. Similarly, the coefficient of determination for evaluating the shear angle distribution was presented in Table 4.6 where
( )
F y the residual sum of squares which was calculated by equation (2), F(y)tot the total sum of squares and 2
y
observed that the coefficient of determinationsR was very close to 1. If the coefficient of 2y
determinations is equal to 1, it means that there is no difference between the experimental values and the predicted values. However, there are always the manufacturing tolerances, the measurement tolerances or the limitation of the computational modelling.
Table 4.5 Coefficient of determination for evaluating the thickness distribution
Iteration F x( ) F x( )tot 2
x R
1 0.0088 0.0350 0.750
22 0.0087 0.0371 0.767
Table 4.6 Coefficient of determination for evaluating the shear angle distribution
Iteration F y( ) F y( )tot 2
y R
1 639.8 9103.7 0.930
22 593.6 9013.9 0.934
4.6 Validation of optimized material properties and numerical models in term of wrinkle distribution.
The optimized material parameters were found in the previous paragraph as shown in Table 4.4. However, these data need to be validated again to make sure that they could be used for different geometries and different laminate stacking sequences to predict the quality of formed parts particularly the apparition of wrinkles. Two new cases of stamp-forming were performed. The first one was with a new mould design for a ten-layer laminate with the stacking sequence [(0, 90)/ (±45) / (0, 90)/ (±45)/ (0, 90)]s and the second one was with a new mould design for a four-layer laminate. A good agreement was found between the experimental and predicted results in term of wrinkle distribution as shown in Figure 4.17 and Figure 4.18 respectively for the ten-layer part and the four-layer part. This demonstrated
47
that the optimized material parameters for the selected numerical model combination (option B) are good enough and can be used for general cases of forming of PPS/CF composites.
Figure 4.17 Wrinkle comparison between the experimental and predicted results of the ten-layer part
Figure 4.18 Wrinkle comparison between the experimental and predicted results of the four-layer part
4.7 Conclusions
The results in this study showed that the stamp-forming simulations of multi-layer PPS/CF composites were successfully performed to predict the quality of formed parts in terms of shape deformation, fiber orientations and thickness distribution. Very good agreements between predicted and experimental results were found in this work. Especially, the prediction of wrinkles was well validated with the experimental results for both
stamp-forming of the ten-layer laminate and the four-layer laminate. It was observed that the choice of primary numerical model combination for the modelling of deformation mechanisms was a key factor for the success of the numerical simulations. It was demonstrated that the simulation-based optimization technique for inverse characterization is an excellent method to determine material parameters particularly when it is very hard to obtain parameters from characterization tests. This method is very promising for the future work when dealing with different geometries and laminate stacking sequences.
CHAPTER 5
SIMULATION-ASSISTED MOULD DESIGN FOR THE FORMING OF PPS/CF COMPOSITE MATERIALS
5.1 Mould design for the stamp forming (Phase II) with the ten-layer laminate*
5.1.1 Virtual mould design with numerical parametric study
The forming of the ten-layer laminate was performed in both experiments and numerical simulations. The preliminary results shown in Figure 4.17 of Chapter 4 exhibited high shear-angle values and wrinkles in the formed part. A new mould design is required for the forming of the ten-layer laminates to avoid wrinkles. A numerical parametric study with two parameters, the forming angle β and the angle α, as shown in Figure 5.1 was performed to optimize the mould design. Several virtual moulds with different dimensions were suggested in Table 5.1.
Table 5.1 Virtual mould dimensions
Mould name A B C D E F
α 45o 56o 74o 82o 76o 90o
β 33o 35o 33o 52o 55o 57o
* Reproduced from: Nguyen, H. D., Deshaies, M. & Pham, X. T. Simulation-assisted mould design for the forming of
Figure 5.1 Mould geometry
It was observed that the fiber shear angle increases with α and β as shown in Table 5.2. The limit of the mould design for this mould shape without wrinkles corresponds to the mould C. The simulation setup of the mould C is illustrated in Figure 5.2. Thickness and shear angle distributions are shown in Figure 5.3. The highest predicted shear angle was 24 degrees and the highest thickness was 0.338 mm, with an increase of 9% in comparison to the initial thickness of 0.31 mm.
Table 5.2 Simulation results
Mould A B C D E F
α 45o 56o 74o 82o 76o 90o
β 33o 35o 47o 52o 55o 57o
Highest shear angle 15 o 21o 24o 50o 60o 83 o
51
Figure 5.2 Simulation setup of mould C
Figure 5.3 Forming predicted results of the mould C: (a) Shear angle; (b) Thickness 5.1.2 Mould design to avoid friction force
Based on the optimized angle α and angle βof the virtual mould C, a new virtual mould, named mould C2, was designed by taking into account the fabrication of the mould. This mould had the same forming angle β and angle α as the mould C. However, the surface of the mould C2, which was in fact the contact area between the mould and the laminate during the forming process, was different from the surface of the mould C, with two additional contact areas, the surface 1 and the surface 2 as illustrated in Figure 5.4. A forming simulation of the mould C2 was performed to study the effect of the friction at the surface 1 and the surface 2 on the forming process. Figure 5.5 shows the forming simulation setup. The predicted thickness and shear angle distributions are presented in Figure 5.6. The highest shear angle was up to 53 degrees in the forming prediction of the mould C2, while it was only 24 degrees in the forming prediction of the mould C. The highest thickness was 0.5216 mm, an increase
of more than 68 per cent in comparison to the initial thickness of 0.31 mm. It is necessary to minimize the areas of the surface 1 and the surface 2 to reduce to the friction force that was created by the contact between these surfaces and the laminate during the forming process.
Figure 5.4 Mould C2
53
Figure 5.6 Forming prediction of the mould C2: (a) Shear angle; (b) Thickness
Figure 5.7 Real mould design (a) Two half- moulds; (b) The mould installed in the press A real mould as shown in Figure 5.7 was fabricated with the minimized areas of the surface 1 and the surface 2 to reduce the friction force. However, due to the presence of the two guiding pins, a part of the surface 1 and surface 2 could not be removed, as depicted in Figure 5.8. Due to the limitation of this project, the size of the mould could not be changed and the impact of the pin locations on the forming results was inevitable.