1
Comparing journal and paper level classifications
of science
Abstract
The classification of science into disciplines is at the heart of bibliometric analyses. While most classifications systems are implemented at the journal level, their accuracy has been questioned, and paper-level classifications have been considered by many to be more precise. However, few studies investigated the difference between journal and the paper classification systems. This study addresses this gap by comparing the journal- and paper-level classifications for the same set of papers and journals. This isolates the effects of classification precision (i.e., journal- or paper-level) to reveal the extent of paper misclassification. Results show almost half of papers could be misclassified in journal classification systems. Given their importance in the construction and analysis of bibliometric indicators, more attention should be given to the robustness and accuracy of these disciplinary classifications schemes.
1. Introduction
Classification systems of science plays an important role in bibliometrics(De Bellis, 2009; Glänzel & Schubert, 2003). They assign scholarly literature to research areas, topics, and disciplines, which allows to describes the structure and historical development of disciplines (Young & Belanger, 1983),
categorize research production (Melkers, 1993), and can be used to normalize bibliometric indicators (Moed, 2005). Classification system of science are usually applied to scholarly journals (hereafter referred to as journal classification). This has well-known limitations since, for example, papers published in multidisciplinary journals—such as Science, Nature, and PNAS—cannot be properly
classified at the journal level. Several recent studies constructed classification systems at the paper-level (hereafter referred to as paper classification) (Boyack & Klavans, 2010; Boyack et al., 2011; Klavans & Boyack, 2017b; Waltman & Eck, 2012), but their accuracy is difficult to evaluate without a “golden standard” (Waltman & Eck, 2012, p. 2390). Although the accuracy of the classification system of science is questioned at both journal- and paper-levels, no study yet isolated and compared these classification systems between both levels using the same classification scheme and the same dataset. This study begins to address this gap by using a single dataset that contains both journal and paper classifications to reveal their respective effect on the structure of science.
2. Background
Classification systems of science are widely used in bibliometric studies, not only for retrieval of papers, but also as a critical variable to normalize scientific evaluations and indicators across the different research practices of the various disciplines. Normalizing citation impact based on journal classification systems has become an established practice in evaluative bibliometrics (Zhang, Janssens, Liang, & Glänzel, 2010); however, these systems have known drawbacks. Leydesdorff and Bornmann (2016) indicate that WoS categories do not provide sufficient analytical clarity to carry bibliometric
normalization in evaluation practices because of indexer effects. For instance, when an indexer adds a new discipline to a journal for the purpose of information retrieval, it generates between discipline
2
citations and influence measurements that are based on bibliometric normalizations (Rafols &
Leydesdorff, 2009). Janssens, Zhang, De Moor, and Glänzel (2009) also find that some Essential Science Indicators (ESI) subject areas are not coherent enough in terms of the cross-citation and textual evaluation, and produce a list of inappropriate journal classifications. The issue is more serious when measuring interdisciplinarity, which is often operationalized as a measure of diversity in disciplines assigned to the article’s references (Zhang, Rousseau, & Glänzel, 2016); an inaccurate disciplinary assignment within the classification system of science may cause bias, especially if there is a significant proportion of multidisciplinary journals in the reference list (Zhang et al., 2010).
2.1. Classification Systems of Science
Most classification systems of science are established at journal level, which has been adopted by major bibliographic databases such as WoS and Scopus. Using such classification systems, all papers published in a given journal are classified in the same discipline (or set of disciplines).. On the other hand, Chinese bibliographic databases classify science at the paper-level using the Chinese Library Classification Scheme, which allows for a greater level of classification specificity since papers published in the same journal can be classified into different disciplines.
2.1.1. Journal Classification Systems
The most well-known journal classification system is the WoS Categories that assigns indexed journals to about 250 categories representing the full spectrum of scientific research (Leydesdorff & Rafols, 2009). Based on the citation pattern and selection by experts, journals are assigned to one or multiple WoS categories (Pudovkin & Garfield, 2002) but the detailed methodology has never been published. In addition to WoS categories, WoS also offers two other classification systems: WoS Research Area (SU) consisting of around 150 research areas (hereafter referred to as WoS SU) and Essential Science Indicators (ESI) including 22 subject areas. Alternatively, Scopus offers a 2-level journal classification system consisting of 27 major disciplines and 304 minor disciplines, but does not reveal any information regarding how this system is built.
There are other journal classification systems in addition to WoS and Scopus. The US National Science Foundation (NSF) classification system is also a 2-level journal classification system consisting of 14 broad fields and 144 fine fields, but it assigns each individual journal into only one single field (Javitz et al., 2010). This exclusive classification is also adopted by the Science-Metrix classification system, which is a 3-level journal classification system including 6 domains, 22 fields and 176 subfields (Archambault, Beauchesne, & Caruso, 2011). Glänzel and Schubert (2003) have designed a 2-level Leuven-Budapest (ECOOM) subject-classification scheme including 15 fields and 64 subfields1 and have reassigned WoS journals into this classification system. Börner et al. (2012) have mapped the science using both WoS and Scopus data and have established the UCSD (University of California, San Diego) classification system that consists of 13 disciplines and 554 subdisciplines. In addition, some countries maintain their own journal classification system (e.g., the Australian and New Zealand Standard Research Classification (ANZSRC)2, the Chinese Journal Classification3, etc.) mainly for national research evaluation.
1 The updated version of ECOOM consists of 16 fields and 75 subfields.
2 http://www.arc.gov.au/australian-and-new-zealand-standard-research-classification-anzsrc 3 http://clc.nlc.cn/ztfbb.jsp
3
2.1.2. Other Classification Systems
Already in 1975, Garfield, Malin, and Small (1975) introduced an automatic classification system of science that could classify papers on the basis of their citation patterns. Following this, several studies have constructed paper classification systems in which publications are clustered into disciplines based on citation analysis techniques such as direct citation, bibliographic coupling, co-citation and hybrid methods (Shu, Dinneen, Asadi, & Julien, 2017). These provide measures of document similarity where documents judged adequately similar (e.g., 95% similar) are grouped to form a structure of science (Griffith, Small, Stonehill, & Dey, 1974; Small & Griffith, 1974). For example, the ECOOM classification system assigns multidisciplinary journal papers to specific subfields based on their references (Glänzel & Schubert, 2003). Based on the UCSD classification system. Klavans and Boyack (2017a) have assigned over 58 million papers into more than 91,726 research areas based on their direct citation links. The same methodology has been also adopted by Elsevier to classify Scopus documents into roughly 97,000 paper-based “topics”.On the basis of 97.6 million citations received by 10.2 million publications,
Waltman and Eck (2012) have developed a methodology to construct a 3-level paper classification system that consists of 20,672 and 22,412 research areas. In the Leiden Ranking, each WoS publication has been assigned to one of the 4,047 fields based on a large-scale analysis of citation relations between publications. However, no study constructs the classification systems at both journal level and paper level using the same methodology and compares the difference. In other words, this is the first study comparing the classification system between journal level and paper level based on the same data set using the same classification scheme.
Library classifications also groups scientific literature in books and monographs, but it is rarely applied at the journal level or paper-level. Although the U.S. Library of Congress classification (LCC)4 is the most widely-accepted classification system, it is used predominantly in research and academic libraries to classify physical books and monographs into a single discipline for the purpose of establishing a unique address on a shelf for that book, rather than classifying journal articles. Shu et al. (2017) present a methodology that classifies the scientific literature into disciplines of the Library of Congress Subject Headings (LCSH), but LCSH is not applied at the paper-level. Medical Subject Headings (MeSH)5 is a candidate classification since it is applied to both journal articles and books, but findings based on this single domain classification are difficult to generalize to disciplines beyond the medical sciences. One can expect that the Chinese Library Classification (CLC)6 is a good candidate that can be used to construct the classification system of science, at both the journal-level and the paper-level. This offers an opportunity to compare the classification system of science between the journal-level and the paper-level from the same data set using the same classification scheme, which has never been done by previous studies.
2.2. Chinese Library Classification
The Chinese Library Classification (CLC) is the national library classification scheme of China7 (Zhongguo Tushuguan Fenleifa [Chinese Library Classification], 2010) that has been used by the education system, research institutions, as well as public libraries since 1975. It is also used by publishers in China to
4 https://www.loc.gov/catdir/cpso/lcc.html 5 https://www.nlm.nih.gov/mesh/
6 http://www.ztflh.com/
7 In this study, China refers to the mainland China, which is the geopolitical area under the direct jurisdiction of the People's Republic of China excluding Hong Kong and Macau.
4
classify all publications including books, monographs, and journals. CLC is designed to produce an alphanumeric representation of the publication’s main topic as well as the discipline to which it belongs. The first version of CLC was published in 1975; and the recent version V was adopted in 2010. No addition and change is made before the launch of new version, which will post all updates to the old version. CLC should not be confused with the Disciplinary Classification and Code (DCC)8 and the China Subject Categories by State Council of China (CSSC)9, which are designed for the purpose of
administering other parts of the education system.
2.2.1. Chinese Library Classification Code (CLC Code)
CLC is analogic to Library of Congress Classification (LCC) in the United States, in that it also provides a tree structure consisting of small group of top categories (22 in the case of CLC) and their
sub-categories. Each category or sub-category is represented by its name or label, as well as, an alpha-numeric CLC Code (i.e., letters in Latin alphabet and Arabic numbers). The CLC code is composed of one or two uppercase letters and an Arabic whole number of up to three digits (1-999) that can have decimal extensions. A hyphen can be used to represent further discipline specificity.
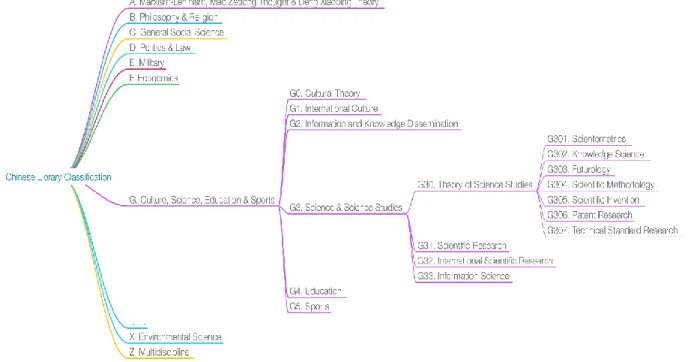
The 22 top categories are denoted by single capital letters, and a combination of letters and numbers to express sub-categories. Figure 1 presents an example of a 4-level CLC tree structure indicating that Scientometrics (G301) is the fourth level category when following the succession of Culture, Science, Education & Sports (G) – Science & Science Studies (G3) – Theory of Science Studies (G30) –
Scientometrics (G301).
Figure 1 Example of CLC tree structure
8 http://dean.pku.edu.cn/urtpku/yjxk.html
5
2.2.2. CLC Code Assignment
In China, CLC is used to classify all academic journals, but also legal publications, books, and newspapers. A Chinese Serial Number (CN) is legally required for each academic journal published in China10. A CN is assigned by State Administration of Press, Publication, Radio, Film and Television of The People’s Republic of China (SAPPRFT) upon request. A CN consists of the registration number and the
classification code, which is the CLC classification code, separated by slash “/” (General Administration of Press and Publication of China, 1989). In practice, the publisher needs to provide a CLC code based on the nature and scope of the journal when applying for the CN. The SAPPRFT will approve the application and assign a CN accordingly.
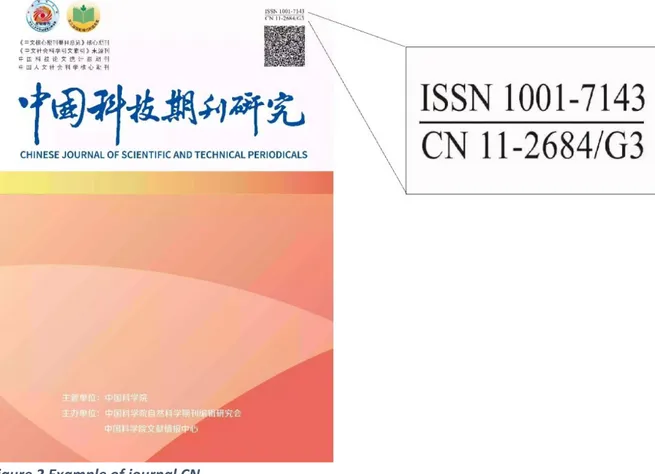
Figure 2 presents an example where the ISSN (1001-7143) and the CN (11-2684/G3) of the Chinese Journal of Scientific and Technical Periodicals are printed in the top right corner of the cover page. In this example, 11-2684 is the registration number while G3 is its classification code corresponding to Science & Science Studies in the CLC. Thus, each journal could be classified into different disciplines in a journal classification system of science based on its CLC code.
Figure 2 Example of journal CN
The CLC code is also applied to each journal article. This is generally done by asking authors to provide the CLC code when submitting their manuscript. Authors are meant to self-identify the major topic of the manuscript and assign the appropriate CLC code based on the CLC instructions. In some cases, the
6
editor may modify the CLC code provided by the authors if she or he believes this improves the
classification. Assigning CLC codes at the paper-level is a normal practice in China’s academic publishing process, and the CLC codes are assumed to represent the paper topic’s discipline(s).
Figure 3 shows an example of a paper’s CLC code, which is included in its bibliographic information. The CLC code G301 means that this paper published in journal Studies in Science of Science is identified by the author as a Scientometrics (G301) paper. This dual and independent classification of the journal and its individual articles entails that articles can be classified in disciplines that differ from the journal’s CLC code. Note that the CLC’s alphanumeric structure permits classification at different abstraction levels. For example, the paper above could also be identified as a Culture, Science, Education & Sports (G) paper, or a Science & Science Studies (G3) paper, or a Theory of Science Studies (G30) paper.
Figure 3 Example CLC Code of journal article
CLC codes provide a classification system of science at both the journal- and the paper-level, for the same set of bibliographic records. It is noteworthy that all Chinese citation databases classify at the paper-level, which is in sharp contrast with major international citation databases, such as WoS and Scopus, who classify at the journal-level. Paper-level CLCs classify individual papers into author-specified disciplines that can differ from the CLCs of their publishing journals. This means that two papers
published in one journal may belong to different disciplines, and papers within the same discipline may be published by journals from different disciplines. Paper-level CLCs has the potential to produce a more specific and representative description of the structure of science.
7
2.3. Chinese Science Citation Database (CSCD)
Journal/Paper classification is also offered by the Chinese Science Citation Database (CSCD), which was developed by the Chinese Academy of Sciences (CAS) in 1989. It covers more than one thousand core journals in the natural sciences, engineering and medical sciences; including mathematics, physics, chemistry, life science, earth science, agricultural science, medicine, industrial technology, and environmental sciences. It offers information retrieval features, journal selection and academic
performance evaluation that are comparable to Science Citation Index (SCI) (Jin & Wang, 1999). In 2007, the CAS cooperated with Clarivate (known then as Thomson Reuters) to provide access to CSCD from WoS.
There are two paper classification systems in CSCD. The original one is based on the paper’s CLC code and, therefore, each paper can be assigned different disciplines; these papers also could be grouped into different WoS SUs using a conversion table (provided by Clarivate Analytics) that matches CLC codes to their corresponding WoS SU(s). CSCD users can strictly access data classified by WoS SU while the CLC-based paper classification system is only for internal reference.
2.3.1. CSCD Journal Classification
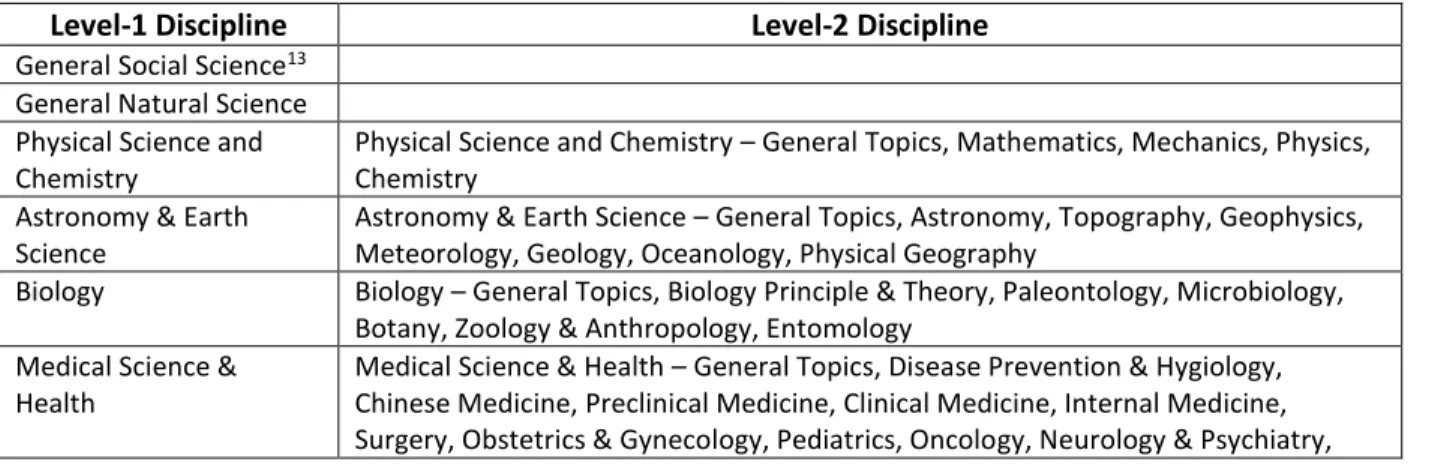
In addition to the CLC-based paper classification system, a CLC-based journal classification system is also internally used for journal selection and evaluation in CSCD. This provides an opportunity to compare the paper classification system with the journal classification system from the same data set. According to the National Science Library of Chinese Academy of Science (2017), this journal classification system is established on the basis of CLC top categories (level-1 disciplines) as well as their direct sub-categories (level-2 disciplines). Based on direct citation analysis and clustering techniques, CAS merges some similar but small disciplines and produces a journal classification system with 12 level-1 disciplines and 66 level-2 disciplines11 as shown in Table 1. For example, the level-2 discipline Geography (CLC code: K9) has been merged into another level-2 discipline Physical Geography (CLC code: P9)12. Eventually, all journals are assigned to a single level-2 discipline except for about 4% of journals that are assigned to more than one level-2 discipline (National Science Library of Chinese Academy of Science, 2015). Table 1 list of disciplines in CSCD journal classification system
Level-1 Discipline Level-2 Discipline
General Social Science13 General Natural Science Physical Science and Chemistry
Physical Science and Chemistry – General Topics, Mathematics, Mechanics, Physics, Chemistry
Astronomy & Earth Science
Astronomy & Earth Science – General Topics, Astronomy, Topography, Geophysics, Meteorology, Geology, Oceanology, Physical Geography
Biology Biology – General Topics, Biology Principle & Theory, Paleontology, Microbiology, Botany, Zoology & Anthropology, Entomology
Medical Science & Health
Medical Science & Health – General Topics, Disease Prevention & Hygiology, Chinese Medicine, Preclinical Medicine, Clinical Medicine, Internal Medicine, Surgery, Obstetrics & Gynecology, Pediatrics, Oncology, Neurology & Psychiatry,
11 Since no level-2 discipline is underGeneral Social Science, General Natural Science, Transportation, Aviation &
Aerospace, and Multidiscipline, these five level-1 disciplines will also be investigated as level-2 disciplines.
12 CAS does not provide detailed methodology regarding its direct citation analysis and clustering techniques. 13 Although CSCD is a science citation database, three journals are classified as General Social Science journals.
8
Dermatology & Venereology, Otorhinolaryngology, Ophthalmology, Dentistry, Special Medicine, Pharmaceutical Science
Agricultural Science Agricultural Science – General Topics, Agricultural Basic Science, Agricultural Engineering, Agronomy, Plant Protection, Horticulture, Forestry, Animal Science & Veterinary Medicine, Fisheries
Engineering & Technology
Engineering & Technology – General Topics, General Engineering & Technology, Mining Engineering, Petroleum Engineering, Metallurgical Engineering, Metal Science, Machinery & Instruments, Military Science, Energy & Power Engineering, Nuclear Science & Technology, Electrical Engineering, Electronic Technology & Telecommunications, Automation & Computer Technology, Chemical Engineering, Light Industry, Architecture, Hydraulic Engineering
Transportation Aviation & Aerospace Environmental & Safety Science
Environmental & Safety Science – General Topics, Safety Science Multidiscipline
2.3.2. WoS Research Area (WoS SU)
WoS SUs is a subject classification scheme that is shared by all WoS product databases. As a result, users can identify, retrieve and analyze documents from multiple databases that pertain to the same subject. For example, journals covered by the WoS Core Collection are assigned at least one WoS category, and each WoS category can be mapped to one WoS SU.
WoS SUs include 151 research areas that are classified into five major research domains: Arts Humanities, Social Sciences, Life Sciences Biomedicine, Physical Sciences, and Technology. 683 CLC categories in four levels could be matched to 89 out of 151 WoS SUs (11/14 in Arts Humanities, 10/24 in Social Sciences, 41/75 in Life Sciences Biomedicine, 12/18 in Physical Sciences, and 15/20 in Technology) through a conversion table provided by Clarivate. Thus, the comparison between the paper classification system and the journal classification system can also be conducted under the WoS SU since CSCD indexed papers and journals can be matched with corresponding WoS SUs. Please note that 62 WoS SUs are not matched because of some inconsistencies between CLC categories and WoS SUs. For example, Engineering and Instruments & Instrumentation are different SUs under the research domain
Technology in WoS while Instruments & Instrumentation (CLC code: TH) is a subcategory of Engineering (CLC code: T) in CLC; Clarivate directly matches CLC category Instruments & Instrumentation to WoS SU Engineering instead of Instruments & Instrumentation. As a result, all Instruments & Instrumentation literature are labeled Engineering in CSCD in which the category Instruments & Instrumentation does not exist. All matches as well as modifications are applied to both journal and paper level so that the
comparison is still based on the same data set using the same classification scheme.
Since both the paper classification system and the journal classification system are available in CSCD, each CSCD indexed paper can be assigned to the corresponding discipline(s) from either classification system. Thus, we can compare the two classification systems and investigate the difference within the same CSCD data set. CSCD is also available from WoS using their own classification (WoS SU), both at the journal- and paper-level. As a result, this study compares journal and paper classification for the same data, across two different classification schemas (i.e., CSCD CLC, and WoS SU).
9
3. Research Questions
The objective of this paper is to compare journal classification systems and paper classification systems, using a dataset that offers both levels of classification. This study improves our understanding in the specificity of the classification system of science by answering the following research questions:
1. In a journal classification system, what percentage of journal articles, in a given discipline, are contributed to by other disciplines?
2. In a paper classification system, what percentage of papers in a given discipline are published in journals in other disciplines?
3. Do these ratios vary by discipline?
Answering these questions will likely reveal the extent of paper misclassification in current journal classification systems, which has never been systematically investigated and may lead to restructuring the classification system of science used in bibliometric studies.
4. Data and Methods
The following sections describe the datasets and their treatment, followed by the measures used to answer the research questions.
4.1. Data
All CSCD data was provided by the National Science Library of the Chinese Academy of Science. The number of journals indexed by CSCD between 2008 and 2015 was 1,480, from which 869 were indexed throughout that period. The raw data analyzed by this study was 1,830,307 CSCD records of papers published in these 869 journals between 2008 and 2015, of which 0.1% (2,035/1,830,307) were excluded because their CLC codes were not available. Note that 6.2% of these papers
(113,917/1,830,307) contained multiple CLC codes; this means that those papers might be classified into multiple disciplines in the paper classification system.
The 869 journals were assigned to 12 level-1 disciplines and 66 level-2 disciplines as shown in Table 1. Of these journals, 31 (3.6%) were assigned to 2 or 3 level-2 disciplines while 838 journals (96.4%) were assigned to a single level-2 discipline. No journal was assigned to more than one level-1 discipline, and 6.2% (54/869) of journals were English language journals, while the rest were published in Chinese.
4.2. Methods
Based on the CLC-codes, each paper is assigned to the corresponding discipline(s) from the paper classification system. For journal classification, each paper is assigned to the same discipline(s) of its journal, which is compared to the higher specificity offered by paper-level classification to reveal differences and similarities.
4.2.1. CLC-based System
As described above, all journals, as well as their papers, were assigned to 12 level-1 disciplines and 66 level-2 disciplines in the journal classification system. The less controlled nature of paper-level classification, that is performed by authors, is highlighted by the fact that there is no requirement for author(s) to provide CLC-codes at a specific CLC level of abstraction. Indeed, paper CLC codes abstraction levels vary: among the 1,830,307 papers investigated, 24.1% (441,383) contain a CLC code representing a level-1 or level-2 CLC level, while 75.9% (1,388,924) include a CLC code at level 3 or below.
10
To compare journal- and paper-level classification, the same structure of the CSCD journal classification system (12 level-1 disciplines and 66 level-2 disciplines) was adopted to build the paper-level
classification. As a first step, papers with a CLC code at level 3 or more were re-assigned to their parent or grandparent level-2 CLC disciplines; for example, a paper with a CLC code G301 was assigned to the level-2 discipline Science & Science Studies (G3) instead of the original assignment to the level 4
discipline Scientometrics (G301). Secondly, all papers assigned to level-2 disciplines beyond the selected 66 level-2 journal-level disciplines were re-assigned to their parent level-1 discipline(s). For example, the paper assigned to the level-2 discipline Science & Science Studies (G3) was re-assigned to the level-1 discipline Culture, Science, Education & Sports (G), since the former is not included in the list of 66 level-2 disciplines. This method of reassignment to broader or more general abstraction levels, has been used in library classification mapping where its robustness has been confirmed (Shu et al., 2017). Finally, 11 level-1 disciplines in social science and humanities were merged to two level-1 disciplines: General Social Science corresponding to CLC codes starting with B, C, D, E, F, G and Arts and Humanities14
corresponding to CLC codes starting with A, H, I, J, K. For example, all papers assigned to Culture, Science, Education & Sports (G) were moved to General Social Science.
As a result, papers classified at the journal- or paper-levels were modified to fit in the same structure of 12 level-1 disciplines and 66 level-2 disciplines. The outcome of the data treatment is the same set of papers assigned to the same disciplines in two different ways: the paper-level based on their own CLC codes, and the journal-level based on the publishing journals’ CLC codes. Since the paper CLC codes provided by authors represent authors’ self-identification of the paper’s discipline(s), it is assumed that the paper level classification is more accurate than the journal level classification in terms of the discipline(s) assignment.
4.2.2. WoS SU-based System
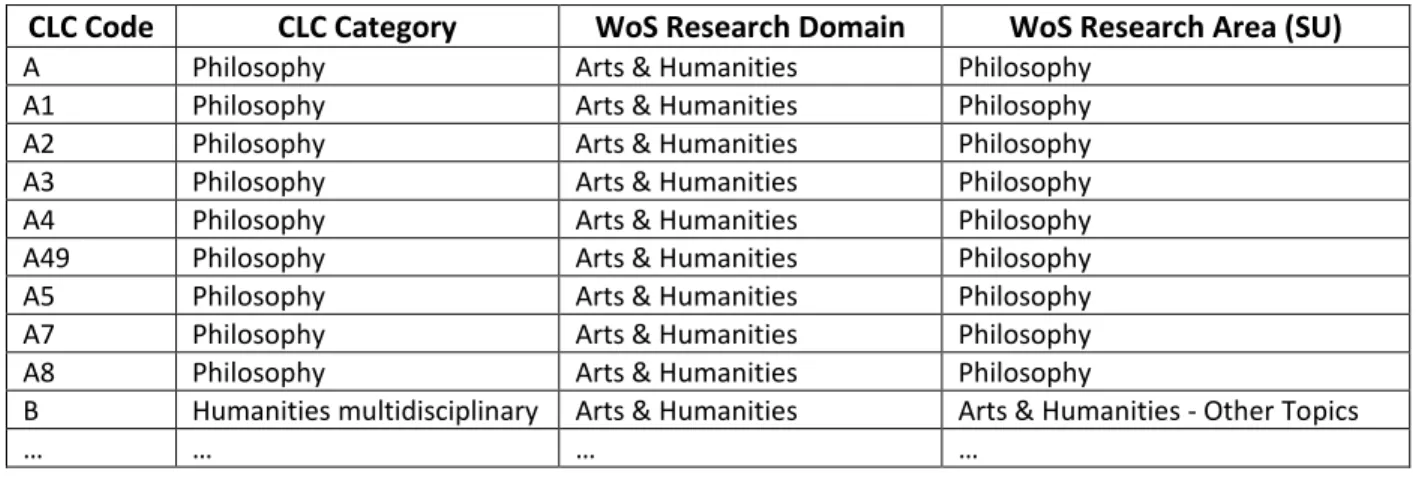
Since the CLC categories can be converted to the corresponding WoS SUs via the conversion table (see the sample as Table 2), we can conduct the same journal- vs. paper-level comparison with the WoS SU structure. To achieve this, all CSCD indexed journals and papers were respectively assigned to
corresponding disciplines in the WoS SUs with some modifications made to render the disciplinary structures consistent across both classification systems (i.e., CLC and WoS SU).
Table 2 The sample Chinese Library Classification - WoS Research Area conversion table
CLC Code CLC Category WoS Research Domain WoS Research Area (SU)
A Philosophy Arts & Humanities Philosophy
A1 Philosophy Arts & Humanities Philosophy
A2 Philosophy Arts & Humanities Philosophy
A3 Philosophy Arts & Humanities Philosophy
A4 Philosophy Arts & Humanities Philosophy
A49 Philosophy Arts & Humanities Philosophy
A5 Philosophy Arts & Humanities Philosophy
A7 Philosophy Arts & Humanities Philosophy
A8 Philosophy Arts & Humanities Philosophy
B Humanities multidisciplinary Arts & Humanities Arts & Humanities - Other Topics
… … … …
14 No Arts and Humanities Journal in CSCD but some papers are identified by their authors as Arts and Humanities papers.
11
X7 Environmental sciences Life Sciences & Biomedicine Environmental Sciences & Ecology X8 Environmental sciences Life Sciences & Biomedicine Environmental Sciences & Ecology X9
Public environmental
occupational health Life Sciences & Biomedicine
Public, Environmental & Occupational Health
Using the conversion table, 869 journals were assigned to 42 WoS SUs in the journal classification system, while 1,830,307 papers were assigned to 86 WoS SUs in the paper classification system, except for 51 papers which CLC-codes were not convertible. Lastly, 41 WoS SUs were found in both the classification systems. Three journals were assigned to Arts & Humanities - Other Topics15 but no paper was assigned to this WoS SU; on the other hand, 309,361 papers (16.9%) were assigned to 45 WoS SUs in which no journal was assigned.
A modification was made to keep the same structure in both classification systems for the comparison. First, these 309,361 papers were re-assigned to WoS SUs included in both classification systems based on their CLC codes at upper level(s). For example, a paper with a CLC code of TU4 was originally assigned to Construction & Building Technology that is not included in the journal classification system; we re-assigned it to Architecture according to its upper level CLC code as TU. Secondly, we added Arts & Humanities - Other Topics in the paper classification system and moved 581 papers originally assigned to seven Arts and Humanities SUs (i.e., Religion, Literature, Philosophy, History, Music, Art and Film, Radio & Television) to it. Eventually, all journals and papers were respectively assigned to 42 WoS SUs which are included in both the journal classification system and the paper classification system.
4.3. Measurements
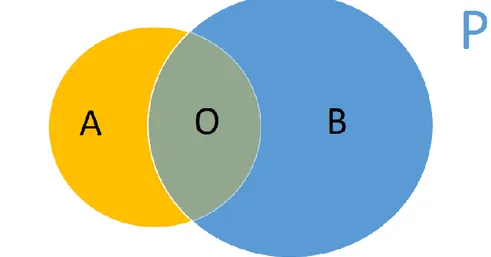
Papers could be classified into a given discipline in either the journal classification system or the paper classification system and form two corpuses. As shown by the Venn diagram (Figure 4), the circle J and P represent all papers classified as the discipline X in the journal classification system and the paper classification system, respectively. The overlap area O represents all papers classified as discipline X in both systems. The area A (A = J - O) represents papers classified as discipline X using journal
classification but self-identified by their authors as concerning another discipline(s). The area B (B = P - O) represents papers in corpus B that are self-identified by their authors as disciplines X but published in journals from another discipline or disciplines. Both A and B are articles misclassified by the journal classification system.
15 In the WoS SU, “Other Topics” in research area names means “General Topics”. For example, Arts & Humanities -
12
Figure 4 Example measurement of paper misclassification in a given discipline X between journal classification (J) and paper classification (P)
Since the size of corpus J, P as well as the overlap O may vary by discipline, two ratios measure the misclassification as shown in Table 3. In a given discipline X, J is the number of papers published in journals in discipline X, while A is the number of papers published in journals in discipline X but self-identified by their authors as other disciplines than X. The Ratio J (Ratio J = A/J × 100%) represents the percentage of papers published in journals in discipline X and that are contributed from other disciplines than X. Meanwhile, in a given discipline X, P is the number of papers self-identified by their authors as discipline X, while B is the number of papers self-identified by their authors as discipline X but published in journals in other disciplines than X. The ratio P (Ratio P = B/P × 100%) represents the percentage of papers self-identified by their authors as discipline X and that contribute to other disciplines than X. Table 3 Measurements used by this study
Research Question CSCD Level-1 CSCD Level-2 WoS SU
RQ1 Ratio J Ratio J Ratio J
RQ2 Ratio P Ratio P Ratio P
RQ3 Ratio J, Ratio P Ratio J, Ratio P Ratio J, Ratio P
5. Results
Between 2008 and 2015, 1,830,307 papers were published in 869 CSCD indexed journals. The average number of papers per journal is 2,106, ranging from 124 in Progress in Physics (物理学进展) to 20,623 in Chinese Journal of Gerontology (中国老年学杂志). Most papers were published in Chinese except that 69,118 English papers (3.8%) were published in 54 English journals (6.2%) administrated by Chinese publishers.
5.1. CLC-based Comparison
In the journal classification system, 869 journals as well as their 1,830,307 papers were classified into 12 level-1 disciplines and 66 level-2 disciplines (See Appendix I and Appendix II). Engineering & Technology, Medical Science & Health, Physical Science and Chemistry were the top 3 level-1 disciplines contributing more than 60% of journals and 70% of papers. Geology was the largest level-2 discipline in terms of the number of indexed journals (45) while Automation & Computer Technologycontributed the most papers
13
(125,023). Although CSCD is mostly covers sciences, it still indexes three General Social Science (level-1) journals that include 5,281 papers. In addition to 45 Multidiscipline journals16, three journals are classified as General Natural Science (level-1).
These 1,830,307 papers were also assigned to 12 level-1 disciplines and 66 level-2 disciplines in the paper classification system (See Appendix III). Engineering & Technology (671,417) and Automation & Computer Technology (173,865) are the largest level-1 and level-2 discipline respectively in terms of the number of indexed papers.
5.1.1. Disciplinary Distribution of Journal Articles
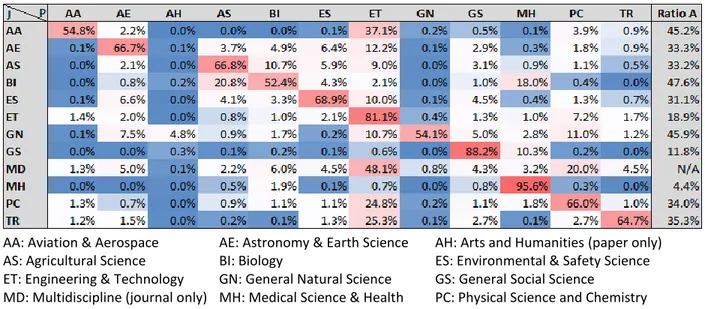
Comparing assignments between the journal classification system and the paper classification system shows that 21.3% of journal articles were contributed by other level-1 disciplines (Ratio J) than their journal’s discipline, ranging from 4.4% in Medical Science & Health to 47.6% in Biology (See Table 4). The Ratio J increased to 46.0% ranging from 5.3% in Horticulture to 81.8% in Agricultural Engineering when the 59 level-2 disciplines17 were investigated (See Table 5). Although Ratio J varied in different Level-2 disciplines, the largest contributions were still from their own disciplines except for Metallurgical Engineering which had 42.0% of papers identified by authors as Metal Science papers while only 19.5% of papers were identified as Metallurgical Engineering papers.
Note that papers with general topics might affect the results. For example, 29.1% of papers in Neurology & Psychiatry journals were identified by authors as Medical Science & Health – General Topics, and General Social Science papers account for 19.5 % of papers in Physical Geography journals. The share of these papers with general topics could increase Ratio J although some of them might partly relate to their journals’ disciplines.
Table 4 Percentage of papers from journal-level classification (y-axis), by paper-level classification (x-axis) (Ratio J)
AA: Aviation & Aerospace AE: Astronomy & Earth Science AH: Arts and Humanities (paper only) AS: Agricultural Science BI: Biology ES: Environmental & Safety Science ET: Engineering & Technology GN: General Natural Science GS: General Social Science
MD: Multidiscipline (journal only) MH: Medical Science & Health PC: Physical Science and Chemistry
16 CSCD does not provide any details regarding the criteria assigning a journal to Multidiscipline.
17 Seven Level-2 disciplines (Multidiscipline, Engineering & Technology – General Topics, Agricultural Science –
General Topics, Medical Science & Health – General Topics, Biology – General Topics, General Natural Science, and General Social Science) were excluded because most journals under these disciplines are multidisciplinary journals.
14 TR: Transportation
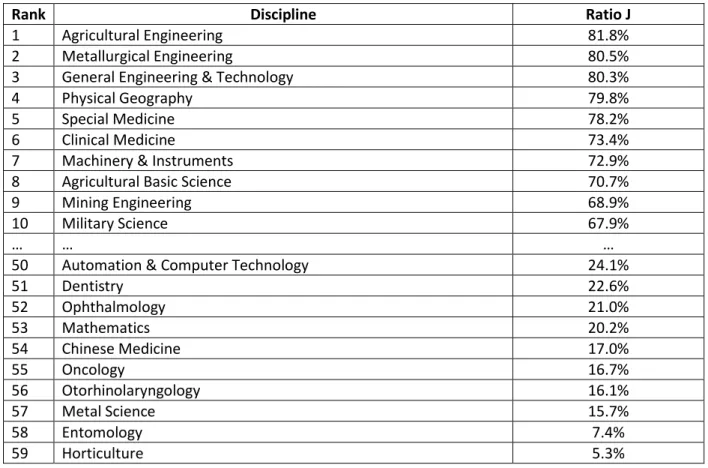
Table 5 List of Level-2 disciplines (journal level) in terms of the ratio of papers contributed from other disciplines (Ratio J)
Rank Discipline Ratio J
1 Agricultural Engineering 81.8%
2 Metallurgical Engineering 80.5%
3 General Engineering & Technology 80.3%
4 Physical Geography 79.8%
5 Special Medicine 78.2%
6 Clinical Medicine 73.4%
7 Machinery & Instruments 72.9%
8 Agricultural Basic Science 70.7%
9 Mining Engineering 68.9%
10 Military Science 67.9%
… … …
50 Automation & Computer Technology 24.1%
51 Dentistry 22.6% 52 Ophthalmology 21.0% 53 Mathematics 20.2% 54 Chinese Medicine 17.0% 55 Oncology 16.7% 56 Otorhinolaryngology 16.1% 57 Metal Science 15.7% 58 Entomology 7.4% 59 Horticulture 5.3%
5.1.2. Disciplinary Distribution of Paper Publication
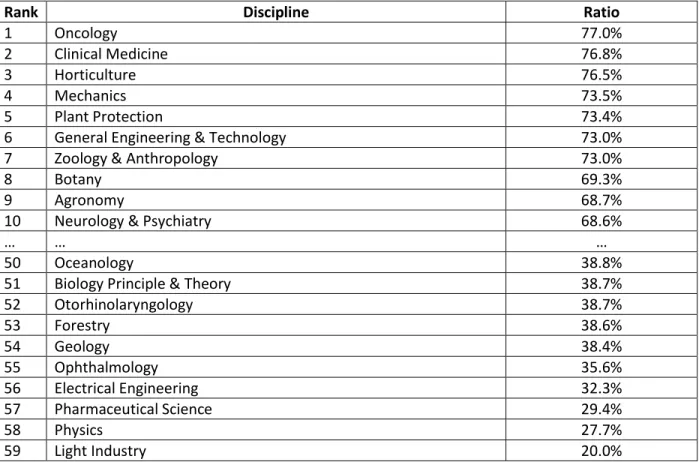
Generally, it is assumed that scholars would like to submit their papers to journals within the same discipline or multidisciplinary journals, but we found that 24.5% of papers were published in journals from other Level-1 disciplines (Ratio P), ranging from 6.2% in Medical Science & Health to 86.9% in General Social Science (See Table 6). The Ratio P increased to 51.1% when Level-2 discipline were analyzed: ranging from 20.0% in Light Industry to 77.0% in Oncology (See Table 7). It is noteworthy that 25.9% of author identified Clinical Medicine papers were published in Special Medicine journals while only 23.2% of Clinical Medicine papers were published in that journal’s discipline. In addition,
Mathematics papers made the largest contribution to Multidiscipline journals accounting for 24.6% of total papers, followed by General Natural Science papers (14.0%), Arts and Humanities papers (11.0%), Transportation papers (10.6%) and General Social Science papers (9.4%).
15
Table 6 Percentage of papers from paper-level classification (x-axis), by journal-level classification (y-axis) (Ratio P)
AA: Aviation & Aerospace AE: Astronomy & Earth Science AH: Arts and Humanities (paper only) AS: Agricultural Science BI: Biology ES: Environmental & Safety Science ET: Engineering & Technology GN: General Natural Science GS: General Social Science
MD: Multidiscipline (journal only) MH: Medical Science & Health PC: Physical Science and Chemistry TR: Transportation
Table 7 List of Level-2 disciplines (paper-level) in terms of the ratio of papers contributed to other disciplines (Ratio P)
Rank Discipline Ratio
1 Oncology 77.0%
2 Clinical Medicine 76.8%
3 Horticulture 76.5%
4 Mechanics 73.5%
5 Plant Protection 73.4%
6 General Engineering & Technology 73.0%
7 Zoology & Anthropology 73.0%
8 Botany 69.3%
9 Agronomy 68.7%
10 Neurology & Psychiatry 68.6%
… … …
50 Oceanology 38.8%
51 Biology Principle & Theory 38.7%
52 Otorhinolaryngology 38.7% 53 Forestry 38.6% 54 Geology 38.4% 55 Ophthalmology 35.6% 56 Electrical Engineering 32.3% 57 Pharmaceutical Science 29.4% 58 Physics 27.7% 59 Light Industry 20.0%
16
5.2. WoS SU-based Comparison
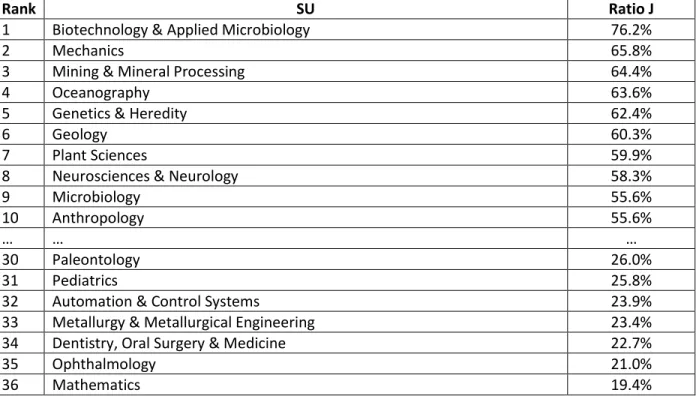
Similar results were found when all 1,830,307 papers and 869 journals were assigned to WoS SUs in both the journal classification system and the paper classification system using the conversion table (See Appendix IV and Appendix V). Among the 39 analysed SUs18, 39.6% of journal articles were contributed from other SUs than their journal’s SU(s) (Ratio J), ranging from 7.5% in Entomology to 76.2% in Biotechnology & Applied Microbiology (See Table 8). In 38 out of these 39 SUs, most papers were contributed from the same SU as their journal’s. The exception is Neurosciences & Neurology where 58.3% of papers stemmed from General & Internal Medicine as compared with 30.7% of papers contributed by Neurosciences & Neurology itself.
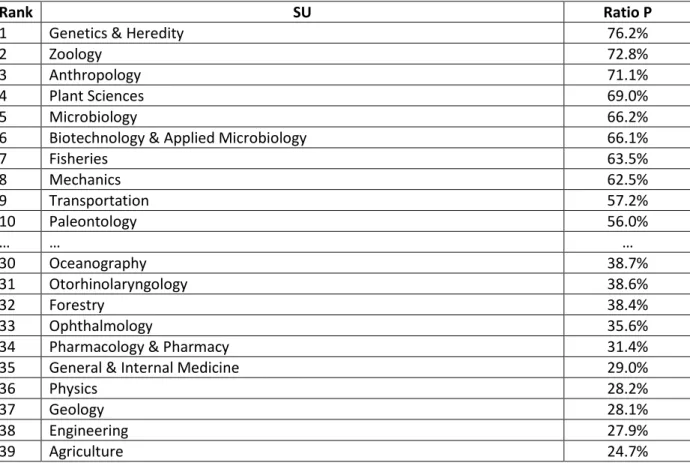
A similar Ratio P was found in papers contributed to other SUs: 39.2% of papers were published in journals classified in other SUs ranging from 24.7% in Agriculture to 76.2% in Genetics & Heredity (See Table 9), and papers in 6/39 SUs were published more in journals classified in another SU than journals classified in its own SU. Only 6.4% of Genetics & Heredity paper were published in Genetics & Heredity journals while 23.8% of these papers contributed to Agriculture journals; most Mechanics papers were not published in their own Mechanics journals (26.9%) but in Engineering journals (37.5%); 44.1% of Paleontology papers appear in Geology journals compared to 40.7% of papers in Paleontology journals. General & Internal Medicine journals are popular since most papers from Neurosciences & Neurology (54.7%), Oncology (53.1%), Public, Environmental & Occupational Health (46.7%) were published in General & Internal Medicine journals rather than journals in their own SUs (30.7%, 23.1%, 28.8% respectively).
Table 8 List of WoS SUs (journal-level) in terms of the ratio of papers contributed from other WoS SUs (Ratio J)
Rank SU Ratio J
1 Biotechnology & Applied Microbiology 76.2%
2 Mechanics 65.8%
3 Mining & Mineral Processing 64.4%
4 Oceanography 63.6%
5 Genetics & Heredity 62.4%
6 Geology 60.3%
7 Plant Sciences 59.9%
8 Neurosciences & Neurology 58.3%
9 Microbiology 55.6%
10 Anthropology 55.6%
… … …
30 Paleontology 26.0%
31 Pediatrics 25.8%
32 Automation & Control Systems 23.9%
33 Metallurgy & Metallurgical Engineering 23.4%
34 Dentistry, Oral Surgery & Medicine 22.7%
35 Ophthalmology 21.0%
36 Mathematics 19.4%
18 Science & Technology - Other Topics, Life Sciences & Biomedicine - Other Topics, Arts & Humanities - Other Topics were not included because most journals assigned to this three SUs are multidisciplinary journals
17
37 Oncology 16.7%
38 Otorhinolaryngology 16.1%
39 Entomology 7.5%
Table 9 List of WoS SUs (paper-level) in terms of the ratio of papers contributed to other WoS SUs (Ratio P)
Rank SU Ratio P
1 Genetics & Heredity 76.2%
2 Zoology 72.8%
3 Anthropology 71.1%
4 Plant Sciences 69.0%
5 Microbiology 66.2%
6 Biotechnology & Applied Microbiology 66.1%
7 Fisheries 63.5% 8 Mechanics 62.5% 9 Transportation 57.2% 10 Paleontology 56.0% … … … 30 Oceanography 38.7% 31 Otorhinolaryngology 38.6% 32 Forestry 38.4% 33 Ophthalmology 35.6%
34 Pharmacology & Pharmacy 31.4%
35 General & Internal Medicine 29.0%
36 Physics 28.2%
37 Geology 28.1%
38 Engineering 27.9%
39 Agriculture 24.7%
6. Analysis
Classifying publications into research areas or disciplines is a core element of bibliometric studies. Traditionally, classifications are based on the journal’s discipline(s) but its accuracy of such classifications has not been systematically investigated. This study shows a classification mismatch between journal and paper classification systems, which raises further questions concerning the accuracy of the dominant classification system of science.
6.1. Accuracy of Journal Classification System
It is often assumed that research papers published in the same journal belong to the same discipline. This study shows that 46.0% of journal articles, on average, come from other disciplines than that of their journal’s. This study confirms the question raised by previous studies regarding the inaccuracy of the journal classification system.
For example, between 2008 and 2015, 17,701 papers were published in four Agriculture Engineering journals indexed by CSCD. Of these 17,701 papers, 3,217 (18.2%) were identified by their authors as Agricultural Engineering papers, followed by Agricultural Basic Science (2,540, 14.4%), Automation & Computer Technology (1,775, 10.0%), and Agronomy (1,398, 7.9%). As Figure 5 shows, although
18
Agricultural Engineering papers made the largest contribution to Agricultural Engineering journals. There were 14,484 papers (81.8%) that were contributed from 54 other disciplines. If we simply classified all these 17,701 papers as Agricultural Engineering papers using the journal classification system, given that the authors’ classifications are considered to be the ground truth ones, 14,484 papers (Ratio J = 81.8%) might be misclassified. Meanwhile, 3,402 out of 6,619 Agricultural Engineering papers (Ratio P = 51.4%) published in journals in other disciplines were not classified as Agricultural Engineering in the journal classification system.
Figure 5 Distribution of papers in Agricultural Engineering journals by discipline
Journals in some disciplines such as Horticulture published very few papers (242/4,590) from other disciplines. Even so, 18,508 papers were identified by their authors as Horticulture papers but only 4,348 were published in Horticulture Journals, which entails that 76.5% (Ratio P) of Horticulture papers (14,160 /18,508) were classified as other disciplines in the journal classification system. Analysis of level-2 disciplines shows similar examples where journal articles stem from, on average, 48.9 source disciplines including the journal’s own, ranging from 14 source disciplines in Horticulture to 66 source disciplines in Chemistry. Figure 6 presents the diversity of between-discipline contributions in level-2 disciplines, where each point shows the number of source disciplines and the ratio of papers contributed from other disciplines (Ratio J). This represents the diversity of source disciplines contributing to journal articles in each level-2 discipline. These points are grouped by their parent level-1 disciplines using different colours. Figure 6 presents the huge diversity of between-discipline contributions in most scientific disciplines, in which 5.3% to 80.5% of journal articles are contributed from other disciplines. Thus, it reveals the extent of misclassification of journal articles if we simply classify all papers into the same discipline as their journal in the journal classification system.
19
Figure 6 Diversity of between-discipline contributions in CSCD in level-2 disciplines
6.2. System Settings
In addition to the CSCD classification system, many journal classification systems (WoS Categories, Scopus All Science Journal Classification, US NSF system, etc.) are available but they vary by their number of disciplines, level of classification, and journal classification methodology. This study reveals that such system settings could influence the accuracy of the journal classification system.
6.2.1. Inclusive vs Exclusive Classification
Both WoS and Scopus assign journals into one or multiple disciplines while NSF and other systems (e.g. Science-Metrix) exclusively assign each journal to a single discipline. Both assignments are reasonable, but the former may produce more misclassifications. For example, the journal Rare Metal was assigned to CSCD Level-2 disciplines Metallurgical Engineering and Metal Science; from 2008 to 2015, this journal published 988 papers that were classified by authors into 12 Level-2 disciplines as shown in Figure 7. It shows that 550 papers (55.7%) were classified as Metal Science and 230 papers (23.3%) were classified as Metallurgical Engineering papers, followed by 68 papers (6.9%) in Engineering & Technology –
General Topics, 37 papers (3.7%) in Chemistry and 33 papers (3.3%) in Chemical Engineering. As Table 11 shows, with inclusive classification, the 988 papers were indexed as 988 Metal Science papers and 988 Metallurgical Engineering papers, which produced 438 misclassifications (44.3%) as Metal Science papers and 758 misclassifications (76.7%) as Metallurgical Engineering papers. On the other hand, with the exclusive classification, this journal would be assigned to Metal Science only and produce only 438 misclassifications (44.3%) as Metal Science papers.
The purpose of inclusive classification is to allow journals to represent more related disciplines. However, since the journal classification system cannot differentiate journal articles by disciplines, inclusively classifying journal articles into two or more disciplines of their journal will produce more paper misclassifications as compared with exclusive classification.
20
Figure 7 Distribution of papers published in the Journal Rare Metal by discipline (2008-2015)
6.2.2. Number of Disciplines
The number of classified disciplines varies in different journal classification systems, and this has an effect on the accuracy of the journal classification system. This study made three comparisons between the journal classification system and the paper classification system in CLC 1 disciplines, CLC Level-2 disciplines and WoS SUs, which has a different number of disciplines in the classification system. As Table 10 shows, the ratio of papers contributed from other disciplines (Ratio J) increases with the number of disciplines in the journal classification system. The more disciplines a journal classification system has, the higher the Ratio J is.
Table 10 Comparison of the results based on three different classification systems
Classification System # of disciplines19 Ratio J
Min. Avg. Max.
CLC Level-1 11 4.4% 21.3% 47.6%
WoS SU 39 7.5% 39.6% 76.2%
CLC Level-2 59 5.3% 46.0% 81.8%
For another example of the journal Rare Metal: if we create a new discipline Metal Science and
Engineering that covers both Metallurgical Engineering and Metal Science; as Table 11 shows, only 208 out of 988 papers are contributed from disciplines other than the new discipline Metal Science and Engineering; the ratio of misclassification (Ratio J) will decrease from 44.3% (438/988) to 21.0% (208/988). It means that a journal classification system including only broad or high-level disciplines could reduce the paper misclassifications comparing to a detailed journal classification system including many disciplines.
19 Multidisciplinary level-2 disciplines and WoS SUs (e.g. Multidiscipline, General Social Science, Biology – Other
21
Table 11 The comparison of misclassification between inclusive and exclusive classification
Inclusive classification Exclusive classification # of papers # of misclassification % of misclassification # of papers # of misclassification % of misclassification Metal Science 988 438 44.3% 988 438 44.3% Metallurgical Engineering 988 758 76.7% N/A Metal Science and Engineering N/A 988 208 21.0%
6.2.3. Multidisciplinarity and Interdisciplinarity
Some academic journals cover literature from multiple scientific disciplines. These are either classified into multidisciplinary categories (e.g Agriculture, Multidisciplinary; Multidisciplinary Sciences; Physics, Multidisciplinary; etc.) or inclusively assigned to multiple related disciplines in the major citation databases (i.e., WoS and Scopus). As analyzed above, inclusively classifying a journal that publishes papers from diverse disciplines into multiple specific disciplines will produce more paper
misclassifications than classifiying it into a multidisciplinary category. The methodologies that determine the boundary of these multidisciplinary disciplines effects the accuracy of a journal classification system; unfortunately, there is a derth of publicly available information describing the specifics of these
methodologies.
The Herfindahl-Hirschman index (HHI)20, which is commonly used to measure market concentration in business but has been applied in bibliometric studies for measuring the concentration of authors, papers, journals, citations, references as well as other indicators (Chi, 2016; Huang, Fang, & Chang, 2011; Keathley-Herring et al., 2016; Larivière, Gingras, & Archambault, 2009; Tseng & Tsay, 2013). In this study, the HHI and the share of the largest contributor (Level-2 discipline) were used to measure the concentration of disciplines for all 869 CSCD journals. The HHI ranges from 0 to 1 as a journal covers all scientific disciplines down to a single discipline.
As Figure 8 shows, the 869 journals were grouped into four categories: Multidiscipline (45 journals classified into the Level-1 category as Multidiscipline), General Discipline (78 journals classified into Level-2 multidisciplinary categories such as Biology – Other Topics, General Social Science, etc.), Cross Discipline (31 journals classified into multiple Level-2 disciplines), and Single Discipline (the rest of 715 journals). These categories are identified by the color of the data points in Figure 8.
Figure 8 shows that the journal’s discipline concentration increases with the growth of its share of the largest contributor to the journal. Multidiscipline journals are less concentrated with the HHI ranging from 4.3% to 40.6% while almost half Single Discipline journals (337/715) concentrated more on a single discipline with the HHI over 50%. The concentration measurement of General Discipline journals (18.0% on average, between 5.2% and 74.6%) and Cross Discipline journals (34.6% on average, between 9.7%
20 The formula of HHI is 𝐻𝐻𝐼 = ∑𝑛 𝑆𝑖2
𝑖=1
where Si is the percentage of papers that are published in a given journal and self-identified by their authors as discipline i, and N is the number of disciplines self-identified by authors of all papers published in this journal.
22
and 87.9) are between the Multidiscipline (13.0% on average, between 4.3% and 40.6%) and Single Discipline (50.9% on average, between 6.7% and 99.7%). However, there is no obvious boundary between them; some Single Discipline journals are less concentrated than Multidiscipline journals but are still classified into a single discipline.
Figure 8 Diversity of source discipline in CSCD journals
Table 12 presents data from 2008 to 2015, during which 1,114 papers were published in the Journal of Fujian Agriculture and Forestry University (Natural Science Edition), which was classified as a Forestry journal. However, this journal does not concentrate on Forestry research (111) but published papers assigned to Animal Science & Veterinary Medicine (129), Agronomy (111), Plant Protection (110), Horticulture (104) and another 36 disciplines. Based on its coverage, this journal should be classified as Agricultural Science – Other Topics (General Discipline) instead of Forestry (Single Discipline). The misclassification of this journal also leads to its paper’s being misclassified since 90.0% (1,003/1,114) are from disciplines other than Forestry.
Table 12 Distribution of papers published in Journal of Fujian Agriculture and Forestry University (Natural Science Edition) by discipline (2008-2015)
Discipline Number
of papers
Discipline Number
of papers
Animal Science & Veterinary Medicine 129 General Engineering & Technology 7
Agronomy 111 Zoology & Anthropology 7
Forestry 111 Agricultural Engineering 6
Plant Protection 110 Pharmaceutical Science 5
Horticulture 104 Machinery & Instruments 4
Light Industry 75 Electrical Engineering 3
Biology Principle & Theory 60
Electronic Technology &
23
Botany 43 Physical Geography 3
Automation & Computer Technology 39 Physics 3
Environmental & Safety Science – Other
Topics 39 Disease Prevention & Hygiology 2
Agricultural Basic Science 35 Mechanics 2
Entomology 26 Metal Science 2
Microbiology 26 Meteorology 2
Chemistry 24 Preclinical Medicine 2
Chemical Engineering 23 Agricultural Science – Other Topics 1
Fisheries 23 Energy & Power Engineering 1
General Social Science 22 Internal Medicine 1
Mathematics 19 Nuclear Science & Technology 1
Transportation 19 Special Medicine 1
Chinese Medicine 10 Topography 1
Architecture 9
6.3. Limitations
It is assumed that the CLC code of a paper represents its major research area (discipline) since it is chosen by their author(s). In practice, some scholars may choose inaccurate or inconsistent CLC codes for their papers since they are not classification experts. For example, Figure 3 indicates a paper identified by authors as a Scientometrics paper (CLC code: G301); this paper could also be identified as an Information Science paper (CLC code: G33) since there is no requirement for author(s) to provide CLC-codes at a specific CLC level of abstraction. Thus, authors may make the inaccurate assignment when they try to identify the paper as a specific discipline by providing a CLC code at low levels (level 3 or below). However, such inaccurate assignments were rarely made when identifying a paper as a broad discipline (level 1 or 2). Since this study conducts the comparison at CLC level 1 and level 2 disciplines, this inaccurate assignment is unlikely to have a significant effect on overall results.
In addition, some authors may be influenced by the CLC Code of the journal to which their paper is submitted although they are not required to submit the same CLC code as the journal. Most authors are required to provide only one CLC code for each paper, but this is not adequate to represent the research area(s) of an interdisciplinary research paper. Although the CSCD journal classification system is based on the CLC categories, some disciplines are merged or modified using direct citation analysis and clustering methods that are not detailed.
7. Conclusions
After comparing the classification system of science between the journal-level and the paper-level, based on the same CSCD data, this study revealed the extent of paper misclassification in the journal classification system of science based on the CSCD data. The results of this study indicate that papers are misclassified by a journal classification system since:
• in the journal classification system, 46.0% of articles were not contributed from their journal’s discipline(s), and
• in a paper classification system, 51.1% of papers were not published in journals of the same discipline(s), but
•
the ratio of papers contributed from, or to, other discipline(s) varies by discipline and the methodology constructing the classification system.24
This study reveals the problem of paper misclassifications in the journal classification system using the CSCD data. This makes it increasingly essential to develop the paper classification system instead of the journal classification system in bibliometric databases. In addition to the CLC that is only used in China, both the Library of Congress Subject Headings (LCSH) and the Medical Subject Headings (MeSH) could be used to classify papers into disciplines, if authors are required to provide the subject headings. For example, LCSH can better represent research area(s) of interdisciplinary research since multiple subject headings can be assigned to the same publication, each representing at least 20% of the work (Library of Congress, 2016). Since the MeSH assignments have been applied to medical research papers, a paper classification system of medical science could be established based on the MeSH; and a comparison between the journal classification system and the paper classification system in medical science, should be proposed in future research.
In addition, although it is assumed that the paper level classification is more accurate than the journal level classification considering the authors’ self-identification of the paper’s discipline(s), the accuracy of these two CLC-based classifications has not been evaluated by a third independent relatedness, which is proposed by Waltman, Boyack, Colavizza, and van Eck (2017). In the future, we would like to compare the journal level classification with the paper level classification based on the same data set using the automatically obtained similarities, which could be based on direct citation, bibliographic coupling, or co-citation (Boyack & Klavans, 2014a, 2014b; Rafols & Leydesdorff, 2009; Waltman & Eck, 2012), to confirm whether the paper level classification is more accurate than the journal level classification or not.
Overall, this study improves our understanding of the accuracy of the classification system of science and forms a foundation for future studies investigating the difference between the journal classification system and the paper classification system.
25
References
Archambault, É., Beauchesne, O. H., & Caruso, J. (2011). Towards a multilingual, comprehensive
and open scientific journal ontology. Paper presented at the Proceedings of the 13th
international conference of the international society for scientometrics and informetrics.
Börner, K., Klavans, R., Patek, M., Zoss, A. M., Biberstine, J. R., Light, R. P., . . . Boyack, K. W.
(2012). Design and Update of a Classification System: The UCSD Map of Science. PLoS
ONE, 7(7), e39464. doi:10.1371/journal.pone.0039464
Boyack, K. W., & Klavans, R. (2010). Co-citation analysis, bibliographic coupling, and direct
citation: Which citation approach represents the research front most accurately? Journal
of the American Society for Information Science and Technology, 61(12), 2389-2404.
Boyack, K. W., & Klavans, R. (2014a). Creation of a highly detailed, dynamic, global model and
map of science. Journal of the Association for Information Science and Technology, 65(4),
670-685.
Boyack, K. W., & Klavans, R. (2014b). Including cited non-source items in a large-scale map of
science: What difference does it make? Journal of Informetrics, 8(3), 569-580.
Boyack, K. W., Newman, D., Duhon, R. J., Klavans, R., Patek, M., Biberstine, J. R., . . . Börner, K.
(2011). Clustering more than two million biomedical publications: comparing the
accuracies of nine text-based similarity approaches. PLoS ONE, 6(3).
Chi, P.-S. (2016). Differing disciplinary citation concentration patterns of book and journal
literature? Journal of Informetrics, 10(3), 814-829. doi:10.1016/j.joi.2016.05.005
De Bellis, N. (2009). Bibliometrics and citation analysis: from the Science citation index to
cybermetrics. Lanham, Md.: Scarecrow Press.
Garfield, E., Malin, M. V., & Small, H. (1975). A system for automatic classification of scientific
literature. Journal of the Indian Institute of Science, 57(2), 61.
General Administration of Press and Publication of China. (1989). Guanyu Pizhun
Zhongguobiaozhunganhao Guojia Biaozhunhan de Tongzhi (Notice of the Approval of
Chinese Serial Number). Beijing.
26
Glänzel, W., & Schubert, A. (2003). A new classification scheme of science fields and subfields
designed for scientometric evaluation purposes. Scientometrics, 56(3), 357-367.
doi:10.1023/a:1022378804087
Griffith, B. C., Small, H. G., Stonehill, J. A., & Dey, S. (1974). The structure of scientific literatures
II: Toward a macro-and microstructure for science. Science studies, 4(4), 339-365.
Huang, M.-C., Fang, S.-C., & Chang, S.-C. (2011). Tracking R&D behavior: bibliometric analysis of
drug patents in the Orange Book. Scientometrics, 88(3), 805.
doi:10.1007/s11192-011-0400-3
Janssens, F., Zhang, L., De Moor, B., & Glänzel, W. (2009). Hybrid clustering for validation and
improvement of subject-classification schemes. Information Processing & Management,
45(6), 683-702.
Javitz, H., Grimes, T., Hill, D., Rapoport, A., Bell, R., Fecso, R., & Lehming, R. (2010). U.S. Academic
Scientific Publishing. Arlington, VA: National Science Foundation, Division of Science
Resources Statistics.
Jin, B., & Wang, B. (1999). Chinese Science Citation Database: its construction and application.
Scientometrics, 45(2), 325-332.
Keathley-Herring, H., Van Aken, E., Gonzalez-Aleu, F., Deschamps, F., Letens, G., & Orlandini, P. C.
(2016). Assessing the maturity of a research area: bibliometric review and proposed
framework. Scientometrics, 109(2), 927-951. doi:10.1007/s11192-016-2096-x
Klavans, R., & Boyack, K. W. (2017a). Research portfolio analysis and topic prominence. Journal
of Informetrics, 11(4), 1158-1174. doi:
https://doi.org/10.1016/j.joi.2017.10.002
Klavans, R., & Boyack, K. W. (2017b). Which Type of Citation Analysis Generates the Most
Accurate Taxonomy of Scientific and Technical Knowledge? Journal of the Association for
Information Science and Technology, 68(4), 984-998.
Larivière, V., Gingras, Y., & Archambault, É. (2009). The decline in the concentration of citations,
1900–2007. Journal of the American Society for Information Science and Technology,
60(4), 858-862. doi:10.1002/asi.21011
27