Uncovering the minor contribution of land-cover change in upland forests to the net carbon footprint
1
of a boreal hydroelectric reservoir
2
3
Pierre-Luc Dessureault*1, Jean-François Boucher1, Pascal Tremblay1, Sylvie Bouchard1 and Claude 4
Villeneuve1 5
6
*Corresponding author : Université du Québec à Chicoutimi, Département des Sciences fondamentales, 555 7
boulevard de l’Université, Chicoutimi, QC (QC), G7H 2B1, Canada; tel +1-418-545-5011 #2569, Pierre-8
Luc_Dessureault@uqac.ca 9
1 Université du Québec à Chicoutimi, Département des Sciences fondamentales, 555 boulevard de 10
l’Université, Chicoutimi (QC), G7H 2B1, Canada. 11
12
Key abbreviations: 13
CBM-CFS3, Carbon budget model of Canadian Forest Service (third version); CD, carbon disturbance; CE, 14
carbon equivalent; CO2e, carbon dioxide equivalent; CS, carbon sink; CWFIS, Canadian Wildland Fire 15
Information System; D, decay; DOM, dead organic matter; GHG, greenhouse gas; HQ, Hydro-Québec; 16
IPCC, Intergovernmental Panel on Climate Change; KP, Kyoto Protocol; LUCC, Land use and cover change; 17
MRN, Ministère des ressources naturelles; NBP, net biome productivity; NEP, net ecosystem productivity; 18
NPP, net primary productivity. 19
20 21
ABSTRACT
22
Hydropower in boreal conditions is generally considered the energy source emitting the least greenhouse gas 23
per kWh during its life cycle. The purpose of this study was to assess the relative contribution of the land-use 24
change on the modification of the carbon sinks/sources following the flooding of upland forested territories 25
to create the Eastmain-1 hydroelectric reservoir, in Quebec’s boreal forest using Carbon Budget Model of the 26
Canadian Forest Sector (CBM CFS3). Results suggest a carbon sink loss after 100 years of 300 000 ± 27
100 000 Mg CO2e. A wild fire sensitivity analysis revealed that the ecosystem would have acted as a carbon 28
sink as long as < 75 % of the territory had burned over the 100 year-long period. Our long-term net carbon 29
flux estimations resulted in emissions of 4 ± 2 g CO2e kWh-1 as a contribution to the carbon footprint 30
calculation, eight times less than what was obtained in a recent study (Teodoru et al., 2012) that used less 31
precise and sensitive estimates. Consequently, this study significantly reduces the reported net carbon 32
footprint of this reservoir, and reveals how negligible the relative contribution of the land-use change in 33
upland forests to the total net carbon footprint of a hydroelectric reservoir in the boreal zone can be. 34
1. Introduction
36
With its 62 hydroelectric power plant and its production capacity of 36.5 GW (Hydro Québec, 2015), 37
Hydro-Québec (HQ) is one of the most important electricity producers in North-Eastern America. HQ claims 38
that its hydro-electricity is among the lowest C-intensive technologies worldwide. However, assessing the 39
carbon (C) footprint of a given unit of electricity needs a complete life cycle analysis of emissions/sinks of 40
greenhouse gases. In 2002, HQ, reported a secondary data-based C footprint of the full energy chain 41
associated with the Eastmain-1 hydroelectric plant to other types of electricity generation (Tremblay et al., 42
2005). The data showed that with emissions of approx. 15 t CO2e GWh-1 over 100 years for average boreal 43
reservoirs (and up to 33 t CO2e GWh-1 for the larger La Grande Complexe), boreal hydroelectricity is largely 44
advantageous over others. However, this report (Tremblay et al., 2005) took only into account the gross GHG 45
emissions created by a reservoir, i.e., without the variation in C fluxes associated with the land-use change 46
caused by the flooding of a large forested territory to create the reservoir (IPCC, 2003), as required by the 47
Kyoto Protocol (KP) (UNFCCC, 1998). 48
More recently, Teodoru et al. (2012) used direct observations, new modeling approaches and data 49
from the literature to estimate reservoir net emissions, including an estimation of the loss of C sink to 50
complete the net C footprint of the newly created Eastmain-1 reservoir. They assessed the loss of C sink from 51
flooded upland forests to be 32 t CO2e GWh-1 (range of 76 to –11 t CO2e GWh-1) or 20% of the overall and 52
long-term (100 year) C footprint of the reservoir (158 t CO2e GWh-1) (Teodoru et al., 2012). Though their 53
approach provided valuable and conservative results, a more detailed and sensitive methodology is deemed 54
necessary to mitigate the uncertainty around the upland forest land-use cover change (LUCC) estimated 55
impact on the net GHG emissions of hydroelectric reservoirs. This is particularly relevant given the 56
importance of this energetic issue in North America – where the C footprint of different types of energy 57
production is increasingly becoming strategic (Edenhofer et al., 2011) and considering that natural upland 58
forests account for approx. 49% of the flooded territory and 20% of the net C fluxes calculated in Teodoru et 59
al. (2012). 60
In Canada and elsewhere around the world, the Carbon Budget Model of the Canadian Forest Sector 3 61
(CBM-CFS3) (Kurz et al., 2009)is used to simulate the dynamics of forest C stocks as required under the KP 62
(IPCC, 2003).CBM-CFS3 is an aspatial, stand and landscape-level modeling framework used to simulate the 63
dynamics of all forest C stocks required under the Kyoto Protocol, and is compliant with the C estimation 64
methods outlined in the IPCC Good Practice Guidance for Land Use, Land Use Change and Forestry report 65
(2003).This model uses information from forest inventories, growth and yield tables, natural disturbances 66
and stand regeneration dynamics to estimate upland forest C fluxes and stocks. Hence, this model can be 67
used to estimate the LUCC portion of the C footprint for different forest management scenarios, natural 68
disturbances and changes in land use, like flooding for the creation of a water reservoir (Kurz et al., 2009). 69
Natural disturbances are the first cause of GHG emissions in managed forests of Canada by changing 70
C accumulation in the affected areas (Carlson et al., 2010 and Chertov et al., 2009). In Canada, forest fires 71
were assessed to be responsible for the emission of 2.7 Tg of C between 1959−1999, and annual burned 72
forest area is expected to increase by 74−118 % by the end of the century (Amiro et al., 2001 and Flannigan 73
et al., 2005). Hence, taking into account fire cycle – defined as the time needed to burn an area equivalent to 74
a given territory (Bergeron et al., 2001) – is essential to adequately simulate C stock evolution over a large 75
territory and long period of time as they are known to vary spatiotemporally and to be influenced by 76
anthropic activities (forest management, fire control and recreational use) (Bergeron et al., 2001 and 2010, 77
Lauzon et al., 2006 and Le Goff et al., 2009).The Eastmain-1 hydroelectric reservoir area had an estimated 78
fire cycle varying between 132-153 years over the last century (burning rate of 0.65 to 0.76 % per year), and 79
the annual burned area could increase by 7 % by 2100 (Le Goff et al., 2007). Other fire cycle studies 80
covering extended territories, but always including the Eastmain river watershed, revealed that during the last 81
century fire cycles varied from 191 to 325 years (Bergeron et al., 2001). As fire cycles vary greatly it makes 82
any flooded upland forest C balance prediction difficult, thereby demonstrating the necessity to use 83
sensitivity analyses while integrating wild fire risk in the C footprint calculation of the upland forest part of 84
an hydroelectric reservoir. 85
In this study, the absence of the reservoir, and thus the natural dynamic of the upland forest 86
ecosystems, constitutes the baseline scenario, while the reservoir creation and the resulting forested land 87
flooding (with the concomitant loss of C fluxes from the forested lands) will be considered as the project 88
scenario, sensu ISO 14064-2 (ISO, 2006) and in accordance with the same two scenarios in Teodoru et al. 89
(2012). The objective of this study is therefore to estimate the net C balance of the flooded upland forest for 90
the creation of the Eastmain-1 reservoir (see Figure 1) over a period of 100 years, using fire cycles data, 91
forest inventory derived from photo interpretation and model simulations with CBM-CFS3, and then to 92
translate this net C balance – the project scenario minus the baseline scenario, i.e., C fluxes with and without 93
the reservoir – in terms of C footprint in CO2e per kWh for the life expectancy of the installation. For the 94
baseline scenario, sensitivity analyses are performed to evaluate the impact of different fire regimes, forest 95
productivity and regeneration patterns following disturbance on the C balance of the unflooded upland forest 96
territory. It is expected that the land use cover change caused by the flooding of the upland forest territories 97
induces a net loss of C sink, as the forest at the moment it was flooded would have sequestered more C then 98
it would have emitted despite fire disturbances. Other C sources resulting from the reservoir creation, i.e. the 99
major C gas (CO2 and CH4) sources and sinks of the terrestrial (other than upland forests) and aquatic 100
components of the pre- and post-flood landscape are not considered since they were thoroughly covered in 101
Teodoru et al. (2012). A concomitant objective is to provide for the first time a detailed estimation of the 102
relative contribution of the upland forest C sink/source change to the net C footprint of a newly flooded 103
boreal hydroelectric reservoir. 104
105
2. Methods
106
2.1. Description of the study area
The study site is located in the Eastmain river watershed (50°59’50’’N and 76°02’28’’W; (Figure 2) 108
which lies at the transition of two bioclimatic domains of the boreal zone in Québec, spruce-moss to the 109
south and spruce-lichen to the north (Saucier, 2009). Annual average temperatures vary between 0 and -2.5º 110
C, with 600 to 1000 mm of annual precipitation (for more details on the study site biophysical characteristics 111
see Teodoru et al. (2012). 112
In 2003, a vast territory of 59 100 ha, of which 43 161 ha (73 %) were upland forested areas, was 113
used to create the Eastmain-1 hydroelectric plant reservoir. The plant has three turbine-groups of a 485 MW 114
power with a mean annual production of 2.7 TWh (Teodoru et al., 2012). In 2012, Hydro-Québec added 115
approximately 768 MW of capacity by the diversion of the large Rupert river into the existing Eastmain-1 116
reservoir to the previous 485 MW, without any significant change to the initial reservoir area. The flooded 117
areas also encompassed lakes, streams and rivers (~15 %), and wetlands (~12 %) (Teodoru et al., 2012), but 118
the present model simulations focused exclusively on upland forests, for which CBM-CFS3 is fully 119
parameterized (Kurz et al., 2009). Simulations were performed for the 43 161 ha (73%) of flooded forested 120
areas to estimate C balance. 121
A forest inventory of this area was made using 253 aerial photos (1: 20 000) taken in 1999 before the 122
area was flooded. From these photos, species, age class, tree density and mean tree height were 123
photointerpreted for each distinct forest stand and recent disturbances noted. The 253 aerial photos and the 124
2 700 resulting stands were then scanned and georeferenced [NAD_1983_UTM_Zone_9N] and Arc GIS 9.0 125
[ESRI, Redland, USA, 2006] was used to determine their corresponding surface area. 126
The flooded territory was dominated by six species: black spruce (Picea mariana Mill.), jack pine 127
(Pinus banksiana Lamb.), tamarack (Larix laricina (Du Roi) K. Koch), balsam fir (Abies balsamea (L.) 128
Mill.), paper birch (Betula papyrifera Marsh) and trembling aspen (Populus tremuloïdes Michx). Black 129
spruce covered 50 % of the territory, jack pine 35 % and 23 % of the area was in regeneration, i.e., stands 130
were between 0−30 years old. 131
Stands with similar species, densities and ages were pooled so the initial 2700 stands resulted into 231 132
different groups of stands in order to simplify the model simulation. Growth and yield tables of 133
corresponding stand types within the allowable cut territory (MRN, 2000) – less than 100 km southward and 134
corresponding to the nearest region where comparable production data were available – were then used as 135 CBM-CFS3 inputs. 136 137 2.2. Simulations 138
The C balance simulations were performed using the standard importation tool of the CBM-CFS3 (v. 139
1.2 beta) developed by the Canadian Forest Service (Kurz et al., 2009). This model simulates the dynamic of 140
forest C stocks and complies with the approved methods of C stock estimations by the Intergovernmental 141
Panel on Climate Change (IPCC) (Solomon et al., 2007). The model was feed with growth and yield tables 142
according to forest inventory data (i.e. disturbance, species, age, area, stem density) (MRN, 2000). The 143
absence of the reservoir, and thus the natural dynamic of the upland forest ecosystems, constitutes the 144
baseline scenario, while the reservoir creation and the resulting forested land flooding (with the concomitant 145
loss of C fluxes from the forested lands) will be considered as the project scenario, sensu ISO 14064-2 (ISO, 146
2006) and in accordance with the same two scenarios in Teodoru et al. (2012). 147
Simulations were carried out over a 100 year period in the Eastern Boreal Shield ecozone with CBM-148
CFS3 default soil parameters of this area. We used Bergeron et al. (2010) 0.45% annual burning rate to 149
simulate a 222 year-long fire cycle (baseline scenario), as the flooded territory was included in their field 150
study. This fire cycle was chosen because it represents a projection for the next 100 years. A fire pattern 151
emulating natural variability was created using data from the Large Fire Database (LFDB) from Natural 152
Resources Canada (1959−1999) (CWIFS, 2012). These data were extracted for a 10000 km2 area centered 153
over the Eastmain-1 reservoir. The 40 year fire sequence extracted from the database (1959−1999) was 154
repeated 2.5 times to obtain a 100 year sequence and the result was then standardized to correspond to 45 % 155
of burned area after a 100 year modeling, in order to relate to a fire cycle of 222 years (Bergeron et al., 156
2010). The model used did not account for multiple fires in the same area, so each hectare could only burn 157
once during the 100 years modeling. Regeneration delay was set to begin the year following the fire 158
disturbance without any modification to the forest inventory other than age class which was zeroed after a 159
fire event. Stand composition transition was not taken into account as it had a negligible effect on C stocking. 160
This pattern of fire variability was used in all simulations and resulted in 0−7% of yearly burned land in the 161
study area (see Figure S1a in the Supporting Information). 162
163
2.3. Sensitivity analyses
164
Different factors were tested for their effects on the model output variability. Volume yield, fire cycle 165
and stand composition following wild fire have been tested in sensitivity analyses. 166
Sensitivity analyses on volume yield were performed to evaluate the variability created by the 167
simulations over a long period.Three simulations with different volume yields: original, original plus 20 %, 168
original minus 20 % were carried out while fire cycle was kept constant at 222 years. 169
Different fire cycles were also used to ascertain the gain and losses in C stocks due to the uncertainty 170
on the 222 year cycle (Bergeron et al., 2010) established for this area, and to estimate volume yields if the 171
territory did not burn. The following scenarios were modeled: 1- no disturbance, 2- 313 year fire cycle (fire 172
affects 32 % of the territory after 100 years), 3- 222 years (fire affects 45 % of the territory after 100 years), 173
and 4- 170 years (fire affects 59 % of the territory after 100 years) (Bergeron et al., 2010). An additional 174
analysis was conducted with a 127 year fire cycle (fires affects 79 % of the territory after 100 years), inferred 175
from the photo interpretation performed for this study. This last scenario represents an instantaneous picture 176
of the study area; however, it does not correspond to a science based fire cycle and should be considered as 177
an extreme case in our range of tested scenarios. 178
Sensitivity analyses on stand regeneration were also performed to monitor the possible effects of a 179
lack of regeneration with certain species and/or species switch following a fire event. See the Supporting 180
Information for details on post-fire regeneration patterns tested. 181
182
2.4. Net biome productivity
183
Net biome productivity (NBP) of the flooded territory was calculated using these formulas: 184
𝑁𝑁𝑁𝑁𝑁𝑁 = 𝑁𝑁𝑁𝑁𝑁𝑁 + 𝐷𝐷𝐷𝐷𝐷𝐷𝐷𝐷 (1) 185
𝑁𝑁𝑁𝑁𝑁𝑁 = 𝑁𝑁𝑁𝑁𝑁𝑁 + 𝐶𝐶𝐷𝐷 (2) 186
Where NEP is the sum of annual net primary productivity (NPP) and annual decay of dead organic matter 187
(DOMD), and NBP is the sum of the annual net ecosystem productivity (NEP) and the annual loss from C 188
disturbance (CD), which includes any simulated disturbance affecting C stock, primarily fire. 189
190
2.5. Carbon sink/source per GWh
191
Tons of C equivalent (CE) obtained from the calculations of NBP were transformed into tons of C 192
dioxide equivalent (CO2e) using the formula CO2e = CE * 3.67. 193
To calculate the C sink/source per GWh, overall upland C flux (in CO2e) was divided by the Eastmain 194
hydroelectric plant average annual production (2.7 TWh) and multiplied by the 100 years life expectancy of a 195
hydroelectric plant in the boreal forest. The C sink/source per GWh was then calculated using Equation 3 196
(Tremblay et al., 2005): 197
𝐶𝐶𝐶𝐶𝐺𝐺𝐺𝐺ℎ= 𝑁𝑁𝑁𝑁𝑁𝑁𝑐𝑐𝑐𝑐𝑐𝑐𝑐𝑐𝑐𝑐× 𝟑𝟑. 𝟔𝟔𝟔𝟔 (𝐏𝐏 × 𝟏𝟏𝟏𝟏𝟏𝟏)⁄ (3) 198
Where: 199
CSGWh = Carbon sink/source per GWh (Mg CO2 e GWh-1)
200
NBPcumul = Cumulated NBP (Mg CO2 e)
201
P = GWh produced per year at the Eastmain plant (GWh y-1) 202
100 = Life expectancy of an hydroelectric plant in the boreal zone (in years) 203
204
3. RESULTS
205
3.1. Initial carbon stocks
206
Dead organic matter represented up to 81% of the total upland forest C stocks (5 751 069 Mg), 207
compared to 19 % for the biomass (Table 1). In total, C stock density was 133 Mg C ha-1 for all the C pools 208
with 108 Mg C ha-1 in the dead organic matter pools. 209
210
3.2. Evolution of stand age
211
Average stand age went from 59 to 111-year-old during the simulated period with small variations 212
corresponding to fire events (Figure S2 in the Supporting Information). Without wildfires scenario, stands 213
would have reached 159 years on average. 214
215
3.3. Carbon flux and stock variations
216
During the years with fires burning large territories, emissions almost reached 40 000 Mg C year-1 for 217
the 43 161 ha flooded territory, or 0.9 Mg C ha-1 y-1. In addition, C emissions increased over time as C stocks 218
(biomass and dead organic matter) increased with stand age. On average, forest fires (C Disturbance) 219
accounted for emissions of 0.08 (0.00/0.90) Mg C ha-1 y-1 (Table 2). Net primary production (NPP) of the 220
flooded forest varied between 80 000 to 100 000 Mg C year-1 and tended to increase slightly with time, but 221
halted after 90 years of simulation. It also leveled off during the years of important fires, as the latter strongly 222
affected age class structure of the territory. Overall, mean annual NPP was 2.12 (2.28/1.86) Mg C ha-1 year-1 223
(Table 2). The simulated forest built up from 60 000 to 90 000 Mg C year-1 in dead organic matter and this 224
accumulation rate tended to increase over time. Overall, dead organic matter accumulation rate increased to a 225
mean rate of 1.90 (1.51/2.15) Mg C ha-1 year-1 (Table 2). Decomposition rate of organic matter increased 226
over the years and varied from 78 000 to 90 000 Mg C year-1 corresponding to emissions of 1.97 (1.81/2.09) 227
Mg C ha-1 year-1 (Table 2), with the lowest values during the years where burnt areas were large. Net 228
ecosystem production (NEP) increased until year 35 then sharply declined with significant variations (in 229
accordance with fire occurrence and extent) for thirty years. After year 65, the NEP tended to decrease with 230
little variation caused by forest fires. The general trend was to decrease, but the mean NEP was 0.15 (-231
0.01/0.32) Mg C ha-1 y-1 (Table 2). 232
Net biome production followed the pattern of fire and NEP. Annual Net biome productivity was on 233
average 0.07 (-0.89/0.32) Mg C ha-1 year-1 (Table 2). 234
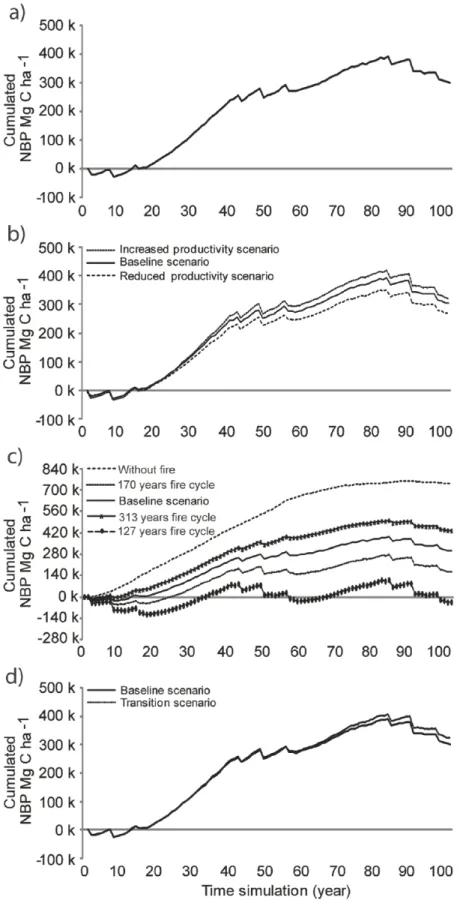
Cumulated NBP over the course of the 100 years simulation period (Figure 3a) showed the same 235
leveling off around 90 years, in accordance with forest fires as in the other figures (Figure 3b, c, d). After 100 236
years the flooded forest would have sequestered 303 489 Mg C or 7 Mg C ha-1. 237
238
3.4. Sensitivity tests
239
3.4.1. Yield tables variations
C gains (cumulative NBP) over the 100 years simulated varied between 270 251 to 326 463 Mg C 241
when modifying the wood volume yield by ± 20% (Figure 3b), which corresponds to -11% to +8% compared 242
to cumulated NBP with the volume yield used in the basic assumption. 243
244
3.4.2. Fire cycle variations
245
After 100 years, average stand age varied markedly according to the fire cycle, going from 74 years 246
for a 127 year fire cycle to 125 years for a 313 year fire cycle (see Figure S2 in the Supporting Information). 247
Shorter fire cycle resulted in less C sequestration (Figure 3c). Using the confidence intervals suggested in 248
Bergeron et al. (Bergeron et al. 2010), C gains varied from 164 232 Mg C (170 year fire cycle) to 433 251 249
Mg C (313 year fire cycle), which correspond to variations of -46% and +43% of the NBP with the 222 year 250
fire cycle used for the basic assumption. In the absence of fires over the course of 100 years, C sequestered 251
would have been 738 318 Mg C. On the other hand, if fire frequencies remained as observed on the pre-252
flooded territory in the last 100 years (127 year cycle with 79% of the territory burned), the flooded forest 253
would have been a net source of C over 100 years, with emission of 34 378 Mg C. The threshold for 254
capture/emission balance was 75 % of burned territory; above that the territory became a net source. 255
3.4.3. Regeneration variations
256
The eleven stand regeneration hypotheses tested had a slight impact on cumulated net biome 257
productivity (Figure 3d), with an increase of 7% from the basic assumption, to reach 325 042 Mg C. 258
259
3.5. Carbon sink/source per GWh
As per equation 2, the C footprint associated with land-use change for the Eastmain-1 flooded 261
forested territory corresponds to a total C sink loss of 303 489 Mg C after 100 years. Expressed as a C sink 262
loss per unit of produced energy based on equation 3, it corresponds to a C footprint of 4 ± 2 t CO2 eq. GWh -263
1. The uncertainty (± 2 t CO2 eq. GWh-1) corresponds to the confidence interval (170-313 years) proposed by 264
Bergeron et al. (2010) for fire cycles. 265 𝐶𝐶𝐶𝐶𝐺𝐺𝐺𝐺ℎ= 303 489 𝐷𝐷𝑀𝑀 𝐶𝐶 × 𝟑𝟑. 𝟔𝟔𝟔𝟔 (𝟐𝟐𝟔𝟔𝟏𝟏𝟏𝟏 𝐆𝐆𝐆𝐆𝐆𝐆 × 𝟏𝟏𝟏𝟏𝟏𝟏 𝐲𝐲𝐲𝐲𝐲𝐲𝐲𝐲𝐲𝐲)⁄ = 4.1 𝐷𝐷𝑀𝑀 𝐶𝐶𝐷𝐷2 𝑒𝑒𝑒𝑒. 𝐺𝐺𝐺𝐺ℎ−1 266 267 4. DISCUSSION 268
4.1. Pre-flooding carbon stocks evaluation
269
Estimated pre-flooding C stocks using CBM-CFS3 are similar to those obtained by Paré et al. (2011) 270
on a small selection of stands from nearby sites which shows that the selection of growth and yield table to 271
feed the model were adequate. Dead organic matter (DOM) C stocks in the simulation were 108 Mg C ha-1, 272
29 Mg C ha -1 higher than that of field measurements in Paré et al. (2011). However, annual rates of litter 273
accumulation are similar: first year of simulation with 1.5 Mg C ha-1 year-1 (mean stand age 59 years) 274
compared to observed1.4 ± 0.2 Mg C ha-1 an-1 (mean stand age 41 years) in Paré et al. (2011) suggesting that 275
the decay rate observed in the field is faster than what the model uses. Using the latter result and projecting it 276
at a mean stand age of 59 years, we obtain a potential increase of accumulated litter of 25 ± 4 Mg C ha-1, and 277
totalC stocks of 104 ± 4 Mg C ha-1. Our simulated density of DOM is also near the range of 75 to 100 Mg C 278
ha-1 predicted in Tremblay et al. (2005) for the same area (see Figure 4 therein) once again suggesting that 279
the model behave adequately and that the growth and yield table selection were appropriate. 280
According to our simulations of the flooded territory, 19 % of the C stock was in the biomass. These 281
results are within the 14 % to 33 % of C stocks in the biomass found in field-based observations from the 282
literature for the boreal forest (Bergeron et al., 2007 and Moroni et al., 2010). 283
284
4.2. Carbon fluxes and stocks
285
The estimated net primary productivity (NPP) of 2.12 (2.28/1.86) Mg C ha-1 y-1 does not always 286
concur with field observations in the literature. A study on the semi-arid boreal forest, using data from 287
circumpolar flux towers, obtained a mean NPP of 3.3 ± 0.6 Mg C ha-1 y-1 (Bergeron et al., 2007). Another 288
study, near Chibougamau, Québec (approx. 300 km south-east from the study area) estimated that a 91-year-289
old black spruce stand had a NPP of 5.84 ± 0.07 Mg C ha-1 y-1 (Luyssaert et al., 2007). Differences in stand 290
age and low productivity (low site index) of the study area can explain this variation in NPP. It has also been 291
shown that the CBM-CFS3 model may underestimate biomass net growth by 10 % (Bernier et al., 2009), 292
which may explain some of the difference in NPP observed between our study and that of Bergeron et al. 293
(2007). 294
The estimated net ecosystem productivity (NEP) value of our study of 0.15 (-0.01/0.32) Mg C ha-1 y-1 295
contributes to a large array of values from the literature reporting NEP in boreal ecosystems: from -2.5 to 2.0 296
Mg C ha-1 y-1 (Amiro et al., 2010, Bergeron et al., 2007 and Luyssaert et al., 2007). The values vary mostly 297
with the methodology used, growth conditions, occurrence of disturbances and stand age. Simulated 298
decomposition (DOMD) emissions of 1.97 (1.81/2.09) Mg C ha-1 y-1 was lower than reported field 299
observations for the same type of forest, with 2.5 ± 0.3 Mg C ha-1 y-1 or 5.8 ± 0.1 Mg C ha-1 y-1 (Bergeron et 300
al., 2007 and Luyssaert et al., 2007). The fact that these latter stands are located in the central part of 301
Québec’s boreal forest, warmer and more productive than those near the Eastmain reservoir, might explain 302
much of this difference in heterotrophic decomposition. 303
To our knowledge, it is the first time that simulated values of forest C fluxes (NPP, NEP and HR) and 304
stocks are provided to such a northerly region of the boreal forest. 305
4.3. Sensitivity tests
Of the three factors tested for their effects on the model (volume yields, fire cycles and stand 307
regeneration), fire cycles was by far the most influential with a +43 % to -46 % variation in NBP; to keep the 308
model conservative, the confidence interval around the calculated NBP was set according to that of the 222 309
year fire cycle range. In the absence of any fires during the 100 year life expectancy of the power plant 310
(unrealistic scenario), the flooded territory would have accumulated 738 318 Mg C, or 0.17 Mg C ha-1 y-1 311
(corresponding to 10 Mg CO2 éq GWh-1) which is somewhat similar to the net ecosystem productivity 312
suggested in the literature for more productive boreal ecosystems (Amiro et al. 2010, Bergeron et al. 2007 313
and Luyssaert et al. 2007). Conversely, simulating the observed shorter fire cycle of the flooded area over the 314
next hundred years resulted in a modelled territory that would be a net source of emissions (-34 378 Mg C or 315
-0.5 Mg CO2 eq GWh-1) instead of a net sink. In other words, in the case of a 127 year-long fire cycle 316
scenario, the creation of the reservoir resulted in fewer emissions than the natural forest (without 317
anthropogenic disturbance). The simulation without any fire pattern, whereby the percentage of burned 318
territory remained the same year after year, only reduced the NPB by 5 000 Mg C, indicating that fire pattern 319
is not an issues in this simulation. Hence, the submerged territory was possibly a net source during the 320
century before the flooding, given the observed 127 year fire cycle. Using the 222 year fire cycle from 321
Bergeron et al. (2010)as a conservative measure in this C footprint calculation, we estimated that this 322
territory would have sequestered a net 300 000 Mg C after 100 years, with a ± 150 000 Mg C range, which 323
corresponds to 4 ± 2 Mg CO2 éq GWh-1. To sum up, this modeling approach has shown how crucial it is to 324
include fire disturbance dynamics in models for the boreal zone, as it is the principal source of variability and 325
a major cause for concern given the expected impacts of climate change on fire cycle regime in this area (Le 326
Goff et al., 2009). 327
328
4.4. Forest inventory and yield tables
The upland forest inventory used in this study (from pre-flooding aerial photographs taken in 1999), 330
yielded C stocking results comparable to a field inventory on a nearby site (Paré et al., 2011), which further 331
warrants the reliability of our simulations. 332
Volume yield estimates were obtained from growth and yield tables southward of the study area, 333
which could have led to an overestimation of C stocking. However, sensitivity tests performed on volume 334
yield tables showed that ± a 20 % variation created much less fluctuation than fire cycles (Figure 3d vs. 3c), 335
which was then chosen as the range for the confidence interval of the model output, consequently including 336
all the possible variation pertaining to the volume yield tables and to the photo interpreted forest inventory. 337
Stand age class used (0, 30, 50, 70, 90 and 120+ years) could also be a source of error, with mean age 338
obtained by photo interpretation of 59 years as opposed to the 41 years measured in the field by Paré et al. 339
(2011).Should average stand age be 41 years, wood volume from production tables would correspond to 20 340
m3 ha-1 less than that in the model; again, this is well within +43 % to -46 % range applied to the model 341
outputs, given the variability induced by fire cycles. 342
343
4.5. Carbon sink/source per unit of electricity produced
344
The 73% forested territory in this study was permanently transformed into a hydroelectric reservoir, 345
corresponding to a change in land use according to the IPCC (Solomon et al., 2007). Hence, this impact 346
should be included in the C footprint of the production of 1 kWh by Hydro-Québec, following the ISO 347
14 067 guidelines (ISO/DIS 14067, 2013). The estimated C balance associated with the upland forest cover 348
change of the Eastmain-1 flooded territory correspond to emissions (or a loss of C sink) of 4 ± 2 Mg CO2e 349
GWh-1. This is 8 times less than the ≈32 Mg CO2e GWh-1 estimated from Teodoru et al. (2012), but remains 350
within the wide range they reported, i.e. a C sink of 76 Mg CO2e GWh-1 to a source of 11 Mg CO2e GWh-1. 351
They also estimated NEP to be 117 mg C m2 d-1 with a range from 250 to -15 mg C m-2 d-1 (Teodoru et al., 352
2012). Their estimates of net ecosystem exchange are based on three years of sampling (2006-2009) with one 353
Eddy covariance flux tower in black spruce closed canopy completed by available data in the literature. The 354
emissions caused by forest fires were extracted from the literature with 21 mg C m-2 d-1 (ranging from 15 to 355
28 mg C m-2 d-1). However, forest stands evolution over time and fire dynamics are not accounted for in their 356
estimates. We believe that our methodology to evaluate the impact of upland forest cover change improves 357
our ability to evaluate the GHG fluxes of upland forest of the flooded territories and better ascertain the C 358
intensity of the Eastmain-1 hydroelectric plant. In 2012, electricity production from Eastmain-1a increased 359
with the diversion of the Rupert River into the Eastmain reservoir. The hydroelectric plant now generates 6.9 360
TWh per year. When integrating the added energy produced since 2012 by the Eastmain-1A in our 361
calculations, the loss of upland forest C sink per unit of energy becomes 1.6 ± 0.8 Mg CO2e GWh-1.
362
The resulting emission factor per unit of energy produced is a measure of the forest C sinks loss for 363
the Eastmain-1 reservoir. Our methodology can be used for other reservoirs, given a certain number of 364
adjustments to the model in accordance with local characteristics. Important local adjustments include the 365
reservoir surface area, forest stand types, productivity and age structure, but principally, as shown in this 366
study, the fire cycle. Forest can also be vastly affected by other important disturbances, such as insect 367
infestation like the spruce budworm (Dymond et al., 2010). The eventual modelling of this biotic disturbance 368
is of interest, as it would modify forest C fluxes differently. 369
370
5. Conclusion
371
In conclusion, the creation of the Eastmain-1 reservoir represents a loss of the upland forest C sink of 372
4 ± 2 Mg CO2e per GWh of electricity produced, because of the upland forest cover change caused by the 373
flooding. Our estimations substantially increase the precision of recent figures for the upland forest C 374
sink/source fluxes of this hydroelectric reservoir using a Eddy covariance flux tower and data from the 375
literature (Teodoru et al., 2012), resulting in a marked reduction of the upland forest cover change 376
contribution to the net C footprint of this boreal hydroelectric reservoir. From 20% of the total C footprint 377
calculated in Teodoru et al. (2012), our study scales down the upland forest contribution to the net C 378
footprint of the reservoir to a mere 3%. Consequently, the long-term net C footprint of the Eastmain-1 379
hydroelectric reservoir would be 130 t CO2e GWh-1 rather than 158 presented in Teodoru et al. (2012). This 380
study also suggests that the relative contribution of land-use change to the C balance of the creation of a 381
hydroelectric reservoir in the boreal zone can be considered minor, if not negligible, relative to the long-term 382
net C footprint of such boreal hydroelectric reservoirs. 383
384
Acknowledgments
385
We thank sincerely Jérôme Saillant (Consultants forestiers DGR inc.) and Tony Côté (Plani-Forêt) for 386
the photo-interpretation and forest inventory data, Jessica Banville-Lagacé (UQAM) for providing field data, 387
and Stephen J. Kull (Forest Carbon Accounting team, CFS) for helpful advices provided during model 388
simulation. This research was funded by a contract from Hydro-Québec to the CIRAIG (R. Samson) and the 389
Chair in Eco-advising (C. Villeneuve), the Natural Sciences and Engineering Research Council of Canada 390
(NSERC) – Collaborative Research and Development Grant (J.-F. Boucher), and UQAC’s Carbone boréal 391 program. 392 393 References 394
Amiro, B.D., Barr, A.G., Barr, J.G., Black, T.A., Bracho, R., Brown, M., Chen, J., Clark, K.L., Davis, K.J., 395
Desai, A.R., Dore, S., Engel, V., Fuentes, J.D., Goldstein, A.H., Goulden, M.L., Kolb, T.E., Lavigne, 396
M.B., Law, B.E., Margolis, H.A., Martin, T., McCaughey, J.H., Misson, L., Montes-Helu, M., Noormets, 397
A., Randerson, J.T., Starr, G., Xiao, J., 2010. Ecosystem carbon dioxide fluxes after disturbance in forests 398
of North America. J. Geophys. Res. -Biogeosciences 115, 2005-2012. 399
Amiro, B.D., Stocks, B.J., Alexander, M.E., Flannigan, M.D., Wotton, B.M., 2001. Fire, climate change, 400
carbon and fuel management in the Canadian boreal forest. Int. J. Wildland Fire 10, 405-413. 401
Bergeron, O., Margolis, H.A., Black, T.A., Coursolle, C., Dunn, A.L., Barr, A.G., Wofsy, S.C., 2007. 402
Comparison of carbon dioxide fluxes over three boreal black spruce forests in Canada. Glob. Chang. 403
Biol. 13, 89-107. 404
Bergeron, Y., Cyr, D., Girardin, M.P., Carcaillet, C., 2010. Will clilmate change drive 21st century burn rates 405
in Canadian boreal forest outside of its natural variability: collating global climate model experiments 406
with sedimentary charcoal data. Int. J. Wildland Fire 19, 1127-1139. 407
Bergeron, Y., Gauthier, S., Kafka, V., Lefort, P., Lesieur, D., 2001. Natural fire frequency for the eastern 408
Canadian boreal forest: consequences for sustainable forestry. Can. J. Forest Res. 31, 384-391. 409
Bernier, P.Y., Guindon, L., Kurz, W.A., Stinson, G., 2009. Reconstructing and modelling 71-years of forest 410
growth in a Canadian boreal landscape- a test of CBM-CFS3 carbon accounting model. Can. J. Forest 411
Res. 40, 109-118. 412
Carlson, M., Chen, J., Elgie, S., Henschel, C., Montenegro, A., Roulet, N., Scott, N., Tarnocai, C., Wells, J., 413
2010. Maintaining the role of Canada’s forests and peatlands in climate regulation. Forest. Chron. 86, 414
434-443. 415
Chertov, O., Bhatti, J.S., Komarov, A., Mikhailov, A., Bykhovets, S., 2009. Influence of climate change, fire 416
and harvest on the carbon dynamics of black spruce in Central Canada. Forest Ecol. Manag. 257, 941-417
950. 418
CWIFS, 2012. Large Fires Data Base. Natural Resources Canada, Canada Government, Canada. 419
Dymond, C.C., Neilson, E.T., Stinston, G., Porter, K., MacLean, D., Gray, D., Campagna, M., Kurz, W.A., 420
2010. Future spruce budworm outbreak may create a carbon source in eastern Canadian Forest. 421
Ecosystems 13, 917-931. 422
Edenhofer, O., R. Pichs-Madruga, Y. Sokona, K. Seyboth, D. Arvizu, T. Bruckner, J. Christensen, J.-M. 423
Devernay, A. Faaij, M. Fischedick, B. Goldstein, G. Hansen, J. Huckerby, A. Jäger-Waldau, S. Kadner, 424
D. Kammen, V. Krey, A. Kumar, A. Lewis, O. Lucon, P. Matschoss, L. Maurice, C. Mitchell, W. 425
Moomaw, J. Moreira, A. Nadai, L.J. Nilsson, J. Nyboer, A. Rahman, J. Sathaye, J. Sawin, R. Schaeffer, 426
T. Schei, S. Schlömer, R. Sims, A. Verbruggen, C. von Stechow, K. Urama, R. Wiser, F. Yamba, T. 427
Zwickel, 2011: Summary for Policy Makers. In: IPCC Special Report on Renewable Energy Sources and 428
Climate Change Mitigation [O. Edenhofer, R. Pichs-Madruga, Y. Sokona, K. Seyboth, P. Matschoss, S. 429
Kadner, T. Zwickel, P. Eickemeier, G. Hansen, S. Schlömer, C. v. Stechow (eds)], Cambridge University 430
Press, Cambridge, United Kingdom and New York, NY, USA. 431
Flannigan, M.D., Logan, K.A., D., A.B., Skinner, W.R., Stocks, B.J., 2005. Future area burned in Canada. 432
Clim. Chang. 72, 1-16. 433
Hydro Québec. 2015. Annual Report 2014. Hydro-Québec, Affaires corporatives et secrétariat General, 434
Montréal (QC), Canada. ISBN 978-2-550-72312-7, 2014G27SF. 118 p. 435
ISO, 2006. Greenhouse gases–Part 2: Specification with guidance at the project level for quantification, 436
monitoring and reporting of greenhouse gas emission reductions of removal enhancements. ISO, Geneva, 437
Switzerland. 438
ISO, 2013. ISO 14067 : Empreinte carbone des produits: exigences et lignes directrices pour la quantification 439
et la communication, in: ISO (Ed.). International Standardisation Organisation Genève, Suisse. 440
Kurz, W.A., Dymond, C.C., White, T.M., Stinson, G., Shaw, C.H., Rampley, G.J., Smyth, C., Simpson, B.N., 441
Neilson, E.T., Trofymow, J.A., Metsaranta, J., Apps, M.J., 2009. CBM-CFS3: A model of carbon-442
dynamics in forestry and land-use change implementing IPCC standards. Ecol. Model. 220, 480-504. 443
Lauzon, E., Bergeron, Y., Gauthier, S., Kneeshaw, D., 2006. Fire Cycles and Forest Management: An 444
alternative Approach for Management of the Canadian Boreal Forest. Sustainable Forest Management 445
Network, Edmonton, Alberta. 446
Le Goff, H., Flannigan, M.D., Bergeron, Y., 2009. Potential changes in monthly fire risk in the eastern 447
Canadian boreal forest under future climate change. Can. J. Forest Res. 39, 2369-2380. 448
Le Goff, H., Flannigan, M.D., Bergeron, Y., Girardin, M.P., 2007. Historical fire regime shifts related to 449
climate teleconnections in the Waswanipi area, central Quebec, Canada. Int. J. Wildland Fire 16, 607-450
618. 451
Luyssaert, S., Inglima, I., Jung, M., Richardson, A.D., Reichstein, M., Papale, D., Piao, S.L., Schulze, E.-D., 452
Wingate, L., Matteucci, G., Aragao, L., Aubinet, M., Beer, C., Bernhofer, C., Black, K.G., Bonal, D., 453
Bonnefond, J.-M., Chambers, J., Ciais, P., Cook, B., Davis, K.J., Dolman, A.J., Gielen, B., Goulden, M., 454
Grace, J., Granier, A., Grelle, A., Griffis, T., Grünwald, T., Guidolotti, G., Hanson, P.J., Harding, R., 455
Hollinger, D.Y., Hutyra, L.R., Kolari, P., Kruijt, B., Kutsch, W., Lagergren, F., Laurila, T., Law, B.E., 456
Le Maire, G., Lindroth, A., Loustau, D., Malhi, Y., Mateus, J., Migliavacca, M., Misson, L., Montagnani, 457
L., Moncrieff, J., Moors, E., Munger, J.W., Nikinmaa, E., Ollinger, S.V., Pita, G., Rebmann, C., 458
Roupsard, O., Saigusa, N., Sanz, M.J., Seufert, G., Sierra, C., Smith, M.-L., Tang, J., Valentini, R., 459
Vesala, T., Janssens, I.A., 2007. CO2 balance of boreal, temperate, and tropical forests derived from a 460
global database. Glob. Chang. Biol. 13, 2509-2537. 461
Moroni, M.T., Shaw, C.H., Kurz, W.A., Rampley, G.J., 2010. Forest carbon stocks in Newfoundland boreal 462
forests of harvest and natural disturbance origin II: model evaluation. Can. J. Forest Res. 40, 2146-2163. 463
MRN, 2000. Mise à jour, Manuel d'aménagement forestier : Document d'annexes, Annexe 1, in: Québec, G.d. 464
(Ed.). Gouvernement du Québec, Québec. 465
Paré, D., Banville, J.L., Garneau, M., Bergeron, Y., 2011. Soil carbon stocks and soil carbon quality in the 466
upland portion of a boreal landscape, James Bay, Quebec. Ecosystems 14, 533-546. 467
Penman, J., Gytarsky, M., Hiraishi, T., Krug, T., Kruger, D., Pipatti, R., Buendia, L., Miwa, K., Ngara, T., 468
Tanabe, K., Wagner, F., 2003. Good Practice Guidance for Land Use, Land-Use Change and Forestry. 469
The Intergovernmental Panel on Climate Change (IPCC), Institute for Global Environmental Strategies 470
(IGES) for the IPCC. 471
Saucier, J.-P., Grondin, P., Robitaille, A., Gosselin, J., Morneau, C., Richard, P.J.H., Brisson, J., Sirois, L., 472
Leduc, A., Morin, H., Thiffault, É., Gauthier, S., Lavoie, C., Payette, S., 2009. Chapitre 4: Écologie 473
forestière, in: Multimonde, É. (Ed.), Manuel de foresterie, 2e ed. ed. Ordre des ingénieurs forestiers du 474
Québec, Québec, Canada. 475
Solomon, S., Qin, D., Manning, M., Chen, Z., Marquis, M., Averyt, K.B., Tignor, M., (eds.), H.L.M., 2007. 476
Contribution of Working Group I to the Fourth Assessment Report of the Intergovernmental Panel on 477
Climate Change., in: Press, C.U. (Ed.). Cambridge University Press, Cambridge, United Kingdom and 478
New York, NY, USA p. 996. 479
Spath, P.L., Mann, M.K., 2000. Life-cycle assessment of a natural gas combine-cycle power generation system. 480
National Renewable Energy Laboratory, Golden, Colorado. 481
Teodoru, C., Bastien, J., Bonneville, M.-C., del Giorgio, P., Demarty, M., Garneau, M., Hélie, J.-F., Pelletier, 482
L., Prairie, Y., Roulet, N., Strachan, I., Tremblay, A., 2012. The net carbon footprint of a newly created 483
boreal hydroelectric reservoir. Global biogeochem. cy. 26, GB2016, doi:10.1029/2011GB004187. 484
Tremblay, A., Varfalvy, L., Roehm, C., Garneau, M., 2005. Greenhouse Gas Emissions - Fluxes and Processes: 485
Hydroelectric Reservoirs and Natural Environments. Springer, Berlin, Germany. 486
United Nations Framework Convention on Climate Change (UNFCCC), 1998. Kyoto Protocol to the United 487
Nations framework convention on climate change, in: Nations, U. (Ed.). United Nations framework 488
convention on climate change, Bonn, Germany. 489
Tables
491 492
Table 1
493
Carbon stock estimates (CBM-CFS3) in the biomass and dead organic matter pool at year 0 for the 494
flooded Eastmain-1 forest area. 495
Carbon pools C stocks
(Mg)
C stocks (%)
Aerial biomass 889 387 15%
Below ground biomass 207 558 4%
Dead organic matter above ground 2 013 477 35% Dead organic matter below ground 2 640 647 46%
Total 5 751 069 100%
496 497
Table 2
499
Weighted-Average (min/max) of annual carbon flux estimates of the flooded forested land a 500
Type of Carbon flux Carbon flux
Mg C ha-1 y-1 Net primary production (NPP) -2.12 (-2.28/-1.86)
Litter 1.90 (1.51/2.15)
Decomposition (DOMD) 1.97 (1.81/2.09) Net ecosystem productivity (NEP) -0.15 (0.01/-0.32)
Disturbance (CD) 0.08 (0.00/0.90)
Net biome productivity (NBP) -0.07 (0.89/-0.32)
aNegative values in the table represent C sink. Values between parentheses correspond to 501
lower and upper limit estimates. 502
Figures
504 505
506
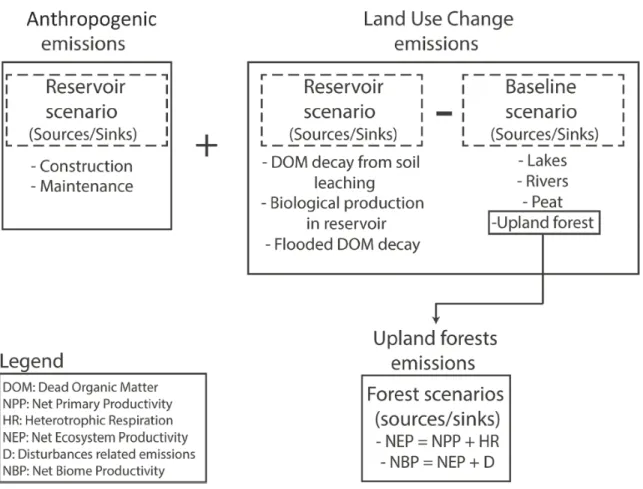
Fig. 1. Schematic representation of the C footprint assessment in this study, showing where the upland forest
507
sources/sinks specific contribution in the overall net C footprint stands. 508
510
Fig. 2. Location of the study area in Québec, Canada (upper right). The squared area in the middle corresponds
511
to the flooded territory, and the whole area represents the sector from which fire data were extracted from the 512
Natural Resources Canada large fire database. 513
515
Fig. 3. Cumulated Net biome productivity (NBP) (Mg C ha-1) of the flooded forested land over 100 year 516
following (a) baseline scenario, and sensitivity analysis on (b) growth and yield table, (c) fire cycle length and 517
(d) stand composition following fire event. 518
S1
Supplemental information
on the article
Uncovering the minor contribution of land-cover
change in upland forests to the net carbon footprint of a
boreal hydroelectric reservoir
by
Pierre-Luc Dessureault, Jean-François Boucher, Pascal
Tremblay, Sylvie Bouchard, Claude Villeneuve
S2
Figure S1. Percentage of yearly burned area (a) of the 43 161 ha flooded forested land
inferred from the Large Fire Database from Natural Ressources Canada and (b) its relative impact on yearly Net Biome Productivity.
a)
S3
S4
Precision on sensitivity analyses performed on stand regeneration patterns
The following cases, based on the available literature on post-fire regeneration in the boreal forest, were tested: 1) no switch in species and no loss in volume yield; 2) fire occurs in a < 60-year-old black spruce stand and tree density (and consequently volume yield) diminishes towards a low tree density stand (28,29,30); 3) balsam fir within a mature black spruce stand disappears after a fire (31); 4) if a fire occurs in < 60-year-old black spruce with jack pine as a companion species, jack pines dominates after the fire (31, 32); 5) if a fire occurs in < 60-year-old black spruce with birch and trembling aspen as companion species, deciduous trees becomes dominant after the fire (31); 6) if a fire occurs in a < 60-year-old spruce-tamarack stand it remains the same (33); 7) if fire occurs in a < 10-year-old jack pine stand, tree density (and volume yield) diminishes towards a low tree density stand (34); 8) if fire occurs in a jack pine stand with black spruce as a companion species < 60-year-old, the latter disappears (31, 32); 9) if fire occurs in a < 10-year-old jack pine stand with trembling aspen as a companion species, jack pine disappears (34); 10) if a fire occurs in a mixed conifer stand < 60-year-old, the balsam fir, tamarack and black spruce disappear and are replaced by jack pine (31, 33); 11) if a fire occurs in a deciduous stand or a mixed conifer stand, it remains the same after fire (35).
S5
Table 1: Attributes table of the 231 forest strata resulting from the grouping of the 2700 initial upland forest stands of the flooded territory.
Stands Attributes
Species Density class Height class Age class Last known disturbance Area (ha)
BBPE B 5 50 7 PEBB B 5 50 11 PEPE A 3 50 2 BB1PG C 4 30 10 BBPG C 4 30 4 BBE B 4 50 24 BBPG A 4 30 12 BBPEPG C 3 50 BRP 12 PGPGBP B 4 30 6 PGPGBP B 4 30 27 EBB B 4 70 BRP 12 EBB D 4 70 14 EPE B 3 70 58 EPE C 4 50 6 EPE D 4 50 10 EPE D 4 50 BRP 26 EPE D 4 70 45 EPE D 4 70 BRP 31 PEE D 3 70 15 PEPEE C 3 70 22 PEPEE D 3 70 16 PEPE C 3 70 20 PEPE D 3 70 30 PGBB B 4 30 10 PGBB C 4 30 7 EPE C 3 70 BRP 10 PEBBE C 3 50 16 PEBBE C 3 50 BRP 46 PEBBPG C 3 50 14 M6 B 4 30 30 M6 30 BR 381 M A 5 30 BR 67 M B 5 30 BR 699 M B 5 90 BR 12 M C 3 30 BR 21 M C 5 30 BR 830 M D 5 120 BR 17 M D 5 30 BR 1425 EE A 4 70 6 EE B 3 50 12 EE B 3 70 223 EE B 4 50 70 EE B 4 70 273 EE B 4 90 24 EE B 3 90 35 EE B 3 120 286 EE B 4 30 12 EE B 4 120 190 EE C 3 120 1367 EE C 3 70-120 61 EE C 4 120 1037 EE C 4 70-120 19 EE C 3 120 568 EE C 3 90 81
S6
Species Density class Height class Age class Last known disturbance Area (ha)
EE C 4 70 430 EE D 4 VIN 10 EE C 3 50 8 EE C 4 30 10 EE C 4 50 5 EE D 3 120 509 EE D 4 120 1540 EE D 3 50 15 EE D 3 70 157 EE C 4 90 52 EE D 3 90 50 EE D 4 50 109 EE D 4 70 969 EE D 4 90 49 EPG D 3 120 120 EPG D 3 50 54 EPG D 3 70 684 EPG D 3 90 64 EPG D 4 120 26 EPG D 4 30 60 EPG D 4 50 821 EPG D 4 70 1336 EPG D 5 50 1 EME B 3 120 6 EME B 3 120 BRP 6 EME B 4 120 7 EME C 3 120 140 EME C 3 120 BRP 13 EME C 3 70 11 EME C 3 90 2 EME C 4 120 21 EME D 3 120 99 EME D 3 120 BRP 8 EME D 3 70 28 EME D 4 120 93 EME D 4 120 BRP 5 MEE C 3 120 5 MEE D 3 120 45 MEE D 3 120 BRP 18 MEE D 4 120 27 MEME D 3 120 26 EPG B 4 120 17 EPG B 4 30 47 EPG B 4 70 227 EPG C 4 120 47 EPG C 4 30 54 EPG C 4 50 186 EPG C 4 70 462 EPG C 4 90 6 EPG C 5 120 2 EPG B 3 120 BRP 24 EPG B 3 50 7 EPG B 3 70 425 EPG B 3 90 38 EPG B 4 50 44 EPG C 3 120 116 EPG C 3 70 534 EPG C 3 90 111 ES B 3 120 15
S7
Species Density class Height class Age class Last known disturbance Area (ha)
ES B 3 30 1 ES B 3 70 45 ES B 3 90 41 ES B 4 50 6 ES B 5 70 6 ES C 3 120 330 ES C 3 70 72 ES C 4 70 45 PGE B 3 50 154 PGE B 3 70 13 PGE B 3 120 36 PGE B 3 70 466 EPG B 3 50 38 PGE B 3 50 214 BR BR 5030 PGE B 4 30 117 PGE B 4 50 56 PGE B 4 70 10 PGE C 4 30 99 PGE C 4 50 220 PGE C 4 70 91 R6 30 BR 970 R A 5 30 BR 27 R A 5 30 BR 9 R B 5 30 BR 218 R C 5 30 BR 306 R C 0 30 BR 44 R D 3 30 BR 68 R D 5 30 BR 3294 PGE D 3 120 43 PGE D 3 50 248 PGE D 3 70 573 PGE D 4 30 178 PGE D 4 50 273 PGE D 4 70 206 PGPG D 3 50 125 PGPG A 3 70 49 PGPG A 4 30 124 PGPG A 4 50 25 PGPG C 4 30 416 PGPG C 4 50 101 PGPG C 4 70 29 PGPG D 4 30 581 PGPG D 4 50 166 PGPG D 4 70 33 PGE C 3 120 114 PGE C 3 120 566 PGE C 3 90 11 PGPG B 3 30 5 PGPG B 3 50 441 PGPG B 3 70 427 PGPG B 4 30 434 PGPG B 4 50 209 PGPG B 4 70 11 PGPG C 3 50 156 PGPG C 3 70 297 PGPG D 3 70 394 EE C 3 120 CHP 21 EE C 3 70 CHP 5
S8
Species Density class Height class Age class Last known disturbance Area (ha)
EE D 3 120 CHP 80 ES C 3 VIN CHP 37 ES C 3 70 CHP 23 ES C 3 120 BRP 50 ES D 3 120 BRP 45 ES D 3 120 CHP 13 EE C 4 50 BRP 2 EE C 4 70 BRP 21 EE C 4 90 BRP 21 EE C 5 120 BRP 10 EE D 4 120 BRP 685 EE D 4 50 BRP 91 EE D 4 70 BRP 302 ME D 5 120 BRP 9 ES C 3 70 BRP 14 ES C 4 70 BRP 26 ES C 4 70 CHP 16 ES D 4 120 BRP 18 ES D 4 70 BRP 37 EE D 5 120 BRP 12 ES D 3 70 BRP 20 EPG B 3 50 BRP 11 EPG B 4 70 BRP 16 EPG C 4 50 BRP 6 EPG C 4 70 BRP 14 EE B 3 120 BRP 50 EE C 2 120 BRP 12 EE C 3 120 BRP 943 EE C 3 70 BRP 174 EE C 3 90 BRP 54 EE C 4 120 BRP 326 EE D 3 120 BRP 2052 EE D 3 50 BRP 38 EE D 3 70 BRP 445 EE D 3 90 BRP 45 EPG C 3 120 BRP 10 EPG C 3 70 BRP 17 EPG C 3 90 BRP 9 EPG D 3 50 BRP 41 EPG D 3 70 BRP 100 EPG D 3 90 BRP 10 EPG D 4 50 BRP 276 EPG D 4 70 BRP 77 EPG D 5 30 BR 14 PGE B 3 70 BRP 30 PGE C 3 30 BRP 15 PGE C 3 50 BRP 8 PGE C 4 30 BRP 25 PGE C 4 50 BRP 25 PGE C 5 70 BRP 8 PGE D 3 120 BRP 49 PGE D 3 50 BRP 52 PGE D 4 50 BRP 33 PGPG C 3 70 BRP 4 PGPG C 4 30 BRP 10 PGPG C 4 50 BRP 32 PGPG D 3 120 BRP 5 PGPG D 3 50 BRP 27 PGPG D 4 30 BRP 9
S9
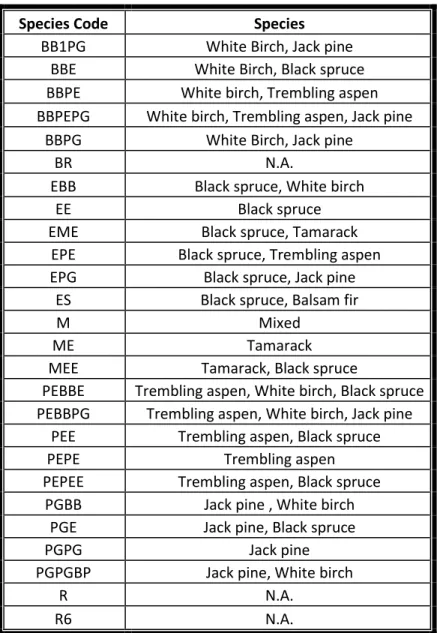
Table 2: Description of species codes used to describe the forest strata of Table 1 in the supporting information
Species Code Species
BB1PG White Birch, Jack pine BBE White Birch, Black spruce BBPE White birch, Trembling aspen BBPEPG White birch, Trembling aspen, Jack pine
BBPG White Birch, Jack pine
BR N.A.
EBB Black spruce, White birch
EE Black spruce
EME Black spruce, Tamarack EPE Black spruce, Trembling aspen EPG Black spruce, Jack pine
ES Black spruce, Balsam fir
M Mixed
ME Tamarack
MEE Tamarack, Black spruce
PEBBE Trembling aspen, White birch, Black spruce PEBBPG Trembling aspen, White birch, Jack pine
PEE Trembling aspen, Black spruce
PEPE Trembling aspen
PEPEE Trembling aspen, Black spruce PGBB Jack pine , White birch
PGE Jack pine, Black spruce
PGPG Jack pine
PGPGBP Jack pine, White birch
R N.A.
R6 N.A.
N.B.: Species order of appearance in the species codes column represents their relative contribution to the stand wood volume (m3)
Table 3: Description of density class used to describes the forest strata of Table 1 in the supporting information
Density Class Cover (%)
A 80-100
B 60-80
C 40-60
S10
Table 4: Description of Height class used to describes the forest strata of Table 1 in the supporting information
Height Class Height (m) 0 0 2 17-22 3 12-17 4 7-12 5 4-7
Table 5: Description of Age class used to describes the forest strata of Table 1 in the supporting information
Age Class Age (years)
30 21-40 50 41-60 70 61-80 90 80-100 120 100+ 70-120 61-80 & 100+ VIN Multi cohort
Table 6: Description of the disturbance type used to describes the forest strata of Table 1 in the supporting information
Disturbance type Description
BR Fire
BRP Partial fire CHP Partial windthrow