The photoabsorption spectrum of vinylchloride ( C
2H
3C1) in the
8-12 eV range
R. Locht a, B. Leyh a,1, K. Hottmann b, H. Baumgärtel b
a Département de Chimie Générale et de Chimie Physique, Institut de Chimie Bât.B6c, Université de Liège, Sart-Tilman par B-4000 Liège 1, Belgium
b Institut für Physikalische und Theoretische Chemie, Freie Universität Berlin, Takustraβe 3, D-14195 Berlin, Germany
Abstract
The photoabsorption spectrum of vinylchloride (C2H3C1) has been measured using synchrotron
radiation and has been analyzed in detail between 8.0 eV and 12.0 eV photon energy. Valence to virtual valence and Rydberg transitions have been identified and classified. Tentative assignments were based on ionization energies as measured by He(I) and threshold photoelectron spectroscopy, as reported in the joined paper [1]. Many features have been identified as being members of vibrational progressions belonging to the observed Rydberg series.
1. Introduction
The energy and structure of the neutral as well as the ionic ground and excited states of ethylene and its halogenated derivatives are of considerable interest for understanding the gas phase photochemistry and ion chemistry of this class of compounds which play an important role in many fields of chemistry.
On the other hand, though having been the subject of extended investigations by several mass spectrometric and spectroscopic techniques, these compounds remain ideal molecular systems for the study of the influence of the position and nature of the substituent on the dynamics of isolated molecular ions and clusters [2, 3]. This requires the detailed examination of well-chosen members of these chemical compounds.
For these reasons, we were interested firstly in extending the spectroscopic data related to these molecular systems by investigating e.g. their photoabsorption spectrum. We started with vinylchloride (C2H3C1)
for which the only known vacuum UV photoabsorption spectrum was published by Sood and Watanabe in 1966 [4]. We will report here on the photoabsorption spectrum of this molecular species between 8 and 12 eV photon energy. Photoionization experiments related to this molecule will be described in a companion paper [1]. 2. Experimental
In the experiment reported here, we used the vacuum UV light from the synchrotron radiation provided by the electron storage ring BESSY (Berlin). This light is dispersed by a 3 m normal incidence monochromator (3m-NIM-l line) equipped with a 2400 lines/mm Pt-grating. The entrance and exit slit widths were set at 50 µm to 200 µm depending on the signal intensity. The experimental resolution obtained in these conditions was estimated to be about 0.03 nm to 0.09 nm respectively. Owing to the second order contribution at low photon energy, LiF or MgF2 windows were used in the 8.0-11.8 eV and 8.0-10.8 eV ranges respectively. The photon
energy scale of the monochromator is calibrated with rare gas photoabsorption and/or threshold photoelectron spectra to reach an accuracy better than 2-3 meV. For this purpose, usually Ar and sometimes Xe are used.
The light beam is focussed into an ion chamber, in the focussing plane of a tandem electron spectrometer consisting of two 180° electrostatic deflectors, shown in Fig. 1 and used for photoelectron spectroscopic experiments. The photoelectron signal of a gold diode, inserted in the ion chamber, in front of the 3m-NIM monochromator exit slit is used to measure relative photoabsorption cross sections of a target gas filling the ion chamber at a known pressure. The collected photoelectron signal from the gold diode is recorded as a function of the photon energy. This signal is normalized to the blank spectrum obtained by measuring the photoelectron signal from the gold diode without sample gas in the ion chamber. During these measurements the power supplies of the electron spectrometer and the channeltron are switched off.
The C2H3C1 sample used in these experiments, purchased from Linde AG (99% purity), is introduced
without further purification. The ultimate vacuum in the ionization chamber is about 10-8 mbar. Unless otherwise
stated, the 3m-NIM monochromator entrance and exit slit widths are 200 µm for the present experiment.
1
3. Experimental results
The vacuum UV absorption spectrum, recorded between 8.0 eV and 11.8 eV with MgF2 and LiF
windows, is shown in Fig. 2a-c in an expanded photon energy scale. The comparison of the spectrum obtained by Sood and Watanabe [4] with the present results reveals additional previously unresolved structures, e.g. in the energy regions around 8.5 eV or in the 9.1-9.5 eV photon energy range. Between the first and the second ionization limits (at 10.013 and 11.672 eV, respectively [1]) numerous well-resolved features are observed. It must be mentioned that the former authors used a 1 m NIM monochromator equipped with a 1200 lines/mm grating and an LiF window. A H2 discharge lamp was used as excitation source.
Fig. 1. Experimental setup used in this work showing the ionization chamber and the gold-diode.
4. Discussion
4.1. The valence transitions
The photoabsorption spectrum of C2H3Cl shows abundant sharp structures superimposed on broad
bands. This is clearly illustrated in Fig. 3 displaying the overall spectrum observed from 8.0 eV to 12.0 eV using LiF and MgF2 windows. This general shape leads us to assume that both valence excitations and Rydberg
transitions contribute to the spectrum. This has already been observed in photoabsorption spectra of similar compounds, i.e. in the fluorochloroethenes [5]. This result is not easy to compare with the spectrum published on an extended wavelength scale by Sood and Watanabe [4]. However, more recently Sze et al. [6] investigated the electron energy loss spectrum of C2H3Cl. These authors mentioned also the presence of underlying valence to
virtual valence transitions which would be consistent with the apparently rising background and overall intensity distribution in this photon energy range. Some of these bands were tentatively identified in the photoabsorption spectrum and characterized by 'maxima' labeled A to E in Fig. 3. Several bands could be located successively at about 8.54 eV, 9.40 eV, 9.85 eV, around 10.3 eV, at 10.68 eV and at 11.56 eV. With the help of a term scheme shown in Fig. 4, based on data published by Sze et al. [6] and on the photoelectron spectroscopic results obtained in this work (see Table 1 in the companion paper [1]), an assignment could be attempted and the result is shown in Table 1. In the energy range investigated in this work, nearly all transitions predicted in this scheme seem to be observed.
4.2. The Rydberg transitions
In the energy range covered in the present study most of the Rydberg transitions can be classified and identified by using the series formula
where ERydb is the observed Rydberg energy, IE is the ionization energy, is the Rydberg constant (taken to be
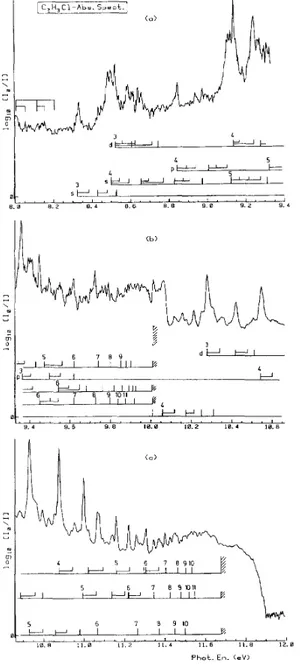
Fig. 2. The photoabsorption spectrum of C2H3Cl recorded between 8.0 eV and 12.0 eV and shown on an
extended photon energy scale. Interpretation and assignments in terms of Rydberg series are included.
Table 1 Correlation between predicted and observed valence → virtual valence transitions in the photoabsorption spectrum of C2H3Cl and tentative assignments. Energies are expressed in eV
Energies observed predicted Assignment - 7.96 p||(Cl) → σ*(C-Cl) 8.54 8.35 p||(Cl) → π *(C=C) 9.38 9.47 p┴(Cl) → σ*(C-Cl) 9.80 σ(C-Cl) → σ*(C-Cl) 9.83 - 9.85 p┴(Cl) → π*(C=C) 10.3-10.7 10.18 σ(C-Cl) → π*(C=C) 11.56 11.63 5a' → σ * (C-Cl) - 12.01 5a' → π*(C=C)
value is essentially related to the nature of the Rydberg orbital. The ionization energies used in this formula are those determined in the present work, i.e. 10.013 ± 0.005 eV and 11.672 ± 0.005 eV respectively, corresponding to the ground state and first excited state of the molecular ion (see Table 1 in Ref. [1]). As shown in Fig. 2a-c the fine structure has essentially been assigned to π → ns, np and nd and to p||(Cl) → ns, np and nd transitions,
respectively.
Fig. 3. Photoabsorption spectrum of C2H3Cl, recorded with a LiF window, between 8.0 eV and 12.0 eV photon
energy, showing clearly the underlying contribution from valence to virtual valence transitions indicated by letters A to E.
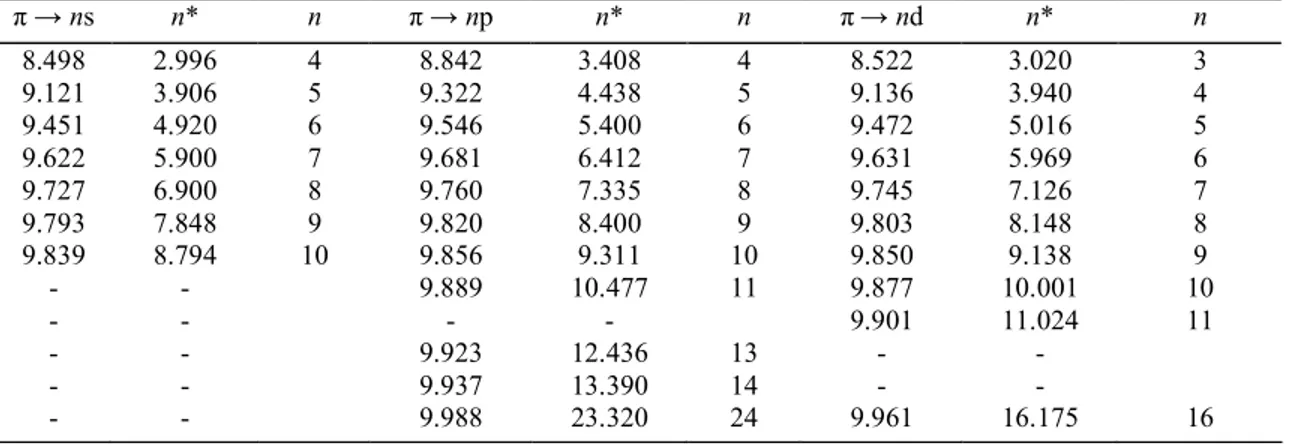
Table 2 Energies (eV) and effective quantum numbers (n*) of three Rydberg series converging to the vibrationless XF 2A" vibronic state of C2H3Cl+ with the limit at 10.013 eV
π → ns n* n π → np n* n π→ nd n* n 8.498 2.996 4 8.842 3.408 4 8.522 3.020 3 9.121 3.906 5 9.322 4.438 5 9.136 3.940 4 9.451 4.920 6 9.546 5.400 6 9.472 5.016 5 9.622 5.900 7 9.681 6.412 7 9.631 5.969 6 9.727 6.900 8 9.760 7.335 8 9.745 7.126 7 9.793 7.848 9 9.820 8.400 9 9.803 8.148 8 9.839 8.794 10 9.856 9.311 10 9.850 9.138 9 - - 9.889 10.477 11 9.877 10.001 10 - - - - 9.901 11.024 11 - - 9.923 12.436 13 - - - - 9.937 13.390 14 - - - - 9.988 23.320 24 9.961 16.175 16
Table 3 Energies (eV) and effective quantum numbers (n* ) of three Rydberg series converging to the vibrationless AF2A' vibronic state of C
2H3Cl+ with the limit at 11.672 eV
p|| → ns n* n p|| → 6np n* n p|| → nd n* n 8.333 2.018 3 9.361 2.426 3 10.278 3.124 3 10.065 2.908 4 10.549 3.480 4 10.878 4.140 4 10.731 3.798 5 11.001 4.504 5 11.160 5.155 5 11.076 4.771 6 11.223 5.507 6 11.310 6.122 6 11.259 5.726 7 11.346 6.460 7 11.403 7.085 7 11.370 6.693 8 11.427 7.456 8 11.463 8.030 8 11.445 7.691 9 11.481 8.445 9 11.506 8.999 9 11.496 8.823 10 11.517 9.376 10 11.532 9.831 10 - - 11.547 10.440 11 - -
Table 4 Comparison of energies (eV) and assignments of the photoabsorption spectrum (a) and the electron energy loss spectrum (b) as proposed by Ref. [4], Ref. [6] and in the present work (1 eV = 8 065.73 cm-1 )
(a)
Ref. [4] This work Ref. [4] This work
Design. Energy Assign. Energy Design. Energy Assign. Energy
R3(3) 8.838 4p 8.842 R2(3) 8.635 3d 8.522 R3(4) 9.309 5p 9.322 R2(4) 9.217 4d 9.136 R3(5) 9.544 6p 9.546 R2(5) 9.496 5d 9.472 R3(6) 9.671 7p 9.681 R2(6) 9.649 6d 9.631 R3(7) 9.756 8p 9.760 - - 7d 9.745 R2(8) 9.802 8d 9.803
Ref. [4] This work
Design. Energy Assign. Energy
R1(2) 8.431 4s 8.498 R1(3) 9.134 5s 9.121 R1(4) 9.447 6s 9.451 R1(5) 9.615 7s 9.622 R1(6) 9.716 8s 9.727 R1(7) 9.790 9s 9.793 R1(8) 9.832 10s 9.839 (b)
Ref. [6] This work Ref. [6] This work
Conv.limit: 10.01 eV Conv.limit: 11.67 eV
Assign. Energy Assign. Energy Assign. Energy Assign. Energy
3d 8.449 4s 8.498 4p 9.322 3p 9.361 8.549 3d 8.522 5s 10.235 3d 10.278 4d 9.203 4d 9.136 5p 10.513 4p 10.549 6s 9.322 5p 9.322 4d 10.700 5s 10.731 6s 10.831 4d 10.878 6p 10.950 5p 11.001
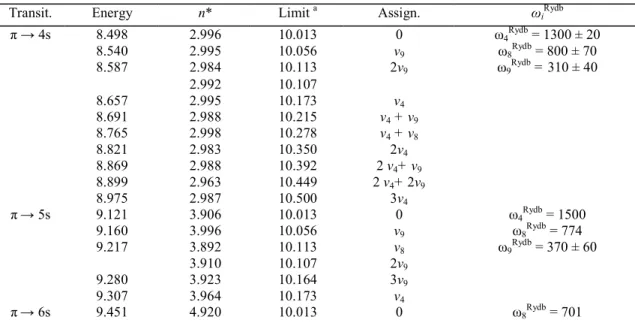
Table 5 Energies (eV), effective quantum numbers (n*), assignments (0 means vibrationless level) and wavenumbers (ωiRydb in cm-1) of vibrational progressions observed in Rydberg series converging to the XF 2A"
vibronic state of C2H3Cl+
Transit. Energy n* Limit a Assign. ω
iRydb π → 4s 8.498 2.996 10.013 0 ω4Rydb = 1300 ± 20 8.540 2.995 10.056 v9 ω8Rydb = 800 ± 70 8.587 2.984 10.113 2v9 ω9Rydb = 310 ± 40 2.992 10.107 8.657 2.995 10.173 v4 8.691 2.988 10.215 v4 + v9 8.765 2.998 10.278 v4 + v8 8.821 2.983 10.350 2v4 8.869 2.988 10.392 2 v4+ v9 8.899 2.963 10.449 2 v4+ 2v9 8.975 2.987 10.500 3v4 π→ 5s 9.121 3.906 10.013 0 ω4Rydb = 1500 9.160 3.996 10.056 v9 ω8Rydb = 774 9.217 3.892 10.113 v8 ω9Rydb = 370 ± 60 3.910 10.107 2v9 9.280 3.923 10.164 3v9 9.307 3.964 10.173 v4 π→ 6s 9.451 4.920 10.013 0 ω8Rydb = 701
9.505 4.970 10.056 v9 ω9Rydb = 435 9.538 4.864 10.113 v8 4.890 10.107 2v9 π→ 4p 8.842 3.408 10.013 0 ω4Rydb = 1306 8.887 3.412 10.056 v9 ω8Rydb = 758 8.936 3.400 10.113 v8 ω9Rydb = 330 ± 40 3.408 10.107 2v9 9.004 3.411 10.173 v4 9.040 3.402 10.215 v4 + v9 9.100 3.398 10.278 v4+ v8 9.109 3.411 π → 5p 9.322 4.438 10.013 0 ω8Rydb = 750 9.415 4.416 10.113 v8 π→ 6p 9.546 5.400 10.013 0 ω8Rydb = 830 9.601 5.469 10.056 v9 ω9Rydb = 440 9.649 5.416 10.113 v8 5.450 10.107 2v9 π→ 3d 8.522 3.020 10.013 0 ω4Rydb = 1310 8.552 3.007 10.056 v9 ω8Rydb = 742 (8.587) (3.044) ω9Rydb = 240 8.614 3.011 10.113 v8 (8.638) (3.037) 3.019 10.107 2v9 8.606 2.946 10.173 v4 8.714 3.010 10.215 v4 + v9 8.743 2.977 10.278 2v4 π→ 4d 9.136 3.940 10.013 0 ω4Rydb= 1282 9.160 3.994 10.056 v9 ω8Rydb = 980 ± 14 9.241 4.078 10.113 v8 ω9Rydb = 302 ± 100 3.963 10.107 2v9 9.295 3.936 10.173 v4 9.346 4.050 10.215 v4 + v9 (9.379) (4.060) 9.433 4.012 10.278 v4 + v8 π → 5d 9.472 5.016 10.013 0 ω8Rydb = 730 9.562 4.970 10.113 v8 or ω9Rydb = 365 4.996 10.107 2v9
a Ionization energies obtained in this work [1].
Nearly all features observed in the photoabsorption spectrum have been classified and assigned to vibronic Rydberg transitions. The energies and assignments of part of these features have been tabulated in Tables 2 and 3 for both the Rydberg series converging to the π-l and p
||-l ionization continua. Most of these
transitions are observed up to fairly high n values.
The comparison with previous photoabsorption spectroscopic work could only be made in the energy range of Rydberg transitions converging to the lowest ionization energy as shown in Table 4(a). Except for the 3d state, there is fairly good agreement between the results published by Sood and Watanabe [4] and those obtained from the present spectrum, regarding both the energy levels and the assignment. In the former work R1
R2 and R3 correspond to ns, nd and np Rydberg states respectively. The series convergence was determined to be
10.00 ± 0.01 eV, in very good agreement with the present He(I) and TPES photoelectron spectroscopic data (see the companion paper [1]).
At the lower end of the photon energy range covered in this work, the first structures in the photoabsorption spectrum are observed between 8.006-8.207 eV and 8.333-8.531 eV. In both energy ranges they seem to correspond to vibrational progressions. However, the latter group shows fairly sharp features whereas the former exhibits more diffuse peaks. The effective quantum number characterizing the 8.006 eV and the 8.333 eV transitions is 1.926 and 2.018 respectively. Sood and Watanabe [4] mentioned (i) an R3(n = 2) series starting
at 7.672 eV (61874 cm-1) with a vibrational progression extending up to about 8.156 eV (65785 cm-1) and (ii) a
W state starting at 7.817 eV (63050 cm-1) with a complex vibrational structure extending up to 8.228 eV
using five features observed between 8.006 eV and 8.207 eV effective quantum numbers ranging from 1.926 to 1.905 are calculated. This could suggest that these transitions already have Rydberg character. The effective quantum number of the sharply-shaped features starting at 8.333 eV oscillates between 2.018 and 1.993 (see Tables 3 and 6).
Fig. 4. Term scheme and predicted term values of valence to virtual valence transitions in C2H3Cl between 6.3
eV and 12.0 eV photon energy.
Table 6 Energies (eV), effective quantum numbers (n*), assignments (0 means vibrationless level) and wavenumbers (ωiRydb in cm-1) of vibrational progressions observed in Rydberg series converging to the AF2A'
vibronic state of C2H3Cl +
Transit. Energy n* Limit a Assign. ω
iRydb p||→ 3s 8.333 2.018 11.672 0 ω6Rydb = 800 ± 10 8.369 2.011 11.733 v8 ω8Rydb = 363 ± 70 8.432 2.005 11.814 v6 8.486 2.003 11.877 v6 + v8 8.531 1.993 11.955 2v6 p|| → 4s 10.065 2.908 11.672 0 ω6Rydb = 967 ± 40 10.117 2.901 11.733 v8 ω8Rydb = 315±25 10.180 2.886 11.814 v6 10.216 2.862 11.877 v6 + v8 10.305 2.871 11.955 2v6 p|| → 5s 10.731 3.798 11.672 0 ω6Rydb = 1000 ± 10 10.798 3.815 11.733 v8 ω8Rydb = 480 ± 50 10.857 3.770 11.814 v6 10.911 3.753 11.877 v6 + v8 10.980 3.735 11.955 2 v6 p|| → 6s 11.076 4.771 11.672 0 ω6Rydb = 940 11.115 4.692 11.733 v8 ω8Rydb = 310 11.193 4.681 11.814 v6 p|| → 3p 9.361 2.426 11.672 0 ω6Rydb = 1020 ± 100 9.406 2.418 11.733 v8 ω8Rydb = 400 ± 40 9.499 2.424 11.814 v6 9.553 2.409 11.877 v6 + v8
9.613 2.410 11.955 2v6 p|| → 4p 10.549 3.480 11.672 0 ω6Rydb = 1000 ± 100 10.602 3.469 11.733 v8 ω8Rydb = 520 ± 90 10.686 3.473 11.814 v6 10.761 3.492 11.877 v6 + v8 10.798 3.429 11.955 2v6 p|| → 5p 11.001 4.504 11.672 0 ω6Rydb = 1113 11.070 4.530 11.733 v8 ω8Rydb = 540 ± 20 11.139 4.489 11.814 v6 11.205 4.500 11.877 v6+ v8 p|| → 6p 11.223 5.507 11.672 0 ω8Rydb = 450 11.280 5.480 11.733 v8 p|| → 3d 10.278 3.124 11.672 0 ω6Rydb = 950 ± 100 10.339 3.124 11.733 v8 ω8Rydb = 480 ± 20 10.423 3.127 11.814 v6 10.480 3.120 11.877 v6+ v8 10.510 3.068 11.955 2v6 p|| → 4d 10.878 4.140 11.672 0 ω6Rydb = 1137 ± 50 10.941 4.146 11.733 v8 ω8Rydb = 530 ± 20 11.025 4.152 11.814 v6 11.094 4.168 11.877 v6+ v8 (11.160) (4.137) (11.955) 2v6 p|| → 5d 11.160 5.155 11.672 0 ω6Rydb= 1090 11.223 5.165 11.733 v8 ω8Rydb = 510 11.295 5.120 11.814 v6 p|| → 6d 11.310 6.122 11.672 0 ω8Rydb = 480 11.370 6.122 11.733 v8
a Ionization energies obtained in this work [1].
As mentioned earlier in this section, the present data can be compared with electron energy loss spectroscopic results published by Sze et al. [6]. Table 4(b) displays energy levels and assignments obtained by electron spectroscopy and the comparison with the present results. Despite a few differences of assignment, the energy levels in the two investigations correlate fairly well. On the other hand, Sze et al. [6] determined ionization energies by He(I) photoelectron spectroscopy. For the first two ionic states, energies of 10.16 eV and 11.64 eV were determined. They have to be compared with 10.01(3) eV and 11.67(2) eV obtained in this work. This discrepancy, particularly on the first ionization energy, can induce differences in assignments.
Tables 5 and 6 show detailed information on several Rydberg transitions exhibiting vibrational progressions and converging to the first and second ionization continuum respectively. The vibrational fine structure in the ionic state is determined by He(I) and threshold photoelectron spectroscopy (see the companion paper [1]). From both tables the assignment is made by gathering the features characterized by the same effective quantum number. This parameter is fairly constant for all observed vibrational progressions in the same Rydberg state.
Most of the Rydberg states listed in Table 5 show the excitation of three normal vibrational modes characterized by wavenumbers of 1 340 ± 90 cm-1, 780 ± 80 cm-1 and 350 ± 70 cm-1 respectively as averaged
over all the observed wavenumbers listed in the same table. These wavenumbers should be close to those of the C2H3Cl+(X~ 2A") ionic state. A normal mode analysis performed on this ionic state at the MNDO level [7] allows
us to suggest the following assignment for the observed wavenumbers. The highest wavenumber of 1 340 ± 90 cm-1 corresponds to the v
4 normal mode consisting in a C=C stretching with a CH2 scissoring contribution. The
v8 mode (CH2 rocking, C-Cl stretching) corresponds to the 780 ± 80 cm-1 wavenumber, whereas the 350 ± 70 cm -1 can be assigned to the v
9 mode consisting in an in plane rocking of the CH2 group. At the MNDO level, the
excitation of these normal modes can be rationalized by analysing the geometry variations resulting from ionization to the X~2A" state: a lengthening of the C=C bond (from 1.33 Å to 1.43 Å)) and a shortening of the
C-Cl bond (from 1.75 Å to 1.69 Å). Based on the Franck-Condon principle, the normal modes involving both C=C and C-Cl stretching have to be excited. The observation of a lowering of the C=C stretching wavenumber with respect to the neutral molecule has to be related to the lengthening (or weakening) of this bond, whereas to the increase of the C-Cl stretching vibration wavenumber corresponds to a strengthening (or shortening) of this bond. Indeed, in the neutral molecule these quantities, corresponding to the same normal vibrational modes, are 1608 cm-1, 720 cm-1 and 395 cm-1 [8]. Sood and Watanabe [4] reported wavenumbers of about 1300 cm-1 and 410
cm-1 in very good agreement with the present observations. The ω
8 = 780 ± 80 cm-1 was not mentioned by these
authors.
Similarly, in Table 6, Rydberg series were classified showing the excitation of two vibrational normal modes tentatively assigned to v6 (H-C-Cl scissoring) and v8 (CH2 rocking, C-Cl stretching). As averaged over all
the observed Rydberg series, except the 3s, the corresponding wavenumbers are ω6 = 1020 ± 70 cm-1 and ω8 =
450 ± 80 cm-1. In the neutral molecule the wavenumbers corresponding to these normal vibrational modes are
1279 cm-1 and 720 cm-1 respectively [8]. No comparison could be made with previous results, Sood and
Watanabe [4] mentioning "to be unable to make a satisfactory interpretation".
Table 7 Energy levels (eV) of Rydberg series converging to the C2H3Cl + (A2 Ã") state. Comparison between
photoionization mass spectrometric results [9] and the present photoabsorption spectroscopic work.
Photoionization Photoabsorption p|| → ns p|| → np p|| → nd p|| → ns p|| → np p|| → nd - 8.333 10.28 - - 10.065 9.361 10.278 10.86 10.54 10.72 10.731 10.549 10.878 11.15 10.98 11.05 11.076 11.001 11.160 11.29 11.20 11.25 11.259 11.223 11.310 11.35 11.36 11.370 11.346 11.43 11.445
Reinke et al. [9] measured the photoionization efficiency curve of C2H3Cl+ and mentioned the presence
of autoionization fine structure in the 10.3-11.6 eV photon energy range. They were able to classify and assign these features to ns-, np- and nd-type Rydberg series. These are shown in Table 7 and compared to the present results. The energy levels are in very good agreement with the present observations. Concerning the ns and nd assignment these authors suggest the reversed interpretation compared to ours. It must be emphasized at this point that this assignment is not unambiguous as the (n + l)s and nd Rydberg states are close in energy and can therefore interact. This will lead to a mixing of (n + l)s and nd characters. However, the extent of this mixing is impossible to estimate based only on experimental information at moderate resolution.
5. Conclusion
The investigation of the photoabsorption spectrum of C2H3Cl with the help of synchrotron radiation
allowed us to extend the analysis and assignments to higher energies, i.e. to the second ionization limit. Rydberg series up to high principal quantum numbers are identified. For the first members, the vibrational structure is disentangled. This data analysis appears to be most important to examine the TPES-and CIS spectra.
Acknowledgements
We are indebted to the University of Liège, the FRFC (Fonds de la Recherche Fondamentale Collective), the Freie Universität Berlin and the Bun-desministerium für Forschung und Technologie for financial support. RL and BL acknowledge the European Community for financing this work through its Human Capital and Mobility Programme (Contract no. CHGE-CT93-0027). We thank the BESSY technical Staff, and particularly Dr. G. Reichardt, for the outstanding quality of the maintenance of the equipment.
References
[1] R. Locht, B. Leyh, K. Hottmann, H. Baumgartel, Chem. Phys. 220 (1997) 217.
[2] T. Baer, P.M. Guyon, High Resolution Laser Photoionization and Photoelectron Studies, I. Powis, T. Baer, C.Y. Ng (Eds.), Wiley, 1995, p. 1.
[3] C.Y. Ng, Vacuum Ultraviolet Photoionization and Photodisso-ciation of Molecules and Clusters. C.Y. Ng (Ed.), World Scientific, Singapore, 1991, p. 169.
[4] S.P. Sood, K. Watanabe, J. Chem. Phys. 45 (1966) 2913.
[6] K.H. Sze, C.E. Brion, A. Katrib, B. El-Issa, Chem. Phys. 137 (1989) 369.
[7] Dewar Research Group: the AMPAC package (containing the MNDO/3, MNDO and AM1 methods), Chemistry Department, University of Texas, Austin, TX 78712. The package was converted for an IBM3090 computer by R. Farren and E.R. Davidson, Department of Chemistry, Indiana University, Bloomington, IN 47405, and is distributed by the Quantum Chemistry Program Exchange under reference number 539.
[8] G. Herzberg, Molecular Spectra and Molecular Structure. ΠI. Electronic Spectra and Electronic Structure of Polyatomic Molecules, Van Nostrand, Princeton, NJ, 1967.