arXiv:astro-ph/0312089v1 3 Dec 2003
The polarization evolution of the optical
afterglow of GRB 030329
Jochen Greiner∗, Sylvio Klose†, Klaus Reinsch‡, Hans Martin Schmidℓ, Re’em Sari$,
Dieter H. Hartmann¶, Chryssa Kouveliotou§, Arne Rau∗, Eliana Palazzi♦, Christian Straubmeier∗∗, Bringfried Stecklum†, Sergej Zharikov††, Gaghik Tovmassian††, Otto
B¨arnbantner♯, Christoph Ries♯, Emmanuel Jehin¶¶, Arne Henden§§, Anlaug A. Kaas‡‡,
Tommy Grav$$, Jens Hjorthℓℓ, Holger Pedersenℓℓ, Ralph A.M.J. Wijers#, A. Kaufer¶¶, Hye-Sook Park♦♦, Grant Williams♯♯, Olaf Reimer##
∗Max-Planck-Institut f¨ur extraterrestrische Physik, 85741 Garching, Germany †Th¨uringer Landessternwarte, 07778 Tautenburg, Germany
‡Universit¨ats-Sternwarte G¨ottingen, 37083 G¨ottingen, Germany ℓInstitut f¨ur Astronomie, ETH Z¨urich, 8092 Z¨urich, Switzerland
$California Institute of Technology, Theoretical Astrophysics 130-33, Pasadena, CA
91125, USA
¶Clemson University, Department of Physics and Astronomy, Clemson, SC 29634, USA §NSSTC, SD-50, 320 Sparkman Drive, Huntsville, AL 35805, USA
♦Istituto di Astrofisica Spaziale e Fisica Cosmica, CNR, Sezione di Bologna, 40129
Bologna, Italy
∗∗ I. Physikalisches Institut, Universit¨at K¨oln, 50937 K¨oln, Germany ††Instituto de Astronomia, UNAM, 22860 Ensenada, Mexico
♯Wendelstein-Observatorium, Universit¨atssternwarte, 81679 M¨unchen, Germany ¶¶European Southern Observatory, Alonso de Cordova 3107, Vitacura, Casilla 19001,
Santiago 19, Chile
§§Universities Space Research Association, U.S. Naval Observatory, P.O. Box 1149,
Flagstaff, AZ 86002, USA
‡‡Nordic Optical Telescope, 38700 Santa Cruz de La Palma, Spain
$$University of Oslo, Institute for Theoretical Astrophysics, 0315 Oslo, Norway, and
Harvard-Smithsonian Center for Astrophysics, Cambridge, MA 02138, USA
ℓℓAstronomical Observatory, NBIfAFG, University of Copenhagen, 2100 Copenhagen,
Denmark
#Astronomical Institute Anton Pannekoek, Kruislaan 403, 1098 SJ Amsterdam, The
Netherlands
♦♦Lawrence Livermore National Laboratory, University of California, P.O. Box 808,
Livermore, CA 94551, USA
♯♯MMT Observatory, University of Arizona, Tucson, AZ 85721, USA
##Theoretische Weltraum-und Astrophysik, Ruhr-Universit¨at Bochum, 44780 Bochum,
Abstract: We report 31 polarimetric observations of the afterglow of GRB 030329 with high signal-to-noise and high sampling frequency. The data imply that the af-terglow magnetic field has small coherence length and is mostly random, probably generated by turbulence.
1
Introduction
The association of a supernova with GRB 0303291,2 strongly supports the collapsar model3 of γ-ray bursts (GRBs), where a relativistic jet4 forms after the progenitor
star collapses. Such jets cannot be spatially resolved because of their cosmological dis-tances. Their existence is conjectured based on breaks in GRB afterglow light curves and the theoretical desire to reduce the GRB energy requirements. Temporal evolution of polarization5,6,7 may provide independent evidence for the jet structure of the rela-tivistic outflow. Previous single measurements found low-level (1-3 %) polarization8−15 in optical afterglows, and the only reports on variable polarization16,17 were based on few measurements with different instruments and modest signal-to-noise. Here, we re-port polarimetric observations of the afterglow of GRB 030329 with high signal-to-noise and high sampling frequency18.
2
Observations and Results
GRB 030329 triggered the High Energy Transient Explorer, HETE-2, on March 29, 2003 (11:37:14.67 UT)19. The discovery of the burst optical afterglow20,21 was quickly
followed by a redshift measurement22 for the burster of z=0.1685 (∼800 Mpc). We have obtained 31 polarimetric observations of the afterglow of GRB 030329 with the same instrumentation (plus few more with different instruments)18over a time period of 38 days. We performed relative photometry, and derived from each pair of simultaneous measurements at orthogonal angles the Stokes parameters U and Q. In order to obtain the intrinsic polarization of the GRB afterglow, we had to correct for Galactic interstel-lar pointerstel-larization (mostly due to dust). We performed imaging pointerstel-larimetry to derive the polarization parameters of seven stars in the field of GRB 030329, and obtained an inter-stellar (dust) polarization correction of 0.45% at position angle 155◦. Subtraction of the mean foreground polarization was performed in the Q/U plane (Qf p=0.0027±0.0013,
Uf p=-0.0033±0.0017).
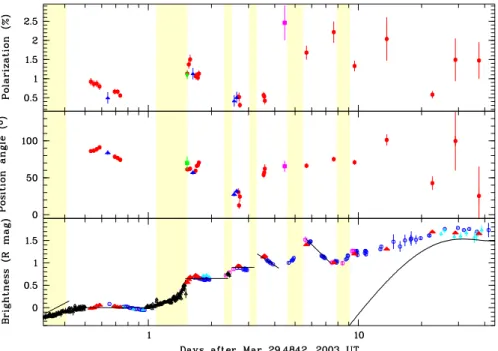
The temporal evolution of the degree and angle of polarization together with the R band photometry is shown in Figure 1, demonstrating the presence of non-zero polarization, Π ∼ 0.3 − 2.5% throughout a 38-day period, with significant variability in degree and angle on time scales down to hours. Further, the spectropolarimetric data of the first three nights as well as the simultaneous R and K band imaging polarimetry during the second night show that the relative polarization and the position angle are wavelength independent (within the measurement errors of about 0.1 %) over the entire spectral range. These data imply that polarization due to dust in the host galaxy of GRB 030329 does not exceed ∼0.3%.
Figure 1 shows that while the polarization properties show substantial variability (for which no simple empirical relationship is apparent), the R band flux is a sequence of power laws. During each of the power law decay phases the polarization is of order few percent, different from phase to phase, and variable within the phase, but not in tandem with the “bumps and wiggles” in the light curve. We observe a decreasing polarization degree shortly after the light curve break at ∼0.4 days (as determined from optical21,23 and X-ray data24,25). Rapid variations of polarization occur ∼1.5 days after the burst, and could be related to the end of the transition period towards a new power law phase starting at ∼1.7 days. Polarization eventually rises to a level of ∼2 %, which remains roughly constant for another two weeks.
Due to relativistic beaming, most of the observed photons arrive from a narrow cone, of opening angle θ=1/Γ around the line of sight. If the magnetic field parallel to the shock front is stronger than the perpendicular component, a resolved afterglow would look like a ring with polarization pointing towards its center5. Early on, however, the Lorentz factor is much larger than the inverse opening angle of the jet (1/Γ), and we therefore probe scales that are much narrower than the size of the jet. The jet is uniform over these scales, so the emission pattern (afterglow) has axial symmetry around the line of sight. This symmetry, for an unresolved source, leads to zero polarization. As the ejecta interact with the surrounding medium and decelerate, their Lorentz factor becomes comparable to 1/Γ, so we see most of the emitted photons. As the jet expands laterally, the energy per unit solid angle decreases; the light curve power law decay changes to a steeper slope, marking the so-called ”jet break” and, at the same time, axial symmetry is broken (if the jet is not exactly pointed towards us), resulting in non-zero polarization. Since the jet spreads but the offset of the line of sight from the centre of the jet remains constant, axial symmetry is regained and polarization will eventually vanish. Maximal polarization should therefore occur around the jet break time. Some models5,6,7suggest the presence of either one or three peaks of polarization,
with the most significant peak close to the time of the jet break. If three peaks are present, the position angle of the central peak is rotated by 90◦ relative to the other
two, but remains constant within each peak.
How do our data reflect these properties? A break (change of the power law decay in the light curve) was found at 0.4 days in early optical data21,23 and confirmed with X-ray data24,25. We thus expect maximum polarization near 0.4 days, and a
decline thereafter. Our early polarization data (Figure 1) are consistent with this prediction. Though we are missing data before 0.4 days to confirm a peak, the degree of polarization decreases from 0.9% at 0.55 days to about 0.5% at 0.8 days. During this decline the position angle decreases slightly, while the model predicts constancy. The time evolution of the polarization properties during this early phase is thus broadly consistent with the interpretation of the steepening of the light curve at 0.4 days as the jet break, providing independent observational evidence for the crucial assumption of collimated outflows (jets) in GRB explosions.
GRB 030329 is so far the only case where the polarization evolution supports the break as being due to the jet nature. From the jet break time and the isotropic equiv-alent energy of 9x1051 erg we calculate the jet opening angle26 to be about 3.◦5, and
Figure 1: Evolution of the polarization during the first 38 days. Top and middle panels show the polarization degree in percent and the position angle in degrees. Spectropo-larimetry was performed during the first three nights. The bottom panel shows the residual R band light curve after subtraction of the contribution of a power law t−1.64
describing the undisturbed decay during the time interval 0.5-1.2 days after the GRB (i.e., after the early break at 0.4 days), thus leading to a horizontal curve. The sym-bols correspond to data obtained from either the literature (black), or own observations (gray): the 1m USNO telescope at Flagstaff (circles), the OAN Mexico (open triangles), and FORS1/VLT (filled triangles). Lines indicate phases of power law decay, with the first one from early data21 (not shown). Vertical gray bars mark re-brightening transi-tions. Contributions from an underlying supernova (solid curved line) do not become significant until ∼10 days after the GRB.
the actual total energy release during the burst 2x1049 erg. This energy is about 25 times smaller than the ”standard energy” of GRBs27and one order of magnitude larger
than the one inferred (assuming isotropic emission) for GRB 980425 (associated with SN 1998bw).
We do not expect the model to apply to the observations after the first re-brightening episode, which started ∼1.5 days after the trigger. Indeed the polarization angle changed by 30◦ with respect to the first night, while the model predicts either no change or a 90◦ change. What can we still learn from the complex late time behavior?
Between 3 and 10 days the magnitude of the polarization changes significantly (a factor of two or more), but the position angle remains fairly constant (fluctuations of less than 10 degrees). This implies that the polarization is not the result of a small number of coherent magnetic field cells with random orientation; such a model would predict that the position angle changes on the same timescale as the magnitude of polarization. Instead, it implies that the position angle is associated with some global geometry.
A change of the position angle by an amount different than ninety degrees, as ob-served between the first and second day as well as between the second and third day, suggests that the asymmetry of the emission changed direction. Independent of polar-ization, the steeper decay of the optical light curve after day 10 (once the supernova component is subtracted), as well as a clear break observed at radio frequencies, sug-gests that the outflow may consist of two components28: the first one dominates the light curve and the polarization properties until day 1.5, and has its jet break at day 0.4, and the second one, more mildly relativistic (Lorentz factor of about six), causes the re-brightening at 1.5 days and dominates the light curve and polarization prop-erties thereafter. In this interpretation, the polarization data suggest that these two components do not share the same symmetry axis, which allows for the 30◦ change in the position angle. Due to its larger angle but similar energy per unit solid angle, the energy content in the second component is comparable to the canonical value of 5x1050
ergs. Even more than two jet components have been proposed29to explain the various wiggles in the lightcurve. If that picture is correct, the polarization data require that the jet axes not be aligned.
Finally, after day ∼10, there is a hint of some decrease in the polarization degree. At this time, the supernova contributes approximately 60% of the total light in the R band. Radiation transport models of non-symmetric supernovae30,31 suggest a ∼1%
degree of polarization. For SN 2003dh we expect an even lower level of polarization since we are oriented towards the SN rotation axis. Thus, it is plausible that the low polarization supernova light dilutes the more highly polarized afterglow.
In summary, our data constitute the most complete and dense sampling of the polar-ization behaviour of a GRB afterglow to date. The GRB 030329 afterglow polarpolar-ization probably did not rise above ∼2.5%, and did not correlate with the flux. The low level of polarization implies that the components of the magnetic field parallel and perpendicu-lar to the shock do not differ by more than ∼10 %, and suggests an entangled magnetic field, probably amplified by turbulence behind shocks, rather than a pre-existing field. Acknowledgements: This work is primarily based on observations collected at ESO,
Chile, with additional data obtained at the German-Spanish Astronomical Centre Calar Alto, operated by the Max-Planck-Institute for Astronomy, Heidelberg, jointly with the Spanish National Commission for Astronomy, the NOT on La Palma, Canary Islands, and the Observatorio Astronomico National, San Pedro, Mexico. We are grateful to the staff at the Paranal, Calar Alto and NOT observatories, in particular A. Aguirre, M. Alises, S. Hubrig, A.O. Jaunsen, C. Ledoux, S. Pedraz, T. Szeifert, L. Vanzi and P. Vreeswijk for obtaining the service mode data reported here.
References
[1] Stanek, K.Z., et al. 2003, ApJ 591, L17 [2] Hjorth, J., et al. 2003, Nature 423, 847
[3] Woosley, S.E., Eastman, R.G., Schmidt, B.P. 1999, ApJ 516, 788 [4] Meszaros, P. 2002, ARAA 40, 137
[5] Sari, R. 1999, ApJ 524, L43 [6] Gruzinov, A. 1999, ApJ 525, L29
[7] Ghisellini, G., Lazzati, D. 1999, MN 309, L7 [8] Hjorth, J., et al. 1999, Science 283, 2073 [9] Wijers, R.A.M.J., et al. 1999, ApJ 523, L33 [10] Covino, S., et al. 1999, A&A 348, L1 [11] Rol, E., et al. 2000, ApJ 544, 707
[12] Bj¨ornsson, G., Hjorth, J., Pedersen, K., Fynbo, J.U. 2002, ApJ 579, L59 [13] Masetti, N., et al. 2003, A&A 404, 465
[14] Covino, S., et al. 2003, A&A 400, L9 [15] Bersier, D., et al. 2003, ApJ 583, L63 [16] Barth, A., et al. 2003, ApJ 584, L47 [17] Rol, E., et al. 2003, A&A 405, L23 [18] Greiner, J., et al 2003, Nature 426, 157
[19] Vanderspek, R., Crew, G., Doty, J., Villasenor, J., Monelly, G. 2003, GCN Circ. 1997
[21] Uemura, M., et al. 2003, Nature 423, 843 [22] Greiner, J., et al. 2003, Circ. 2020
[23] Burenin, R., et al. 2003, Astron. Lett. 29, 9, 1
[24] Marshall, F.E., Markwardt, C., Swank, J.H. 2003, GCN Circ. 2052 [25] Tiengo, A., et al. 2003, A&A 409, 983
[26] Sari, R., Piran, T., Halpern, J. 1999, ApJ 519, L17 [27] Frail, D.A., et al. 2001, ApJ 562, L55
[28] Berger, E. et al., 2003, Nature 426, 154
[29] Granot, J., Nakar, E., Piran, T., 2003, astro-ph/0304563
[30] Wang, L., Howell, D. A., H¨oflich, P., Wheeler, J. C. 2001, ApJ 550, 1030
[31] Leonard, D. C., Filippenko, A. V., Chornock, R., Foley, R. J. 2002, PASP 114, 1333