ICAR 2006
Potential Estimation of Fatty Acid Content in Cow Milk by Mid-Infrared
Spectrometry
H. Soyeurt1,6, P. Dardenne2, G. Lognay3, C. Bertozzi4, P. Mayeres1,4 and N. Gengler1,5
1Gembloux Agricultural University, Animal Science, B-5030 Gembloux, Belgium
2Walloon Agricultural Research Center, Quality Department, B-5030 Gembloux, Belgium 3Gembloux Agricultural University, Analytical Chemistry Unit, B-5030 Gembloux, Belgium 4Walloon Breeders Association, B-5530 Ciney, Belgium
5National Fund for Scientific Research, B-1000 Brussels, Belgium 6F.R.I.A., B-1000 Brussels, Belgium
soyeurt.h@fsagx.ac.be
Abstract
The measurement of fatty acids by gas liquid chromatography is efficient but it involves a time-consuming procedure, expensive reagents and qualified staff. By comparison, the Mid-Infrared (MIR) Spectrometry appears to be a good alternative for assessing the fatty acids profile of dairy products. The aim of this research was to explore the calibration of MIR Spectrometry for estimating fatty acid concentrations in milk and milk fat. The estimated concentrations in milk fat were less reliable than those for the same fatty acids in milk. This study also showed that if the concentration of fatty acid in milk increased, the efficiency of this infrared analysis method to predict also increased. The selected prediction equations need to have a high cross-validation coefficient of determination (R²CV), a high ratio of standard error of cross-validation to the standard
deviation (RPD) and good repeatability of chromatographic data. Our results showed that at least the calibration equations which predict C12:0, C14:0, C16:0, C16:1 9-cis, C18:1 and saturated and monounsaturated fatty acids in milk could be used. Thus, with its potential use in regular milk recording, this infrared analysis method offers the possibility for improving the quality of the milk produced on farms.
Keywords: fatty acid, cow milk, mid-infrared, milk fat.
Introduction
Currently interest in fatty acids in dairy products is increasing. However, the control of this differentiated quality is not frequent because the determination of the fatty acid contents requires gas liquid chromatography. Even if this method is efficient, it involves a time consuming procedure, expensive reagents and qualified staff. MIR Spectrometry is an alternative to gas chromatography, with such advantages as a very high throughput (up to 500 samples / hour), ease of use and availability.
MIR from 1,000 to 5,000 cm-1 is interesting because of its very high sensitivity to the chemical
environment, as the fundamental absorptions of molecular vibrations occur in this region (Belton, 1997). So, MIR Spectrometry could be used to estimate various traits quantitatively based on calibration equations.
Nowadays, only the concentrations of milk fat, proteins, urea and lactose are estimated by MIR for the milk recording. The purpose of our study was to develop the prediction equations necessary for measuring fatty acid content in milk and milk fat using MIR Spectrometry. Indeed, it enables the fatty acid composition in milk for each cow under milk recording could be estimated. These
estimations could be used as indicator traits to determine the genetic values of underlying fatty acid concentrations, and knowledge of these genetic values would open up opportunities for animal selection aimed at improving the nutritional quality of cow milk.
Material and Method
Between April and June 2005, 600 milk samples were taken on 275 cows from 6 breeds (Dual Purpose Belgian Blue, Holstein, Jersey, Montbeliarde, Normande, Red and White) in 7 reference herds chosen from different criteria (e.g. the percentage of milk fat, the type and number of breeds,...). Then milk sample, contented 50 % morning milk and 50 % of evening milk, was analysed by MIR Spectrometry (Foss MilkoScan FT6000) and the generated spectra files were recorded in a database. The scale of variation of the milk fat ranged between 2.97 and 7.73 g/dl milk. By principal component analysis based on spectral variability, 49 samples were chosen. The milk fat was extracted and analysed by gas chromatography. The milk fat was extracted according to ISO 14156:2001 (International Norm, 2001). The chromatographic method for estimating of fatty acids profile based on methodology derived from Collomb et al. (2000). From the chromatographic data and spectral data, a specific program for multivariate calibration (WINISI III,
http://www.winisi.com) elaborated the different predicted equation. The Partial Least Squares regression was used. Although various pre-treatments were studied, none was used on spectral data before the calibration. Finally, 41 prediction equations were elaborated to estimate the fatty acids composition in milk and milk fat.
Results and Discussion
The estimated statistical parameters for each calibration equation were shown in Table 1. The correlations (RC) for predicting fatty acid concentrations in milk were better than those for
predicting the same fatty acid concentrations in milk fat. This might be explained by a different dispersion of values obtained for concentrations of fatty acids in milk or milk fat. Indeed, two milk samples can have the same profile in fat but a different percentage of fat in milk. The profile values expressed in g / dl milk are more autocorrelated than those expressed in g / 100 g fat. The reference values used to establish the predicted equation for fat in milk came from the predicted values obtained using the Milkoscan FT6000. This explains the high result of the correlations of cross-validation (RCV) obtained for this calibration equation.
The standard error of calibration (SEC) underestimates the mean square error of the model because the residual variance is not taken into account. Therefore, the standard error of cross-validation (SECV) was preferred. In order to estimate the efficiency of the calibration, the RPD was calculated (Table 2). For potential use, high R²CV and high RPD parameters would be required.
Generally, if the value of R²CV was high, the value of RPD was also high (Table 1).
Our study also showed that there was a polynomial relationship between the concentrations of fatty acid in milk and the value of RPD (r² = 0.78) (Result not shown). Generally, therefore, if the concentration of fatty acid is high, the potential for predicting concentration using MIR Spectrometry analysis is also high (Table 1).
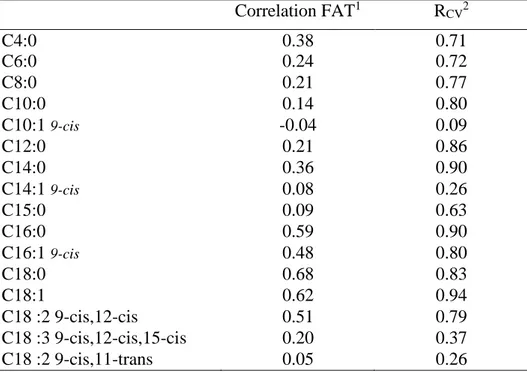
In order to verify whether the predicted concentrations of fatty acids obtained by the calibration equations were due to a real absorbances of these fatty acid or due only to the correlations between total fat content and fatty acids, the correlations between total fat and studied fatty acids were calculated (Table 2). If the calibration correlations (RCV) were not due to real absorbance’s specific
to fatty acids, these correlations would not be higher than the correlations between total fat and fatty acids. Thus, the predicted concentration for these fatty acids resulted more from a real infrared prediction than the correlation with the fat.
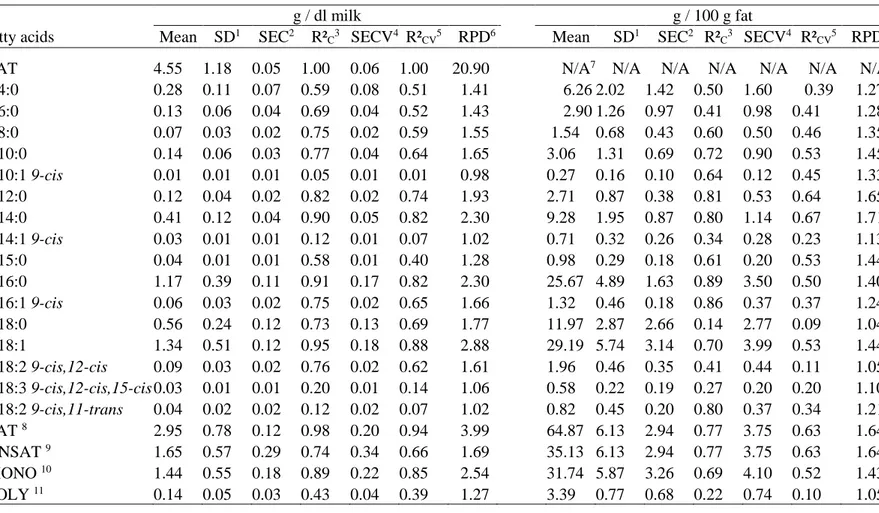
Table 1. Estimated statistical parameters for each calibration equation that estimated the concentrations of fatty acid in milk (g / dl milk) and in milk fat (g / 100 g fat).
g / dl milk g / 100 g fat
Fatty acids Mean SD1 SEC2 R²
C3 SECV4 R²CV5 RPD6 Mean SD1 SEC2 R²C3 SECV4 R²CV5 RPD6
FAT 4.55 1.18 0.05 1.00 0.06 1.00 20.90 N/A7 N/A N/A N/A N/A N/A N/A
C4:0 0.28 0.11 0.07 0.59 0.08 0.51 1.41 6.26 2.02 1.42 0.50 1.60 0.39 1.27 C6:0 0.13 0.06 0.04 0.69 0.04 0.52 1.43 2.90 1.26 0.97 0.41 0.98 0.41 1.28 C8:0 0.07 0.03 0.02 0.75 0.02 0.59 1.55 1.54 0.68 0.43 0.60 0.50 0.46 1.35 C10:0 0.14 0.06 0.03 0.77 0.04 0.64 1.65 3.06 1.31 0.69 0.72 0.90 0.53 1.45 C10:1 9-cis 0.01 0.01 0.01 0.05 0.01 0.01 0.98 0.27 0.16 0.10 0.64 0.12 0.45 1.33 C12:0 0.12 0.04 0.02 0.82 0.02 0.74 1.93 2.71 0.87 0.38 0.81 0.53 0.64 1.65 C14:0 0.41 0.12 0.04 0.90 0.05 0.82 2.30 9.28 1.95 0.87 0.80 1.14 0.67 1.71 C14:1 9-cis 0.03 0.01 0.01 0.12 0.01 0.07 1.02 0.71 0.32 0.26 0.34 0.28 0.23 1.13 C15:0 0.04 0.01 0.01 0.58 0.01 0.40 1.28 0.98 0.29 0.18 0.61 0.20 0.53 1.44 C16:0 1.17 0.39 0.11 0.91 0.17 0.82 2.30 25.67 4.89 1.63 0.89 3.50 0.50 1.40 C16:1 9-cis 0.06 0.03 0.02 0.75 0.02 0.65 1.66 1.32 0.46 0.18 0.86 0.37 0.37 1.24 C18:0 0.56 0.24 0.12 0.73 0.13 0.69 1.77 11.97 2.87 2.66 0.14 2.77 0.09 1.04 C18:1 1.34 0.51 0.12 0.95 0.18 0.88 2.88 29.19 5.74 3.14 0.70 3.99 0.53 1.44 C18:2 9-cis,12-cis 0.09 0.03 0.02 0.76 0.02 0.62 1.61 1.96 0.46 0.35 0.41 0.44 0.11 1.05 C18:3 9-cis,12-cis,15-cis 0.03 0.01 0.01 0.20 0.01 0.14 1.06 0.58 0.22 0.19 0.27 0.20 0.20 1.10 C18:2 9-cis,11-trans 0.04 0.02 0.02 0.12 0.02 0.07 1.02 0.82 0.45 0.20 0.80 0.37 0.34 1.21 SAT 8 2.95 0.78 0.12 0.98 0.20 0.94 3.99 64.87 6.13 2.94 0.77 3.75 0.63 1.64 UNSAT 9 1.65 0.57 0.29 0.74 0.34 0.66 1.69 35.13 6.13 2.94 0.77 3.75 0.63 1.64 MONO 10 1.44 0.55 0.18 0.89 0.22 0.85 2.54 31.74 5.87 3.26 0.69 4.10 0.52 1.43 POLY 11 0.14 0.05 0.03 0.43 0.04 0.39 1.27 3.39 0.77 0.68 0.22 0.74 0.10 1.05
1 SD = Standard deviation; 2 SEC = Standard error of calibration.; 3 R²
C = Calibration coefficient of determination.; 4 SECV = Standard error of cross-validation; 5 R²CV = Cross-validation
coefficient of determination; 6 RPD = Ratio of standard error of cross validation to standard deviation; 7 N/A = Data not available; 8 SAT = Saturated fatty acids; 9 UNSAT = Unsaturated
Table 3. Correlations between the percentage of milk fat and different concentrations of studied fatty acids in milk.
Correlation FAT1 RCV2 C4:0 0.38 0.71 C6:0 0.24 0.72 C8:0 0.21 0.77 C10:0 0.14 0.80 C10:1 9-cis -0.04 0.09 C12:0 0.21 0.86 C14:0 0.36 0.90 C14:1 9-cis 0.08 0.26 C15:0 0.09 0.63 C16:0 0.59 0.90 C16:1 9-cis 0.48 0.80 C18:0 0.68 0.83 C18:1 0.62 0.94 C18 :2 9-cis,12-cis 0.51 0.79 C18 :3 9-cis,12-cis,15-cis 0.20 0.37 C18 :2 9-cis,11-trans 0.05 0.26
1 Correlation FAT = Value for the correlation between the percentage of milk fat and different concentrations of fatty
acid ; 2 R
CV = Square root of the R²CV value.
Conclusions
The estimation of fatty acid concentrations in milk using MIR Spectrometry seems feasible. Our results showed that at least the calibration equations that predict C10:0, C12:0, C14:0, C16:0, C16:1
9-cis, C18:1, C18:2 9-cis,12-cis, SAT and MONO in milk could be used. Although some fatty acids
present in low concentrations in milk can not yet be predicted accurately (e.g., omega-3 and C14:1
9-cis), MIR Spectrometry can predict most fatty acids like C14:0, C16:0, C18:0, C18:1, SAT and
MONO). Most associated coefficients of determination are clearly lower than 1 but they are significantly different from zero. Therefore, because of the throughput and the availability of this instrument, and with the increased focus on ‘healthy’ dairy products, MIR Spectrometry is an interesting alternative for providing some indications of the fatty acid profiles in cow milk useful for the dairy sector. Another application could be to use these values in animal selection so as to improve the nutritional quality of milk. Indeed, with the use of MIR Spectrometry the composition of milk fat for each milk sample from an animal participating in the milk recording system could be estimated using the calibration equation established in this study. The estimates based on MIR could be used as indicator traits for real underlying fatty acid concentrations, potentially in a multi-trait setting using appropriate selection index theory. Knowledge of these genetic values would create opportunities for animal selection aimed at improving the nutritional quality of cow milk.
References
Belton, P.S., 1997. Spectroscopic approaches to the measurement of food quality. Pure & Appl. Chem. 69(1):47-50.
Collomb, M. and T. Bühler, 2000. Analyse de la composition en acides gras de la graisse de lait. Mitt. Lebensm. Hyg. 91:306-332.
International Norm, 2001. Lait et produits laitiers – M2thodes d’extraction des lipids et des composés liposolubles. ISO 14156 :2001. FIL 172:2001.