COMPENSATORY GROWTH IN DOUBLE MUSCLED BULLS
1 2 3
Different Periods of Feed Restriction Before Compensatory Growth in Belgian Blue Bulls:
4
I. Animal Performance, Nitrogen Balance, Meat Characteristics and Fat Composition1
5 6
J. L. Hornick2, C. Van Eenaeme, A. Clinquart, M. Diez, and L. Istasse
7 8 9 10
Department of Nutrition, Veterinary Faculty, Sart Tilman
11 B43 4000 Liège, Belgium 12 13 Phone: 32-(0)4-3664139 14 Fax: 32-(0)4-3664122 15 E-mail: HORNICK@.STAT.ULG.FMV.AC.BE. 16 17 18 19 20 21
1The IRSIA (Institut pour l'Encouragement de la Recherche dans l'Industrie et l'Agriculture,
Brussels, Belgium) is gratefully acknowledged for financial help.
ABSTRACT: Thirty double-muscled Belgian Blue bulls were maintained at a rate of gain of .5 kg/d
1
during four length of time, 4 (G2), 8 (G3) or 14 (G4) mo (low growth period, LGP), before fattening
2
(rapid growth period, RGP). Ten control animals (CG) were fed a high-energy, high-protein diet. The
3
G2, G3, and G4 were fed a low-energy, low-protein diet during LGP and the same diet as CG during
4
RGP. Live weight was recorded biweekly, feed consumption (FC) daily, and nitrogen balance at 3
5
occasions in each group. At the slaughterhouse, the 7, 8, and 9th ribs were removed to determine
6
carcass composition, meat quality, and meat and fat composition. Compensatory growth reached a
7
maximum 2 mo after refeeding. The G2 and G4 exhibited compensatory growth ( P < .05) and had
8
higher daily FC ( P < .001). Feed conversion ratio (FCR) increased sharply after refeeding. Nitrogen
9
balance was higher in compensating groups ( P < .05). Compensating animals had higher carcass
10
connective and adipose tissue contents ( P < .05) but lower meat fat content (P < .05). Cattle exhibiting
11
compensatory growth had higher redness, yellowness, hue, cooking losses and drip losses, but tended
12
to have lower Warner-Bratzler peak shear force (WBPSF) values. The saturated fatty acid (SFA)
13
content of the fat decreased with the length of the LGP. Compensatory growth in double-muscled bulls
14
at the expense of higher feed intake increased peripheral fat but decreased intramuscular fat deposition.
15 16
Key Words: Belgian Blue Bulls, Compensatory Growth, Animal Performance, Carcass, Meat, Fatty
17
Acids
Introduction
1 2
Compensatory growth is the ability of an animal to exhibit, after disease (Thomas et al., 1978) or
3
feed restriction (Wilson and Osborn, 1960), larger growth rates than in unaffected animals of the same
4
chronological age. In cattle, compensatory growth is well expressed when feed restriction occurs at a
5
relatively late stage of life (Berge, 1991; Berge et al., 1991). Factors contributing to compensation are
6
increases in feed intake (Baker et al., 1992), increases in gut-fill weight, or higher efficiency of feed
7
utilization (Carstens et al., 1991). The response varies according to the pattern of undernutrition and
8
realimentation, and stage of development of the animal (Wilson and Osborne, 1960). The Belgian Blue
9
breed, double-muscled type, is a large beef breed with early maturity, characterized by high average
10
daily gain, low feed conversion ratio, and high quality of carcass (Clinquart et al., 1991). Currently,
11
there is no published work on compensatory growth in Belgian Blue bulls. Therefore, an experiment
12
was conducted with Belgian Blue bulls in order to study the effects of a restricted growth, lasting for
13
three different durations, on fattening performances. Results are presented in 2 papers. This paper
14
summarizes animal performance, nitrogen balance, and carcass, meat, and fat characteristics.
15 16
Materials and Methods
17 18
Animals and Management
19
The Animal Care and Use Council of our institute approved the use and treatment of animals in
20
this study. A total of 40 Belgian Blue bulls, double-muscled type, initial age and weight range of 9.7
21
mo and 310 ± 38 kg, were divided into four groups of similar live weight. In each group, four animals
22
were randomly penned in individual stalls allowing for collection of urine and feces, and the remaining
six were housed in a stanchion barn with straw as bedding. Each group was randomly assigned to one
1
of the four treatments. The first group (control, CG) was given from the beginning ad libitum access to
2
a fattening diet allowing for rapid growth. The fattening diet was based on sugar beet pulp
3
complemented with cereals, protein from vegetable origin, and a mineral mixture (Table 1). During
4
three periods with different lengths of time, the other groups received a limited quantity of a
low-5
energy, low-protein diet calculated to support an ADG of .5 kg daily gain (LGP, low growth period).
6
The low growth diet was based on pelleted straw complemented with dried lucerne, cereals, protein
7
from vegetable origin, and mineral mixture. The three groups, namely groups 2, 3, and 4 (G2, G3, G4),
8
received the low-growth diet for 115, 239, and 411 d, respectively. Subsequently, G2, G3 and G4 were
9
adapted to the concentrate fattening diet over a 15-d period of transition. The amount of concentrate
10
feed was then progressively increased and animals were allowed to consume their ration on an ad
11
libitum basis for about 1 mo after the beginning of the transition period. The concentrate diet was
12
offered during the rapid growth period (RGP) which lasted until the animals were slaughtered. The
13
animals were fed twice daily at 0600 and 1400 and were slaughtered per group when mean live weight
14
reached at least 600 kg and when the average daily gain (ADG) was lower than 1 kg/d at two
15 consecutive measurements. 16 17 Measurements 18
Feed intake of the bulls was recorded each day and live weight at 15-d intervals. Feed samples
19
were withdrawn at regular intervals for chemical analysis. At the slaughterhouse, abdominal fat was
20
removed from the carcass. Carcass weight was recorded and pH of both Longissimus thoracis muscles
21
were measured (7, 8, 9 ribs) 1, 2, and 4 h postmortem using a Portamess 751 knick pH-meter (Knick
GmbH & Co, Berlin, Germany) with an Ingold "penetration" pH-electrode (Ingold AG, Urdorf,
1
Switzerland).
2
Two days after slaughter, the 7, 8, and 9th ribs were removed from the carcass. They were
3
dissected in order to separate lean meat, fat and connective tissue, and bones. Regressions of Martin
4
and Torreele (1962) for double muscled cattle were then used to assess the composition of the carcass.
5
Meat quality was determined from one 2.5-cm-thick cut of the longissimus thoracis muscle. Five
6
measurements of the final pH were performed on this cut at 48 h postmortem using the technique
7
described above. At the same time, the HunterLab Labscan II device was used for objectively
8
measuring CIE Lab brightness (L*), redness (a*) and yellowness (b*) on 5 spots 2.5 cm diameter. Hue
9
was estimated by a*/b* ratio. Seven days later, the cut was weighed in order to estimate drip loss, and
10
heated in open plastic bags in a waterbath for 50 min at 75°C. After heating, they were cooled in cold
11
tap water to room temperature, bags were drained, and cuts were mopped gently dry with paper tissue.
12
The difference between raw and heated weights was recorded as cooking loss and expressed as a
13
percentage of the raw weight. Warner-Bratzler shear force was determined with a Lloyd LR5K
14
perpendicular to the fiber direction on 10, 1.25-cm-diameter cores obtained from the heated cuts.
15
The dry matter, ash, ether extract, and crude protein concentrations of the diets were determined
16
according to official procedures (AOAC, 1975). The lipids from peripheral, intermuscular and
17
intramuscular fat samples were extracted and saponified as described by Ter Meulen et al. (1975). The
18
fatty acid composition of fat samples was determined by gas chromatography.
19 20
Statistical Analysis and Mathematical Modelling
21
Bulls were blocked (n = 10) by group (Figure 1). One-way analysis of variance, using group as a
22
factor of variation, was used to analyze data. Data relative to muscle, connective and adipose tissue,
and bone proportions in the carcasses were compared by analysis of covariance, using group as factor
1
of variation and slaughter weight as factor of covariance. Nitrogen balances either performed during
2
LGP, after the transition period or before slaughter were compared at similar live weight using
3
contemporary weight as factor of covariance. Two-way analysis of variance for a 3 x 4 design using
4
location of fat (subcutaneous, inter- or intramuscular) and group as factors of variation was used to
5
analyze data relative to fatty acid composition of fat (Dagnelie, 1975). Modelled evolution of the ADG
6
over time was presented, assuming a quadratic evolution during the LGP and a cubic evolution during
7
the RGP. The model was chosen from the maximum r² value within the expected evolution of the
8
ADG. The evolution of ADG during compensatory growth was also studied by GLM procedure of SAS
9
(SAS, 1990), using group and month after the beginning of the compensatory growth as factors of
10
variation. Predicted maxima and minima were obtained from the model of compensatory growth by
11
derivative of the function obtained from analysis.
Results
1 2
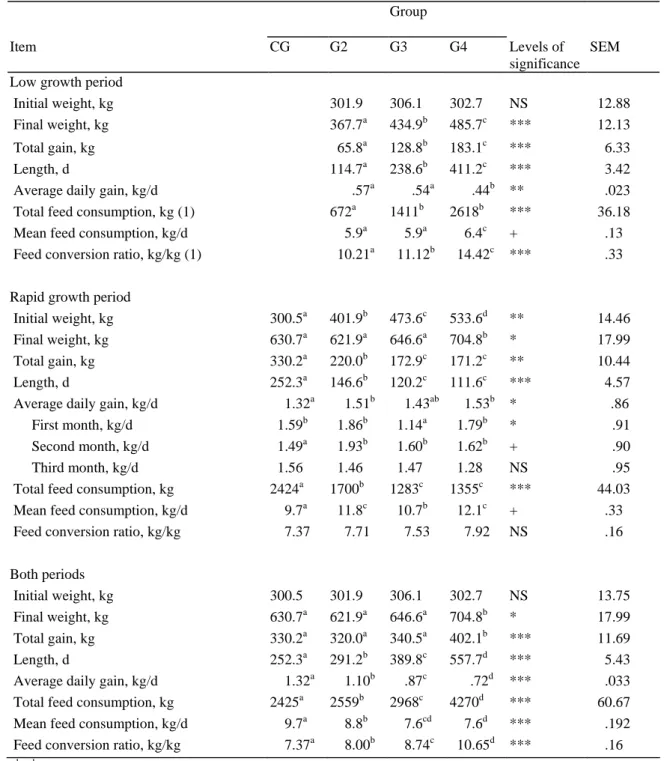
Table 2 summarizes the performance of the four groups during both periods.
3
Initial live weight was similar in the four groups (300 kg). The bulls from the CG gained 330 kg
4
during the fattening period, which lasted for 252 d. Feed conversion ratio (FCR) and ADG were 7.37
5
kg/kg and 1.3 kg/d, respectively. As expected, the live weight at the end of the low-growth period was
6
different in G2, G3, and G4, with values of 368, 435 and 486 kg, respectively ( P < .001). The ADG
7
was similar and close to .5 kg/d during LGP although it was slightly higher in G2 and lower in G4 ( P <
8
.05). Total feed consumption (FC) differed to a large extent because length of the LGP was different.
9
Daily feed intake was close to 6 kg/d in the three groups, although higher in G4 ( P < .1). The FCR was
10
high and increased with the length of the LGP (10.21, 11.12 and 14.42 kg/kg in G2, G3 and G4
11
respectively, P < .001). Live weight at the beginning of the RGP was 402, 474 and 534 in G2, G3 and
12
G4 ( P < .001) and the fattening period lasted for 147, 120 and 112 d respectively. During RGP, ADG
13
was higher in all three groups than in CG. G2 and G4, which exhibited the largest compensatory gains,
14
also had the largest daily FC (11.8 and 12.1 vs 9.7 and 10.7 kg/d in control and G3 ( P < .001).
15
However, on a live weight basis, FC was the highest in G2 ( P < .05). During RGP, FCR was quite
16
similar in the four groups and close to 7.5 kg/kg; it was, however, slightly higher in G2 and G4. When
17
both periods were considered, ADG decreased with increasing length of the LGP. Final live weight was
18
similar in CG, G2, and G3 (631, 622, and 645 kg) and was quite higher in G4 (705 kg). During the
19
whole experiment, total gain was higher in G4 (402.1 kg) than in CG, G2 and G3 (330.2, 320.0 or
20
340.5 kg, respectively, P < .001). Total feed consumption increased similarly as the total growth
21
duration but daily absolute and relative consumption showed opposite evolutions.
The change with time of live weight gain, modelled evolution of the ADG determined between
1
weight records, and FC are given in figure 2. The animals from G2 gained weight rapidly and reached
2
their slaughter weight almost at the same age as CG. In G3 and G4, cattle were slaughtered 4 and 9 mo
3
later, respectively, in winter and in summer because the length of LGP for cattle in G3 and G4 was
4
much greater. The change over time of ADG during RGP was best fitted by a cubic relationship in G2,
5
G3 and G4 (R² values respectively equal to 65, 81, and 81%). The maximum ADG after realimentation
6
was close to 2 kg/d in G2 and decreased rapidly. In G3, the amplitude of compensation was less than
7
G2 (1.5 kg/d) but the period during which animals exhibited ADG higher than 1 kg/d was longer than
8
in G2 (140 d). In G4, the maximum ADG reached values close to those in G2, but it was obtained
9
earlier. Animals from G4 were slaughtered before ADG decreased below 1 kg/d because most of them
10
had leg injuries at the end of RGP. The largest growth rate occurred approximately 2 mo after the
11
beginning of the transition period planned between LGP and fattening period. The best model of
12
compensatory growth throughout the 3 compensating groups was cubic, i.e., ADG = .54 + 1.087 x mo -
13
0.314 x mo² + 0.024092 x mo³ (R² = 0.47), where mo indicates the number of mo after the beginning of
14
the transition period ( P < .001 for the coefficients). Predicted maxima and minima of ADG, obtained
15
from the derivative function, were 1.67 and .94 kg/d, respectively at 2.38 and 6.31 mo after the
16
beginning of the transition period. Voluntary feed intake increased continuously during RGP and
17
reached values of about 11 kg/d when maximum ADG occurred.
18
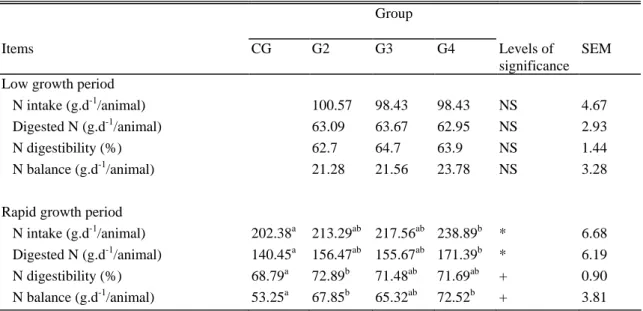
During LGP, N intake was limited to about 100 g N/d in G2, G3, and G4 (Table 3). During
19
compensatory growth, N intake increased to values higher than in CG ( P < .05), corresponding to
20
compensatory intake. During LGP, apparently digested N, as well as N digestibility, were close to 63 g
21
N.d-1/animal and 63% respectively. The corresponding values were higher at 140 g N.d-1/animal and
22
69% in CG. Values increased to 160 g N. d-1 /animal and 71% respectively, during compensatory
growth. In the CG, N retention was close to 50 g N/d. In the restricted groups, N balance was slightly
1
over 20 g N/d during the LGP, but it increased to values higher than in CG during RGP ( P < .1).
2
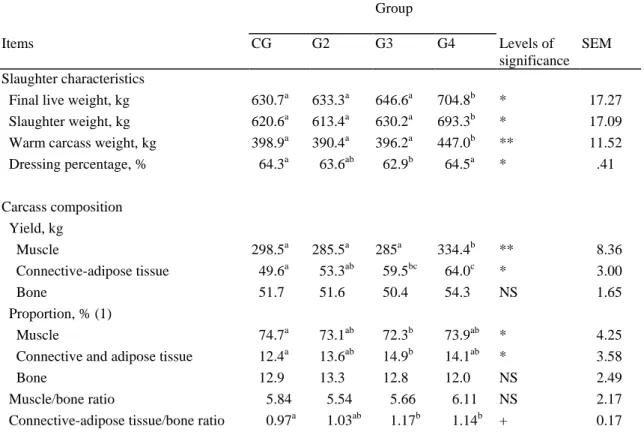
Table 4 summarizes the effects of treatment on slaughter characteristics and carcass composition.
3
As the final live weight of animals from G4 was greater than in the other groups, their live weight at
4
the slaughterhouse and carcass weight were higher (447 kg vs almost 400 kg in the other groups, P <
5
.01). Dressing percentage was similar for CG, G2 and G4 but G3 was characterized by lower values
6
than CG and G4 ( P < .05). Animals from G4 yielded more lean meat than the others owing to a higher
7
carcass weight ( P < .01 or < .001), but the CG had a higher muscle proportion, while the lowest value
8
was observed in G3 ( P < .05). The amount of connective and adipose tissue increased from CG to G4 (
9
P < .05) but percentages were, as opposed to muscle proportion, the highest in G3 and the lowest in
10
CG. Bone proportion was lower ( P < .1) in G4. The ratio between muscle to bone was similar among
11
treatment and close to 6. Higher ratio between connective-adipose tissue and bone was observed in G3
12
and G4 when compared to CG ( P < .05 or P < .1).
13
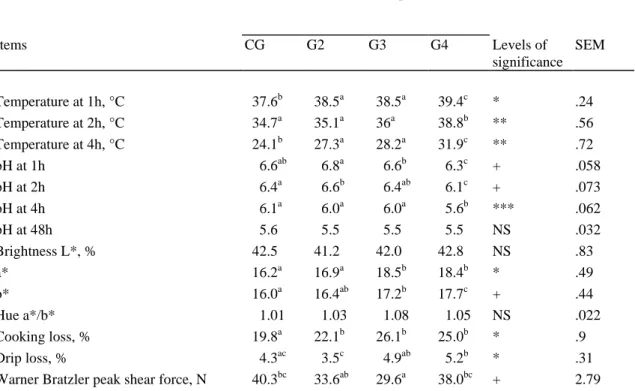
Meat quality characteristics are shown in table 5. Meat temperature decreased more rapidly in
14
CG and more slowly in G4; G2 and G3 had a similar pattern ( P < .001). By contrast, pH values in
15
meat from G4 were lower 1 h, 2 h, and 4 h postmortem than in the other groups ( P < .01 or .001).
16
However, the pH observed 48 h postmortem was similar and close to 5.5 in all group. There were no
17
differences in brightness measured 2 d postmortem. Both a* and b* values were higher in groups G2,
18
G3 and G4 than in CG but the differences were only in G3 and G4 ( P < .01, P < .1). Cooking losses
19
were lower in CG than in the others groups ( P < .001). Similarly, higher drip was observed in G3 and
20
G4 when compared to CG and G2 ( P < .1). The Warner-Bratzler peak shear force (WBPSF) was lower
21
in G2, G3 and G4 than in CG but only G3 showed a significant difference ( P < .1).
Chemical analysis of the meat (Table 6) revealed differences in ash, crude protein, ether extract,
1
and cholesterol content ( P < .001; P < .01; P < .05; P < .1). It was of interest to note that the ether
2
extract value was lower in the groups previously restricted whereas the opposite was found for the
3
connective and adipose tissue of the carcass. No difference in cholesterol content was found between
4
CG, G2 and G3. However, G4 showed a lower cholesterol content than others groups ( P < .01).
5
The fatty acid composition of the subcutaneous, intermuscular, and intramuscular fat is shown in
6
Table 7. The major fatty acids were C16:0, C18:0 and C18:1, present in proportions of 30, 20, and
7
35%, respectively. However, large differences appeared between the three types of fat; intermuscular
8
fat was richer in saturated fatty acids (SFA), with an equal proportion of C16:0 and C18:0, and
9
intramuscular fat contained larger proportions of polyunsaturated fatty acids (PUFA), mainly as C18:2
10
( P < .001). The subcutaneous fat was richer in monounsaturated fatty acids (MUFA). The percentage
11
of saturated fatty acids (SFA) decreased with increasing length of the LGP ( P < .01). This effect was
12
largely due to increases in MUFA contents and was observed in subcutaneous and intermuscular fat ( P
13
< .01, P < .05), but not in intramuscular fat, explaining that a factor of interaction was found between
14
groups and fat effect ( P < .05).
Discussion
1 2
In G2 and G3, the target live weight gain of .5 kg/d was difficult to achieve, mainly at the
3
beginning of LGP (Figure 2). It was therefore necessary to further reduce feed intake. As a
4
consequence of the experimental setup, the restrained animals had different ages and live weights at the
5
start of the compensatory growth period. Thus, confounding effects between length of the low-growth
6
period, animal age and live weight may have occurred. The significantly higher final live weight in G4
7
when compared to the other groups is explained by the heavy live weight at the beginning of the RGP,
8
associated with the length of the restriction period, and by a large ADG during the fattening period.
9
Complete compensatory growth expresses the ability of a restricted animal to reach a weight of a
10
control animal at similar age (Wilson and Osbourn, 1960; Ryan et al., 1993a). Such a growth was not
11
possible in G3 and G4 because animals in these groups started the fattening period after the CG
12
animals were slaughtered. In G2, compensation was partial, the slaughter occurring about 1 mo later
13
than in CG. The lack of complete compensation has been reported many times by others (Abdalla et al;,
14
1988; Ellenberger et al., 1989; Carstens et al., 1991; Drouillard et al., 1991; Hayden et al., 1993). Ryan
15
et al, (1993a) reported, however, a complete compensation with Hereford steers underfed during 3 mo
16
before realimentation.
17
Both higher daily FC and FCR observed during RGP of compensating groups suggested that
18
compensation was associated with increasing feed intake, without however achieving better efficiency
19
of feed utilization. When FC was expressed on a weight basis, G2 only showed increased intake over
20
CG, whereas in G3 and G4, higher intakes during fattening were the result of the higher live weight
21
than in CG; there was therefore a compensatory intake in G2. Lopez Saubidet and Verde (1976)
22
discarded compensatory feed intake as explanation for compensatory growth after long periods of
growth restriction. They postulated that compensatory growth was attributed to lower maintenance
1
requirements. There was no evidence to support such a hypothesis in the present work. Neither G2, G3,
2
nor G4 showed improved FCR as compared to CG during the RGP. Moreover, ADG related to live
3
weight did not differ between CG and G2 or G3, and was lower in G4. Our results have to be related to
4
the higher fat percentage in the carcass of compensatory groups animals. The efficiency of fat
5
deposition is lower than that of lean meat deposition because lean meat contains larger proportions of
6
water. The higher feed conversion ratio suggests that although high ADG were observed in
7
compensatory groups when compared to CG, nutrients were directed towards fat rather than meat
8
production. The higher N retention during compensatory growth as compared with the LGP may be
9
ascribed to higher N input but also to higher N quality. The increase of N retention during RGP when
10
compared to values in CG indicates that protein deposition was also increased. Carstens et al. (1991)
11
found, in Hereford X Angus steers, that compensatory growth was associated with higher protein
12
accretion in noncarcass protein. In the present experiment, we did not measure the protein content in
13
noncarcass weight. So, the possibility that a higher noncarcass protein deposition occurred in animals
14
that exhibited compensatory growth cannot be excluded.
15
The lower profile of compensation in G3 when compared with G2 and G4 may be explained by a
16
seasonal effect, because the G3 animals were fattened during autumn and winter, so energy used for
17
thermoneutral maintenance may have been increased (Scott et al., 1993). The rather similar profile in
18
the response of G2 and G4 animals during RGP may be surprising when considering age difference.
19
However, Drouillard et al. (1991) reported that the duration of a mild growth restriction was less
20
important for compensatory growth than the severity of nutrient restriction. The mechanism of growth
21
was perhaps different in the two groups.
The pattern of the daily gain with respect to time during RGP reached a maximum (cubic effect,
1
Figure 2) at a value close to 1.7 kg/d. During realimentation, feed intake increased. It was likely that
2
the previous restriction modified gut capacity so that changes in gut fill accounted partly for
3
compensatory growth, as reported by Carstens et al. (1991). Moreover, during compensation, net
4
energy requirements for growth decrease, as does energy for maintenance (Carstens et al., 1991). The
5
efficiency of energy deposition increases and repletion of proteins, especially in tissues such as liver or
6
digestive tract, allows for a rapid growth (Wright and Russel, 1991;Ryan et al., 1993b). However,
7
according to Carstens et al. (1987, 1989), this phenomenon would be brief, about 19 d to 1 mo.
8
Afterward, FCR increases, fat/protein deposition ratio enhances, and the ADG decreases. In the present
9
experiment the FCR in compensating groups was never lower than in CG, as opposed to observations
10
made by Ryan et al. (1993a) in Hereford steers. This might suggest that a beef breed with a very high
11
potential for lean meat deposition and a low FCR is not able to improve growth during compensation
12
without increasing feed intake.
13
At heavier weights, as found during the fattening period in G4, the capacity for fat deposition is
14
enhanced (Rompala et al., 1985; Simon, 1989). In this group, FCR increased rapidly without any
15
consistent decrease in ADG, suggesting increasing fat deposition. Fat proportion in carcasses of
16
animals from G4 was, however, similar to that found in G2 or G3; but it must be remembered that the
17
animals were slaughtered before ADG decreased to sufficiently low values. Higher fat deposition in the
18
regions surrounding the gastrointestinal tract could also not be excluded.
19
The lower dressing percentage found in G3 (table 4) and a trend for a lower value in G2
20
compared to CG are in agreement with results from Smith et al. (1977) and Carstens et al. (1991) and
21
suggest that the compensation occurs more in other compartments as carcass.
The ratio between muscle to bone is a good indicator of muscle development because it is
1
independant of the degree of fatness (Berg and Butterfield, 1966). Although this ratio was similar
2
among treatment when slaughter weight was used as factor of covariance, it was greater than values
3
reported in other breeds (Shahin and Berg, 1985; Arthur et al., 1989) confirming the exceptional
4
carcass quality of Belgian Blue bulls, double muscled type (Uytterhaegen et al., 1994). The
5
unfavourable effect of compensatory growth on leanness of the carcass has been reported by some
6
authors (Abdalla et al., 1988; Fumagalli, 1989) but not by others (Greenhalgh, 1986; Carstens et al.,
7
1991; Yambayamba and Price, 1991). In the present experiment, all compensatory growth groups
8
showed a trend for or a significantly higher percentage of connective and adipose tissue in the carcass
9
when compared to CG, suggesting an effect of the treatment or of the age of animals. Nevertheless, the
10
animals from G2 had live weight and age similar to those of animals in CG. It appears thus that in this
11
group the compensatory growth had negative effects on leanness of the carcass. The higher ratio
12
between connective and adipose tissue to bone in G2, G3 and G4 confirmed that compensatory groups
13
deposited proportionnaly more fat than CG.
14
In this respect, the lower proportion of fat in meat of the realimented groups was rather
15
surprising, because advancing age is known to increase the fat proportion in muscle (Szucs et al., 1987;
16
Grosse et al., 1991; Duckett et al., 1993). However, it could be hypothesized that during compensatory
17
growth a developing muscle induces the production of young and therefore leaner meat, either by
18
muscle fiber hypertrophy or by proliferation and incorporation of satellite cells in preexisting fibers
19
(Swatland, 1977). So, compensatory growth possibly increased the proportion of peripheral fat such as
20
subcutaneous or intermuscular fat but decreased the proportion of fat in muscle tissue. Similar results
21
have been reported by Garcia and Casal (1992) with compensatory growth in Angus steers treated with
22
zeranol implants. The lower fat content in meat from G2, G3 and G4 gave thus a meat more in
agreement with the recommandations of the Dietary Guidelines for Americans (1995). The lower meat
1
cholesterol content in G4 probably is related to the lowest ether extract found in this group.
2
Assuming that slaughterhouse temperature was quite similar in each group at slaughter, the
3
slower decrease of meat temperature after slaughter in G2, G3, and G4 with respect to CG may be
4
explained by the higher proportion of carcass fat preventing heat escape (Lochner et al., 1980). A
5
slower drop in temperature was associated with a quicker decrease of meat pH because higher meat
6
temperature stimulated enzymatic activity and accelerated the rate of pH decline in muscle (Bush et al.,
7
1967; Dutson, 1983). However, no changes in meat pH occurs 48 h postmortem. Higher a* and b*
8
values in groups that exhibited a compensatory growth may come from the higher meat temperature
9
early postmortem. Bruce and Ball (1990) observed increased redness and decreased blueness of steaks
10
maintained to higher curve of declining temperature when compared to low temperature treatment.
11
Higher values in color parameters may also be related to an age effect, because older animals always
12
have a larger amount of myoglobin in muscle (Barton-Gade et al., 1988). Average daily gain has been
13
reported as a possible factor of influence on meat color (Itoh et al., 1989), a* and b* tending to be
14
negatively and positively correlated, respectively. There were, however, no elements that indicated a
15
relationship between ADG and color parameters in this experiment. The higher cooking losses
16
observed in realimented groups and the increase in drip value observed with the length of the
17
restriction period are in agreement with the lower percentage of fat in the meat of these animals, a low
18
fat content in meat being associated with a high water content (Szucs et al., 1987; Grosse et al., 1991).
19
Alteration in water holding capacity could also be ascribed to changes in post-mortem meat
20
temperature or pH (Honikel et al., 1968). However, several experiments report the lack of relation
21
between these parameters (Bruce and Ball, 1990; Boakye, 1993). The lower shear force index found in
22
G2 and G3 may be explained by the production of a younger meat, therefore poorer in connective
tissue. The postmortem muscle temperature was also higher, enhancing meat tenderness by accelerating
1
the aging process (Yates et al., 1983; Lee, 1986). In G4, a more structured connective tissue related to
2
the older age of the animals might explain lower meat tenderness when compared to G2 and G3. The
3
numerically higher tenderness found in G2, G3 and G4 may also be explained by the higher growth rate
4
before slaughter in these groups. Possibly, these groups contained higher amounts of endogenous
5
proteolytic enzymes before slaughter, as suggested by Aberle et al. (1981) and Van eenaeme et al.
6
(1994).
7
The prevalence of oleic , stearic, and palmitic acids, which accounted for about 85% of the total
8
fatty acids, was in agreement with values commonly accepted for beef fat (Clinquart et al., 1991;
9
Duckett et al., 1993). The larger concentration of PUFA in intramuscular fat at 13.2 mol/100 mol was
10
probably due to the extraction of a higher proportion of phospholipids from the structural components
11
of muscle cell membranes, which are rich in linoleic acids (Duckett et al., 1993). A significant effect of
12
a period of restriction followed by realimentation appeared on the proportion of saturated fatty acids
13
(SFA) in G3 and G4 when compared to CG and G2. The SFA proportion decreased proportionally with
14
the duration of the low growth period, indicating that the age of the animals may have had stronger
15
effects than compensatory growth.
Implications
1 2
The reduction of growth in a growing fattening system with double-muscled bulls may be
3
beneficial under some conditions. An almost complete compensatory growth was observed when the
4
low growth period was relatively short, overcompensation being difficult to obtain. However, growth
5
potential seemed to be maintained until advanced age. Although carcass quality was reduced owing to
6
increased fat proportion, meat was leaner and fat richer in unsaturated fatty acids. Further trials need to
7
be conducted with a large size beef breed in order to locate the period of growth restriction in the
8
pattern of overall growth curves.
Literature Cited
1 2
Abdalla, H.O., D.G. Fox, and M.L. Thonney. 1988. Compensatory gain by Holstein calves after
3
underfeeding protein. J. Anim. Sci. 66:2687-2695.
4
Aberle, E. D., E. S. Reeves, M. D. Judge, R. E. Hunsley, and T. W. Perry. 1981. Palatability and
5
muscle characteristics of cattle with controlled weight gain: time on a high energy diet. J. Anim. Sci.
6
52:757-763
7
AOAC 1975. Official Methods of Analysis (12th Ed). Association of Official Analytical Chemists,
8
Arlington, VA.
9
Arthur, P.F., M. Makarechian, M.A. Price, and R.T. Berg. 1989. Heterosis, maternal and direct effects
10
in double-muscled and normal cattle: II. carcass traits of young bulls. J.Anim.Sci. 67:911-919.
11
Baker, R.D., N.E. Young, and J.A. Laws. 1992. The effect of diet in winter on the body composition of
12
young steers and subsequent performance during the grazing season. Anim. Prod. 54:211-219.
13
Barton-Gade, P.A., Cross, H.R., Jones, J.M., and Winger, R.J. 1988. Factors affecting sensory
14
properties of meat. In: H.R. Cross and A.J. Overby (Ed.) World Animal Science, B3. Meat Science,
15
Milk Science and Technology P 141. Elsevier Science, New York.
16
Berg, R.T., and R.M. Butterfield. 1966. Muscle:bone ratio and fat percentage as measures of beef
17
carcass composition. Anim.Prod. 8:1-11.
18
Berge, P. 1991. Long-term effects of feeding during calfhood on subsequent performance in beef cattle
19
(a review). Livest. Prod. Sci. 28:179-201.
20
Berge, P., Y. Geay, and D. Micol. 1991. Effect of feeds and growth rate during the growing phase on
21
subsequent performance during the fattening period and carcass composition in young dairy breed
22
bulls. Livest. Prod. Sci. 28:203-222.
Boakye, K. 1993.Changes in pH and Water Holding Capacity properties of Longissimus dorsi muscle
1
during beef ageing. Meat Sci. 34:335-349.
2
Bruce, H.L., and R.O. Ball. 1990. Postmortem interactions of muscle temperature, pH and extension on
3
beef quality. J. Anim. Sci. 68:4167-4175.
4
Bush, W.A., F.C. Parrish,Jr., and D.E. Goll. 1967. Molecular properties of post-mortem muscle. 4.
5
Effect of temperature on adenosine triphosphate degradation, isometric tension parameters, and
6
shear resistance of bovine muscle. J. Food Sci. 32:390-394.
7
Carstens, G.E., D.E. Johnson, and M.A. Ellenberger. 1987. The energetics of compensatory growth in
8
beef cattle. J. Anim. Sci. 65 (Suppl.1): 263-264.
9
Carstens, G.E., D.E. Johnson, and M.A. Ellenberger. 1989. Energy metabolism and composition of
10
gain in beef steers exhibiting normal and compensatory growth. In: Energy Metabolism of Farm
11
Animals. Eur. Assoc. Anim. Prod. Publ. 43:131-134.
12
Carstens, G.E., D.E. Johnson, M.A. Ellenberger, and J.D. Tatum. 1991. Physical and chemical
13
components of the empty body during compensatory growth in beef steers. J. Anim. Sci.
69:3251-14
3264.
15
Clinquart, A., L. Istasse, I. Dufrasne, A. Mayombo, C. Van Eenaeme, and J.M. Bienfait. 1991.Effects
16
on animal performance and fat composition of 2 fat concentrates in diets for growing-fattening bulls.
17
Anim. Prod. 53:315-320.
18
Dagnelie, P. 1975. Théorie et méthodes statistiques. Applications agronomiques. Vol.2 P 461. Les
19
presses agronomiques de Gembloux, Gembloux, Belgium.
20
Nutrition and Your Health: Dietary Guidelines for Americans. 1995. U.S. Department of Agriculture &
21
U.S. Department of Health and Human Services (4th Ed).
Drouillard, J.S., C.L. Ferrell, T.J. Klopfenstein, and R.A. Britton. 1991. Compensatory growth
1
following metabolisable protein or energy restrictions in beef steers. J. Anim. Sci. 69:811-818.
2
Duckett, S.K., D.G. Wagner, L.D. Yates, H.G. Dolezal, and S.G. May. 1993. Effects of time on feed on
3
beef nutrient composition. J. Anim. Sci. 71:2079-2088.
4
Dutson, T.R. 1983. Relationship of pH and temperature to disruption of specific muscle proteins and
5
activity of lysosomal proteases. J. Food Biochem.7:223-245.
6
Ellenberger, M.A., D.E. Johnson, G.E. Cartsens, K.L. Hossner, M.D. Holland, T.M. Nett and C.F.
7
Nockels. 1989. Endocrine and metabolic changes during altered growth rates in beef cattle. J. Anim.
8
Sci. 67:1446-1454.
9
Fumagalli, A., L.S. Verde, C.P. Moore, and H.M. Fernandez. 1989.The effect of zeranol on live weight
10
gain, feed intake and carcass composition of steers during compensatory growth. J. Anim. Sci.
11
67:3397-3409.
12
Garcia, P.T., and J.J. Casal. 1992. Compensatory growth and zeranol implants: effect on steer body
13
fats. In: 38th International Congress of Meat Science and Technology. Vol. 2, p. 61.
Clermont-14
Ferrand. France.
15
Greenhalgh, J.F.D. 1986. Recent studies on the body composition of ruminants. Proc. Nutr. Soc.
16
45:119-130.
17
Grosse, F., K. Ender, and C. Jais. 1991.Lean meat quality in fattening bulls as influenced by genotype,
18
carcass weight and muscle. Archiv. Fur. Tierzucht.-.Archives of Animal Breeding. 2:131-140.
19
Hayden, J.M., J.E. Williams, and R.J. Collier. 1993. Plasma growth hormone, insulin-like growth
20
factor, insulin, and thyroid hormone association with body protein and fat accretion in steers
21
undergoing compensatory gain after dietary energy restriction. J. Anim. Sci. 71:3327-3338.
Honikel, K.O., C.J. Kim, and R. Hamm. 1968.Sarcomere shortening of prerigor muscles and its
1
influence on drip loss. Meat Sci. 16:267-282.
2
Itoh, M., K. Arihara, Y. Kondo, T. Matsumoto, K. Tarumi, T. Tabata and N. Ikeda. 1989. Analysis of
3
influencing factors on meat color evaluation of fattening Holstein steers. Jpn. J. Zootech. Sci.
4
60:321-329.
5
Lee, Y.B. 1986. Early-postmortem measurements and conditionning in assessing and enhancing meat
6
quality. J. Anim. Sci. 63:622-632.
7
Lochner, J.V., R.G. Kauffman, and B.B. Marsh. 1980.Early-postmortem cooling rate and beef
8
tenderness. Meat Sci. 4:227-241.
9
Lopez Saubidet, C., and L.S. Verde. 1976. Relationship between live weight, age and dry-matter intake
10
for beef cattle after different levels of food restriction. Anim. Prod. 22:61-69.
11
Martin, S., and G. Torreele. 1962. L'appréciation de la qualité des carcasses bovines par la découpe du
12
segment tricostal 7-8-9. Ann. Zootech. 11:217-224.
13
Rompala, R.E., S.D.M. Jones, J.G. Buchanan-Smith, and H.S. Bayley. 1985. Feedlot performance and
14
composition of gain in late-maturing steers exhibiting normal and compensatory growth. J. Anim.
15
Sci. 61:637-646.
16
Ryan, W.J., I.H. Williams, and R.J. Moir. 1993a.Compensatory growth in sheep and cattle. I. Growth
17
pattern and feed intake. Aust. J. Agric. Res. 44:1609-1621.
18
Ryan, W.J., I.H. Williams, and R.J. Moir. 1993b.Compensatory growth in sheep and cattle. II. Changes
19
in body composition and tissue weights. Aust. J. Agric. Res. 44:1623-1633.
20
SAS. 1990. SAS User's Guide: Statistics (Version 6.06 Ed.). SAS Inst. Inc., Cary, NC.
21
Scott, S.L., R.J. Christopherson, J.R. Thompson and V.E. Baracos. 1993. The Effect of a Cold
22
Environment on Protein and Energy Metabolism in Calves. Br.J.Nutr. 69:127-139.
Shahin, K.A. and R.T. Berg. 1985. Growth patterns of muscle, fat and bone, and carcass
1
composition of double muscled and normal cattle. Can.J.Anim.Sci. 65:279-294.
2
Simon, O. 1989. Metabolism of proteins and amino acids. In: H.D. Bock , B.O. Eggum, A.G. Low, O.
3
Simon, and T. Zebrowska (Ed) Protein metabolism in farm animals. P 273. Oxford Sci
Publ-4
Deutscher Landwirtsschaftsverlag Berlin.
5
Smith, G.M., J.D. Crouse, R.W. Mandigo, and K.L. Neer. 1977. Influence of feeding regime and
6
biological type on growth, composition and palatability of steers. J. Anim. Sci. 45:237-253.
7
Swatland, H. J. 1977. Accumulation of myofiber nuclei in pigs with normal and arrested development.
8
J. Anim. Sci. 44:759-764.
9
Szücs, E., A. Nagy-Németh, M. Vada-Kovacs, I. Boda, A. Csiba, I. Acs, and E. Votsiky. 1987.Effect of
10
genotype and age on meat quality parameters influencing palatability in several muscles (LD, PS,
11
ST) of young fattening bulls. World Rev. Anim. Prod. 23:89-95.
12
Ter Meulen, V.U., H. Nordbeck, and S. Molnar. 1975. Untersuchungen zur Morphologie und
13
Physiologie des Perirenalen Fettgewebes beim Kalb und der Einfluss der Umgebungstemperatur auf
14
seine Funktion. 2. Mitteilung Methodik und Versuchsergebnisse. Z. Tierphysiol. Tierernährg. u.
15
Futtermittelkde. 35:144-163.
16
Thomas, L.H., P.D.P. Wood, and J.M. Longland. 1978. The influence of disease on the performance of
17
beef cattle. Br. Vet. J. 134:152-161.
18
Uytterhaegen, L., E. Claeys, D. Demeyer, M. Lippens, L.O. Fiems, C.Y. Boucque, G. Van de Voorde,
19
and A. Bastiaens. 1994. Effects of double-muscling on carcass quality, beef tenderness and
20
myofibrillar protein degradation in Belgian Blue White bulls. Meat Sci. 38:255-267.
Van Eenaeme, C., A. Clinquart, L. Uytterhaegen, J.L. Hornick, D. Demeyer, and L. Istasse. 1994. Post
1
mortem proteases activity in relation to muscle protein turnover in Belgian Blue bulls with different
2
growth rates. Sci. Alim. 14:475-483.
3
Wilson, P.N., and D.F. Osbourn. 1960. Compensatory growth after undernutrition in mammals and
4
birds. Biol. Rev. 35:324-363.
5
Wright, I.A., and A.J.F. Russel. 1991.Changes in the body composition of beef cattle during
6
compensatory growth. Anim. Prod. 52:105-113.
7
Yambayamba, E., and M.A. Price. 1991. Growth Performance and Carcass Composition in Beef
8
Heifers Undergoing Catch-Up (Compensatory) Growth. Can. J. Anim. Sci. 71:1021-1029.
9
Yates, L.D., T.R. Dutson, J. Caldwell, and Z.L. Carpenter. 1983.Effect of temperature and pH on the
10
post-mortem degradation of myofibrillar proteins. Meat Sci. 9:157-179.
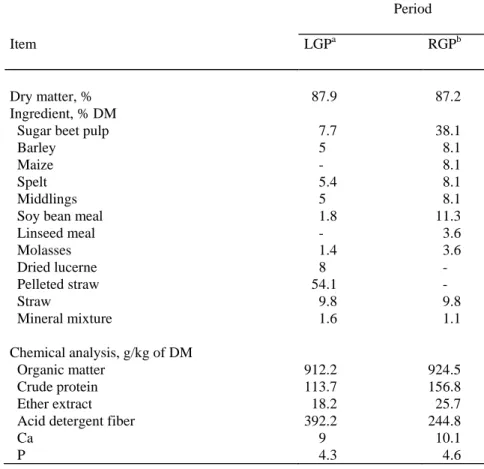
Table 1. Composition of the diets.
Period
Item LGPa RGPb
Dry matter, % #87.9 #87.2
Ingredient, % DM
Sugar beet pulp ##7.7 #38.1
Barley ##5 ##8.1
Maize ##- ##8.1
Spelt ##5.4 ##8.1
Middlings ##5 ##8.1
Soy bean meal ##1.8 #11.3
Linseed meal ##- ##3.6 Molasses ##1.4 ##3.6 Dried lucerne ##8 ##- Pelleted straw #54.1 ##- Straw ##9.8 ##9.8 Mineral mixture ##1.6 ##1.1 Chemical analysis, g/kg of DM Organic matter 912.2 924.5 Crude protein 113.7 156.8 Ether extract #18.2 #25.7
Acid detergent fiber 392.2 244.8
Ca ##9 #10.1
P ##4.3 ##4.6
a Low growth period. b Rapid growth period.
Table 2. Animal performances during fattening (CG) or during low growth periods (LGP) lasting for 4, 8, or 14 mo (G2, G3, G4) before a fattening period (RGP) in Belgian Blue double muscled bulls.
Group
Item CG G2 G3 G4 Levels of
significance SEM Low growth period
Initial weight, kg 301.9 306.1 302.7 NS #12.88
Final weight, kg 367.7a 434.9b 485.7c *** #12.13
Total gain, kg #65.8a 128.8b 183.1c *** ##6.33
Length, d 114.7a 238.6b 411.2c *** ##3.42
Average daily gain, kg/d .57a ## .54a ## .44b ** ##.023 Total feed consumption, kg (1) 672a 1411b 2618b *** #36.18 Mean feed consumption, kg/d ##5.9a ##5.9a ##6.4c + ##.13 Feed conversion ratio, kg/kg (1) #10.21a #11.12b #14.42c *** ##.33 Rapid growth period
Initial weight, kg 300.5a 401.9b 473.6c 533.6d ** #14.46 Final weight, kg 630.7a 621.9a 646.6a 704.8b * #17.99 Total gain, kg 330.2a 220.0b 172.9c 171.2c ** #10.44
Length, d 252.3a 146.6b 120.2c 111.6c *** ##4.57
Average daily gain, kg/d ##1.32a ##1.51b ##1.43ab ##1.53b * ##".86 First month, kg/d 1.59b 1.86b 1.14a 1.79b * .91 Second month, kg/d 1.49a 1.93b 1.60b 1.62b + .90 Third month, kg/d 1.56 1.46 1.47 1.28 NS .95 Total feed consumption, kg 2424a 1700b 1283c 1355c *** #44.03 Mean feed consumption, kg/d ##9.7a #11.8c #10.7b #12.1c + ##.33 Feed conversion ratio, kg/kg ##7.37 ##7.71 ##7.53 ##7.92 NS ##.16 Both periods
Initial weight, kg 300.5 301.9 306.1 302.7 NS #13.75 Final weight, kg 630.7a 621.9a 646.6a 704.8b * #17.99 Total gain, kg 330.2a 320.0a 340.5a 402.1b *** #11.69
Length, d 252.3a 291.2b 389.8c 557.7d *** ##5.43
Average daily gain, kg/d ##1.32a ##1.10b ##.87c ##".72d *** ##.033 Total feed consumption, kg 2425a 2559b 2968c 4270d *** #60.67 Mean feed consumption, kg/d ##9.7a ##8.8b ##7.6cd ##7.6d *** ##.192 Feed conversion ratio, kg/kg ##7.37a ##8.00b ##8.74c #10.65d *** ##.16 a,b,c,d Means within a row with common superscript do not differ at P < .1 ( + ), P < .05 ( * ), P < .01 ( ** ) or P < .001 ( *** ). NS: not significant ( P > .1)
Table 3. N intake, N digested, N digestibility and N balance during fattening (CG) or during low growth periods (LGP) lasting for 4, 8, or 14 mo (G2, G3, G4) before a fattening period (RGP) in Belgian Blue double muscled bulls (1).
Group
Items CG G2 G3 G4 Levels of
significance SEM Low growth period
N intake (g.d-1/animal) 100.57 98.43 98.43 NS 4.67 Digested N (g.d-1/animal) 63.09 63.67 62.95 NS 2.93
N digestibility (%) 62.7 64.7 63.9 NS 1.44
N balance (g.d-1/animal) 21.28 21.56 23.78 NS 3.28 Rapid growth period
N intake (g.d-1/animal) 202.38a 213.29ab 217.56ab 238.89b * 6.68 Digested N (g.d-1/animal) 140.45a 156.47ab 155.67ab 171.39b * 6.19 N digestibility (%) 68.79a 72.89b 71.48ab 71.69ab + 0.90 N balance (g.d-1/animal) 53.25a 67.85b 65.32ab 72.52b + 3.81
a,b
Means within a row with common superscript do not differ at P < .1 ( + ), P < .05 ( * ), or
P < .01 ( ** ). NS: not significant ( P > .1)
(1) data compared by analysis of covariance, using contemporary live weight as factor of covariance.
Table 4. Slaughter characteristics and carcass composition in Belgian Blue double muscled bulls slaughtered after fattening (CG) or after a low growth periods (LGP) lasting for 4, 8, or 14 mo (G2, G3, G4) followed by a fattening period (RGP).
Group
Items CG G2 G3 G4 Levels of
significance SEM Slaughter characteristics
Final live weight, kg 630.7a 633.3a 646.6a 704.8b * 17.27 Slaughter weight, kg 620.6a 613.4a 630.2a 693.3b * 17.09 Warm carcass weight, kg 398.9a 390.4a 396.2a 447.0b ** 11.52 Dressing percentage, % 64.3a 63.6ab 62.9b 64.5a * .41 Carcass composition Yield, kg Muscle 298.5a 285.5a 285a 334.4b ** 8.36 Connective-adipose tissue 49.6a 53.3ab 59.5bc 64.0c * 3.00 Bone 51.7 51.6 50.4 54.3 NS 1.65 Proportion, % (1) Muscle 74.7a 73.1ab 72.3b 73.9ab * 4.25 Connective and adipose tissue 12.4a 13.6ab 14.9b 14.1ab * 3.58 Bone 12.9 13.3 12.8 12.0 NS 2.49 Muscle/bone ratio 5.84 5.54 5.66 6.11 NS 2.17 Connective-adipose tissue/bone ratio 0.97a 1.03ab 1.17b 1.14b + 0.17
a,b,c
Means within a row with common superscript do not differ at P < .1 ( + ), P < .05 ( * ), or
P < .01 ( ** ). NS: not significant ( P > .1)
Table 5. Meat quality parameters after a period of fattening (CG) or after slow growth lasting for 4, 8, or 14 mo (G2, G3, G4) followed by rapid fattening (RGP), in Belgian Blue double muscled bulls. Group Items CG G2 G3 G4 Levels of significance SEM Temperature at 1h, °C #37.6b #38.5a #38.5a #39.4c * .24 Temperature at 2h, °C #34.7a #35.1a #36a #38.8b ** .56 Temperature at 4h, °C #24.1b #27.3a #28.2a #31.9c ** .72 pH at 1h ##6.6ab ##6.8a ##6.6b ##6.3c + .058 pH at 2h ##6.4a ##6.6b ##6.4ab ##6.1c + .073 pH at 4h ##6.1a ##6.0a ##6.0a ##5.6b *** .062 pH at 48h ##5.6 ##5.5 ##5.5 ##5.5 NS .032 Brightness L*, % #42.5 #41.2 #42.0 #42.8 NS .83 a* #16.2a #16.9a #18.5b #18.4b * .49 b* #16.0a #16.4ab #17.2b #17.7c + .44 Hue a*/b* ##1.01 ##1.03 ##1.08 ##1.05 NS .022 Cooking loss, % #19.8a #22.1b #26.1b #25.0b * .9 Drip loss, % ##4.3ac ##3.5c ##4.9ab ##5.2b * .31 Warner Bratzler peak shear force, N #40.3bc #33.6ab #29.6a #38.0bc + 2.79
a,b,c
Means within a row with common superscript do not differ at P < .1 ( + ), P < .05 ( * ), P < .01 ( ** ) or P < .001 ( *** ). NS: not significant ( P > .1)
Table 6. Chemical composition of Longissimus Thoracis muscle from Belgian Blue double muscled bulls, slaughtered after fattening (CG) or after low growth periods (LGP) lasting for 4, 8, or 14 mo (G2, G3, G4) followed by a fattening period (RGP) in Belgian Blue double muscled bulls. Item Group CG G2 G3 G4 Levels of significance SEM Dry matter, % #25.0 #25.0 #24.2 #24.8 NS .38 Ash, % of DM ##4.1a ##4.3ab ##4.8c ##4.5b * .07 Crude protein, % of DM #85.6a #89.0b #86.9a #89.4b * .71 Ether extract, % of DM ##6.2a ##4.7b ##4.7b ##4.1b + .56 Cholesterol, % of DM ##.23a ##.23a ##.24a ##.15b ** .15 a,b,c
Means within a row with common superscript do not differ at P < .1 ( + ), P < .05 ( * ), P < .01 ( ** ) or P < .001 ( *** ). NS: not significant ( P > .1)
Table 7. Fatty acid composition (mol/100 mol) of subcutaneous, intermuscular and
intramuscular fat in Belgian Blue double muscled bulls, slaughtered after fattening (CG) or after low growth periods (LGP) lasting for 4, 8, or 14 mo (G2, G3, G4) followed by a fattening period (RGP).
Fatty acids
Item C14:0 C16:0 C16:1 C18:0 C18:1 C18:2 C18:3 SFA1 PUFA1 MUFA1 Group CG #3.2a 29.5a #1.9a 22.1ab 35.3a #6.9a #1.07a 54.9ab #8.0 37.2ab G2 #2.5b 29.1a #1.6b 23.5a 34.4a #7.8b #1.00a 55.2a #8.8 36.0a G3 #3.2a 31.8c #2.2a 18.7c 36.9b #6.2a #1.06a 53.7b #7.3 39.0c G4 #3.0a 27.8d #2.4c 20.9b 37.4b #6.5a #1.68b 52.0c #8.2 39.9c Levels of significance ** * + * + + *** + * * SEM #.15 #.51 #.19 #.99 #.70 #.76 #.10 #.78 #.83 #.81 Fat subcutaneous #3.7a 31.4a #3.2a 18.3a 38.2a #4.2a #1.0a 53.5a #5.2a 41.4a intermuscular #2.8b 27.8b #1.6b 25.8b 36.3b #4.6a #1.0a 56.6b #5.6a 37.8b intramuscular #2.4c 29.5c #1.4b 19.6a 33.8c 11.6b #1.6b 51.6c 13.2b 35.1c SEM #.10 #.44 #.10 #.71 #.56 #.33 #.10 #.59 #.36 #.61 Levels of significance ** ** *** *** ** *** *** * *** *** Interaction NS NS NS .1 #.01 #.1 NS #.05 NS #.05 1
SFA, saturated fatty acids; MUFA, monounsaturated fatty acids; PUFA, polyunsaturated fatty acids
a,b,c
Means within a row with common superscript do not differ at P < .1 ( + ), P < .05 ( * ), P < .01 ( ** ) or P < .001 ( *** ). NS: not significant ( P > .1)
Figure 1. Experimental design. Dates relative to fattening of control group (CG) or low growth periods (LGP) for 4, 8, or 14 mo (G2, G3, G4) before a fattening period (RGP) in Belgian Blue double muscled bulls. Arrows indicate the moment of N balance measurements.
CG 18/12 08/09 G2 18/12 23/04 23/05 17/10 G3 18/12 26/08 25/09 23/01 G4 18/12 14/02 16/03 06/07 LGP Transition RGP
Figure 2. Evolution of live weight gains (1a), estimated ADG (1b) and daily feed intake (1c) during fattening (CG) or during low growth periods (LGP) lasting for 4, 8, or 14 mo (G2, G3, G4) before a fattening period (RGP) in Belgian Blue double muscled bulls.
(a) 0 100 200 300 400 0 100 200 300 400 500 600 k g (b) 0 1 2 0 100 200 300 400 500 600 k g /d 0 4 8 12 0 100 200 300 400 500 600 k g /d (c) CG G2 G3 G4