THE DISSOCIATIVE ELECTROIONIZATION OF AMMONIA AND
AMMONIA-d
3. II. THE H
+
AND H
2+
DISSOCIATION CHANNELS
R. LOCHT, Ch. SERVAIS, M. LIGOT, M. DAVISTER and J. MOMIGNY
Département de Chimie Générale et de Chimie Physique, Institut de Chimie, Bâtiment B6, Université de Liège, Sart-Tilman par B-4000 Liège 1, Belgium
Abstract
The dissociative electroionization of NH3 (ND3), in the H+ (D+ ) and H2+ (D2+ ) dissociation channels, is
investigated in the 18-50 eV electron energy range. The H+ (D+ ) translational energy distribution spectrum shows several components and that of H2
+
(D2 +
) is continuous. The thermal energy component of the latter distribution is entirely ascribed to H2
+
/H2. For both ions the kinetic energy versus appearance energy diagram is
obtained and discussed. The H+ ion at the lowest onset is probably formed at the expense of NH3+ (Ã2E) state. In
the 22.5 eV electron energy range both H+ and H2 +
are formed by dissociative autoionization. Evidence is also brought for H+ and H2
+
formation at 22.5 and 26.5 eV through spontaneous decomposition of NH2 +
. Above 35 eV dissociation of doubly ionized states by Coulomb repulsion is mainly involved.
1. Introduction
Recently, the results on the dissociative ionization of NH3 in the NH2 +
and NH+ dissociation channels have been reported [1]. Translational energy distribution measurements, together with appearance energy determinations allowed us to discuss in detail most of the dissociation processes.
The dissociation of NH3 into H+ and H2+ has been investigated by a few groups. Appearance energies
were measured but very briefly discussed without kinetic energy measurements. The earliest work of Mann et al. [2] and the most recent publication of Mark et al. [3] included both ions. Only the former discussed dissociation processes, while the latter only mentioned onset energies.
Using energy-loss electron spectroscopy and electron-ion coincidence technique, Wight et al. [4] and Brion et al. [5] determined the fragmentation pattern of NH3, including the H
+
dissociation channels.
More recently Carnahan et al. [6] and Kurawaki and Ogawa [7] published their results on high Rydberg H atoms and excited H (n=2, 3, 4) atoms produced by electron impact on NH3. Time-of-flight distribution and
Doppler profile analysis of Balmer emission lines were used to derive kinetic energy distributions. Dissociative excitation processes, discussed in detail by the authors, can be linked to dissociative ionization work through the "core-ion" model [8,9].
This paper deals with the dissociative electroionization of NH3 in the H +
and H2 +
dissociation channels, including detailed ion translational energy analysis. The results on D+ and D2
+
from ND3 have been added. The
15-50 eV electron energy range is covered in order to include the NH3 double ionization energy range.
Preliminary results on this particular aspect have already been published earlier [1,10].
2. Experimental
The experimental technique, as well as its most recent modifications used in the present work, have extensively been described elsewhere [11,12]. Briefly, the ions produced in a Nier-type ion source by the impact of energy-controlled electrons are allowed to drift out of the ion chamber, are focused on the ion source exit hole, energy analyzed by a retarding lens and mass selected in a quadrupole filter. The detected ion current is continuously scanned as a function of either the electron energy at fixed retarding potential VR or the retarding
potental at fixed electron energy Ee. Both signals are electronically differentiated. The experiment is almost
The experimental conditions are identical with those described previously [1]. Ammonia (Air Liquide, 99.95%) and ammonia-d3 (Merk, Sharp & Dome 99.7%) samples, distilled under vacuum, are introduced at 10
-7
Torr as measured in the vacuum chamber.
The maximum of the NH3+ (ND3+ ) ion energy distribution is used as zero-energy calibration point of
the translational energy scale. The appearance energy of NH2+ (ND2+ ), i.e 15.72 ± 0.1 eV is used to calibrate the
electron energy scale.
For each fragment ion, at each retarding potential or electron energy setting, the first derivative of the ionization efficiency curve or of the retarding potential curve is scanned 100-800 times. This procedure is repeated at least five times. The energies quoted in the next sections are average values of these five independent measurements. The quoted errors and drawn error bars are given by the standard deviation. In the diagrams, linear regressions are fitted to the experimental data.
3. Experimental results
As an introductory remark, it has to be pointed out that beside NH3, two different proton sources could
be suspected, (i) Notwithstanding its low intensity after prolongated back out, H2O is present in the background
mass spectrum and produces H+ with a large cross section. (ii) As will be shown below H2 +
is probably formed through ionization of H2 produced by pyrolysis of NH3 on the electron emitting filament. Furthermore H2
+
is observed in the H2O mass spectrum, though with very low intensity.
The simultaneous analysis of D+/ND3 and H+/ NH3 would remove, at least to a large extent, the former
proton source. On the other hand, the kinetic energy distribution and the appearance energies of H+/ H2 are
available [13] and have to be kept in mind for the interpretation of the experimental results.
The same comments hold for H2 +
/NH3. However, most confusing will be the thermal or nearly thermal
H2+ (D2+) ions.
3.1. The H+ (D+) dissociation channel
Typical first differential retarding potential curves ofH+/NH3 and D +
/ND3, as observed at 61 eV
electron energy, are displayed in fig. 1. The identical shape of these curves indicates the absence of any contaminant, at least at low energy. Beside, a dominant low-energy peak, a shoulder at about 0.25 eV, slope changes around 0.6 eV and 1.5 eV, and finally a maximum near 4.0 eV are observed for H+. These values slightly shift toward lower energies for D+. The translational energy spectrum spreads up to 9 eV. Figs. 2 and 3 show the same distribution for D+ from 76-31 eV and 26.5-20.1 eV respectively. The maximum of the ND3
+
thermal ion energy distribution (see fig. 3) and the D+ low-energy peak only coincide for electron energies close to the lowest onset up to 23 eV. In the electron energy range 23-60 eV the same maximum regularly shifts upward to 45 meV. The same phenomenon is observed for H+ and is represented by the diagram in fig. 4. This means that the thermal H+ ions are only formed near the lowest onset. Above 23 eV only energetic protons are produced and dominate the translational energy spectrum.
At this point a comparison has to be made between the present results and those obtained for high Ryd-berg H(Rydb.) atoms and excited H*(n) atoms [6,7]. Concerning the position of the abovementioned features, the present H+ and D+ translational energy spectra agree fairly well with the H* (n=2) [ 6 ] H* (n=3,4) [7] kinetic energy spectra. However, the relative intensities are quite different, e.g. the distribution peaking at 4.0 eV dominates the H* kinetic energy spectrum at 70 eV electron energy. Surprisingly even less agreement is found with the translational energy spectrum of H(Rydb.) atoms [6], where a maximum at about 5.5 eV is the most intense feature. This could mean that at least for a number of processes leading to H(Rydb. ), the "core-ion" model no longer holds.
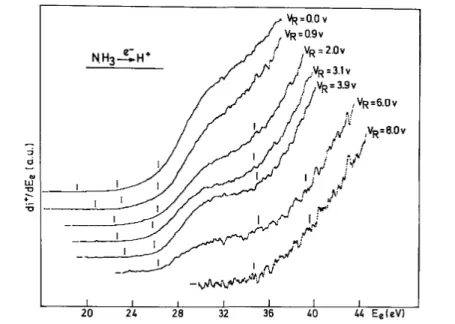
The first differentiated ionization efficiency curves of H+/NH3, as observed for different retarding
potential settings VR, are shown in fig. 5. Vertical bars locate the average position of the successive appearance
energies. The same measurements have been performed on D+/ND3. For comparison fig. 6 clearly shows both
ions having almost the same first differentiated ionization efficiency curve. Six appearance energies have been measured, i.e. 19.5 ± 0.2, 22.6 ± 0.3, 26.2 ± 0.1, 34.9 ± 0.4, 36.2±0.3 and 39.2 ± 0.2 eV. A critical energy is also measured at 45.7 ± 0.3 eV and could only be observed for 0.0 <VR< 0.9 V.
The kinetic energy versus appearance energy plot resulting from these measurements is displayed in fig. 7. The same plot for D+/ND3, restricted to the low energy range, is reproduced in fig. 8 together with the results
on H+/NH3 for comparison. Though both diagrams almost coincide within experimental error, systematic
differences are observed which probably should be ascribed to isotope effects.
Fig. 1. The kinetic energy distribution curves of H+/NH3 and D+/ND3 observed at 61 eV electron energy.
Fig. 3. Kinetic energy distribution spectra of D+/ND3 recorded between 26.5 and 20.1 eV electron energy. The
ND3+ distribution is included for comparison.
Fig. 4. Electron energy dependence of the position of the maximum of the H+ low-energy peak.
3.2. The H2+ (D2+ ) dissociation channel
Despite its low intensity (about 0.05% of total ionization), the H2 +
ion has been investigated because of its potential importance for the interpretation of NH+ and N+ formation at high energies.
The D2 +
/ND3 translational energy distribution spectrum, as obtained by the first derivative of the
retarding potential curve, is shown in fig. 9 for different impact energies of the electrons. The H2+/NH3 ion
energy distribution is strictly identical. Both distributions exhibit an intense thermal energy peak and a long and structureless tail, extending to about 5 eV, which disappears below 26 eV electron energy.
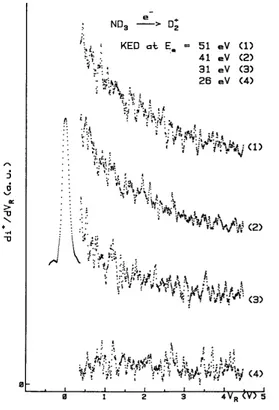
The first differentiated ionization efficiency curves ofD2 +
/ND3, as observed for different values of the
retarding potential, are displayed in fig. 10. In fig. 11 the same curve for H2 +
/NH3 is shown for comparison. For
both ions, different appearance energies, marked by a vertical bar, are measured respectively at 15.5 ± 0.2, 22.3 ± 0.2, 26.6 ± 0.3 and 35.7 ± 0.4 eV. The kinetic energy versus appearance energy diagram for both H2
+
/NH3 and
D2 +/
Fig. 5. First differentiated ionization efficiency curves of H+/ NH3 as observed for indicated retarding potential
( VR) settings. Vertical bars locate the average appearance energies.
Fig. 6. Comparison of the first differentiated ionization efficiency curves of H+/NH3 and D+/ND3, both recorded
at VR=0.0 V. Vertical bars locate the average appearance energies at low electron energies.
4. Discussion
For clarity in the following discussion, the results obtained in the present work are summarized in table 1. All the thermodynamical and spectroscopic data used to calculate critical energies are gathered in table 2.
4.1. The H+ (D+) dissociation channel
The lowest onset determined for the H+ production from NH3 +
drastically with previously published electron impact results, i.e. 23.3±0.5 eV [2] and 23.0±0.2 eV [3]. The discrepancy is at least of 3.5 eV. However, the present result is consistent with the measurements for D+/ND3 for
which an appearance energy of 19.4 ± 0.2 is obtained (see fig. 8 ).
Fig. 7. The kinetic energy versus appearance energy plot for H+/ NH3.
Fig. 8. The kinetic energy versus appearance energy plot for H+/ NH3 (-∆-) and D +
/ND3 (-◊-) between 18 and 33
eV electron energy.
The kinetic energy versus appearance energy diagram related to this threshold is the straight line (1) in fig. 7. In spite of the scattering of the onset measurements for 0-0.9 V retarding potential, a least-squares fit gives a correlation coefficient of 0.96 for a straight line extrapolating to 19.67 eV with a slope of 0.49. For the same measurements in D+/ND3, the straight line extrapolates to 19.62 eV with a slope of 0.29 and a correlation
Fig. 9. Kinetic energy distribution spectra of D2+/ND3 as observed at indicated electron energies.
Fig. 10. First differentiated ionization efficiency curves of D2 +
/ND3 recorded at indicated retarding potential
Fig. 11. First differentiated ionization efficiency curves of H2+/NH3 recorded at VR=0.0V and 0.2 V shown for
comparison with D2 +
/ND3.
Table 1. The kinetic energy distributions (KED) and appearance energies (AE) (eV) for H+ (D+) andH2+ (D2+ )
from NH3andND3 as obtained in this work
KED AE H+ (D+) 0.0-45 meV 19.5 ± 0.2 shift 22.6 ± 0.3 ≈0.25 26.2 ± 0.1 ≈0.6 34.9 ± 0.4 ≈1.5 36.2 ± 0.3 ≈4.0 39.2 ± 0.2 45.7 ± 0.4 H2 + (D2 + ) (0.0) a) (15.5±0.2)a) 22.3 ±0.2 26.6 ±0.3 35.7 ±0.4 a)
In parentheses data ascribed to H2+ (D2+ ) from H2 (D2).
Table 2. Disocation energies (D), ionization energies (IE) and excitation energies (EE) (eV) used in this work a) D(NH2-H)=4.51 ± 0.09 b) EE(NH2 + (X~ 3 B1)) = 0.0 d) D(NH-H) = 3.90 ± 0.09 b) EE(NH2 + (ã 1A1)) = 0.99 d) D(N-H) = 3.69c) EE(NH2+( b ~1 B1)) = 2.23d) D(H-H) =4.476c) EE(NH 2(X ~ 2B 1))=0.0f) EE(NH2(Ã 2A1)) = 1.27f) IE(NH2) = 11.46 ± 0.01 d) EE(NH(X 3Σ-))=0.0g) IE(NH) = 13.49 ± 0.01 d) EE(NH(a1∆)) = 1.558 g) IE(H2) = 15.496 c) EE(NH(b lΣ+))=2.629 g) IE(H) = 13.595 e) EE(NH(A 3Π)) = 3.69g) IE(N) = 14.549e) EE(NH(c 1Π)) = 5.423 g) EE(NH+(X 2Π))=0.0h) EE(N(4S))=0.0e) EE(NH+(a 4Σ-)) =0.044 h) EE(N(2D))=2.38e) EE(NH+(A 2Σ-)) = 2.674 h) EE(NH+(B 2∆))=2.847 h) EE(NH+ (C 2Σ+ ) ) =4.409 h) a)
1 eV=23.060 kcal mol-1
= 8065.73 cm-1 . b) Ref. [14]. c) Ref. [15]. d) Ref. [16]. e) Ref. [17]. f) Ref. [18]. g) Ref. [19]. h) Ref. [20].
Fig. 12. The kinetic energy versus appearance energy plot for H2+/NH3 (-∆-) and D2+/ND3 (-◊-) between 20 and
36 eV electron energy.
The slope of 0.49 could suggest that the observed H+ would be produced by dissociative ionization of H2. As will be mentioned below, H2 is in fact produced very likely by thermolysis of NH3 on the electron
emitting filament. In this case the linear dependence of the kinetic energy upon the electron energy would indeed be a straight line with a slope of 0.5. However, the same phenomenon being observed for ND3, the same slope of
0.5 has to be expected. Experimentally a slope of 0.29 is observed. Furthermore, the appearance energy of H+/H2
is well below 19.5eV, i.e. 18.1 eV [13].
The lowest energy required for the production of H+ from NH3 through
NH3+e -→NH2 (X ~2 B1)+H + (1Sg)+2e -,
is calculated at 18.105 eV, based on the data listed in table 2. As shown in fig. 6, in the first differentiated ionization efficiency curve of H+ and D+ no signal could be detected below 19.5 eV. Therefore the energy difference between measured and calculated onset has to be ascribed to the excitation of NH2 only, i.e. 19.5 —
18.1 = 1.4 eV. This energy difference is close to the excitation energy of NH2 in its 2
A1 state found at 1.27 eV by
optical spectroscopy (see table 2). The most probable mechanism to be invoked for the threshold at 19.5 eV is
NH3+e -→NH3 + (Ã2E) →NH2 (Ã 2 A1)+H + + 2e-,
and lies in the energy range of the NH3+ (Ã2E) state. From previous work, this state is known to be split by
Jahn-Teller interaction into 2A' +2A" states [21] and to give rise to NH+ and NH2 +
by predissociation [21, 1]. The photoelectron band related to the à 2E state has a shape suggesting that this state is populated well above 16.9 eV [22], the lowest appearance energy of NH+ [1]. It seems to be likely that at 19.5 eV dissociative ionization is observed through the direct population of the  2E (2A' +2A") dissociation continuum. However, at the present time the fact that the lowest dissociation process calculated at 18.105 eV is not observed, remains unexplained.
The expected slope for the dissociation process involving H+ and NH2 is mNH2/mNH3 = 16/17=0.94,
while the observed slope is s=0.49. This indicates that the excess energy with respect to the dissociation limit at 19.5 eV is shared to a large extent (about 50%) between translational and internal (essentially vibrational) energy of NH2. This analysis is confirmed by the measurements on D+/ND3. A slope si=0.29 is observed instead of the
expected value of mND2/mND3 = 18/20=0.9.
Both processes involving vibrational energy content of NH2 and ND2, the ratio of the two experimental
slopes si/s has to be related to the isotope effect on the vibrational frequencies of both species. This isotope effect
molecular masses are given by Herzberg [23]. When the antisymmetric frequency is chosen, ρ3 = (v3i/v3)2=0.56,
whereas for the symmetric vibrations ρ1,2(v1,2 i
1/v1,2) 2
=0.28. A fairly good agreement is found between ρ3 and
si/s= 0.59, in spite of the poor correlaton coefficient of the least-squares fit. This might be an indication that
essentially v3 is active in this process.
As mentioned above, two investigations of dissociative excitation were performed on H atom formation from NH3. Both studies include the kinetic energy distributions and threshold energy measurements. These
results can be "extrapolated" to dissociative ionization work. Furthermore, Böse and Sroka [24] examined various H (Lyman) emissions produced by electron impact on NH3 without kinetic energy measurements.
Carnahan et al. [6] measured the first onset at 17.8± 0.8 and 23.2 ± 0.7 eV for H(n=2) and H (Rydb. ) atoms respectively. For both processes the minimum translational energy carried by the H atom is about 0.1 eV. Kurawaki and Ogawa [7] observed the first onset at 21.0 ± 0.8 and 22.5 ± 0.8 eV for H(n=3) and H(n=4) atoms carrying respectively 1.0 eV and 1.0 eV kinetic energy. None of these energies correlate with a dissociative ionization appearance energy of 19.5 ± 2 eV. However, Böse and Sroka [ 24 ] measured an onset at 16.1 ± 0.4 eV for H (Lym.-α). When the energy difference of IE(H) — EE(H, n=2) = 3.4 eV is added to this value, a threshold of 19.5 ± 0.4 eV is obtained for H+/NH3.
In fig. 7 two onsets are observed around 22.6 eV, i.e. 22.6 ±0.3 eV, in the kinetic energy range 0-0.8 eV (see straight line (2) ), and 22.4 ± 0.1 eV (see vertical line ( 3 ) ). This latter process is observed over the 2.8-4.3 eV kinetic energy range. Fig. 8 shows the result of the same measurements for D+/ND3.
At 22.6 ± 0.3 eV enough energy is available to produce the proton through
for which the lowest onset is calculated at 22.01 ± 0.2 eV from the data listed in table 2. The higher excitation of NH2 although possible cannot be considered because of lack of data. If the energy difference of 0.5 ± 0.3 eV in
excess between experimental and calculated threshold is significant, it would be ascribed to internal energy of the NH radical, since no translational energy is available at the onset (see diagram (2) in fig. 7). From the following discussion, most likely, the excess energy above the onset is partitioned between vibrational and translational energy.
The straight line (2) starting at 22.6 ± 0.3 eV is the result of a least-squares fit, has a slope of 0.89 and extrapolates to 22.51 eV. The correlation coefficient is rather poor, i.e. 0.93. The expected slope of H+, produced through the abovementioned process, is roughly given by mNH/2mNH3 = 0.44. Notwithstanding the poor
correlation, the discrepancy between experimental and expected slope is large. Furthermore, when the same fit is applied to the corresponding data of D+/ND3 (see fig. 8, line (2) ), a straight line with a slope of 0.54 and
extrapolating to 22.47 is obtained. The correlation is also 0.93. The slopes are significantly different: the eight onsets measured for D+ are systematically higher than the corresponding data for H+. Moreover, as evidenced earlier in this discussion, for a diatomic radical ρ=(vi/v)2= µ/µi=0.94/1.75=0.54, whereas si/s≈0.5/0.9≈ 0.55.
These arguments tend to support a partition of the total excess energy between vibrational and translational energy.
To account for the experimental results a two-step proton production mechanism has to be invoked, i.e.
where the proton carries 15/16=0.94 of the total translational energy, close to the observed slope. This agreement would suggest total energy conversion into translational energy. Expecting the same reaction sequence in ND3,
to the excess energy partitioning between translational and vibrational energy. This latter would account for the abovementioned isotope effect.
At about the same energy, i.e. 22.4 ± 0.1 eV, a vertical line followed by a straight line is observed. The least-squares fit of the data points (3) in the diagram of fig. 7 gives a straight line with a slope of 0.93 and extrapolates to 19.31 eV. The correlation coefficient is 0.97. The corresponding data for D+/ND3 (see fig. 8) are
in very good agreement. Compared to the expected slope of 0.94, straight line (3) is related to a dissociative ionization process where the excess energy is entirely converted into translational energy of the fragments. The slope of 0.93 and the extrapolated appearance energy AEKE=0= 19.3 eV clearly indicate that H+ is produced by
the process
The excess energy with respect to the dissociation limit is entirely converted into translational energy carried away by the fragments.
As already mentioned elsewhere [1], at the energy of 22.6 eV several dissociation processes have been observed, leading to NH2
+
and NH+. However, the photoelectron spectrum of NH3 clearly shows no cross section
for ionization of NH3 at this energy [25]. As suggested earlier, the intermediate state of NH3 producing NH2+,
NH+ and H+ has to be a neutral super-excited state which could have a Rydberg character. In this case this state could be a member of a series converging to the NH3+ (B
~2A
1) state whose adiabatic ionization energy is 24.0 eV
[25]. The photoelectron band at this energy is structureless, the B~2A1 state could be considered as unstable at
least in the Franck-Condon region. The NH3 *
state giving rise to the abovementioned processes would have the same property.
The comparison with previous electron impact work is more feasible in the energy range of 22.5 eV. Mann et al. [2] measured the first onset of H+ at 22.5 ±0.5 eV and interpreted this threshold by the formation of NH and H. Mark et al. [3] observed the first appearance energy of the proton at 23.0 ± 0.2 eV, without interpretation.
Considering the dissociative excitation experiments involving H*(n) and H(Rydb.) atoms, most experiments agree fairly well by measuring an onset near 22.5 eV, i.e. 22.5±0.8 eV for H(n=4) carrying 1-3 eV kinetic energy [7] and 23.7±0.7 eV for H (Rydb.) carrying 0.4-4 eV kinetic energy [6]. Böse and Sroka [24] determined a second onset for H(Lym.-α) at 21.8 ± 0.8 eV. The authors agree to assign to these energies the same process
but only Kurawaki and Ogawa [7] were able to distinguish two H(n=4 ) contributions at 22.5 ± 0.8 eV, i.e. that with 1 eV kinetic energy is ascribed to the abovementioned process, whereas a 3 eV kinetic energy component is assigned to
in agreement with the present work. Carnahan et al. [6] ascribed the H(2s) and H(Rydb.), at 21.8 and 23.2 eV respectively, to the same process involving, however, 0.4-10 eV kinetic energy.
A vertical line spread over 6 eV translational energy carried by H+ is observed at 26.2 ± 0.1 eV. A straight line (4) in fig. 7, defined by only three data points, extends to about 7 eV with a slope of 0.55. This value has to be compared with either (i) 0.94 if the proton is produced through the dissociation of the NH2
+
into NH and H+ or (ii) 0.44 when H+ is directly produced by dissociative ionization of NH3 together with NH and H.
When the former process takes place, the discrepancy between observed and calculated slopes could be ascribed to the excess energy partition between translational and internal energy of the polyatomic fragment. In this case an isotope effect ought to be observed. The results on D+/ND3 at the same energy (see fig. 8) do, however, not
drastic isotope effect on the slope, i.e. 0.4 instead of 0.44, is expected.
However, taking into account the minimum translational energy of 6 eV, i.e. 13.6 eV in terms of total kinetic energy, and the onset at 26.2 eV, a minimum appearance energy AEKE=0=12.6 eV is calculated. This
energy does not fit any dissociative ionization limit of NH3+.
Altogether these arguments strongly suggest that the proton is produced at 26.2 eV by dissociative ionization of H2. It will be shown in section 4.2 that free H2 is produced by thermolysis of NH3 on the electron
emitting filament.
A further reason to suspect the H+/H2 production is that Köllman [13] measured an onset at 26.1 ±0.5
eV, in very good agreement with the present value. However, the translational energy range covered by these protons is 4.5-8.0 eV; for 6 eV kinetic energy the onset is about 29 eV.
Despite these evidences, there still remain arguments for the direct H+ production from NH3 at 26.2 eV.
(i) The isotope effect is not observed because of the restricted number of data points in diagram (4) in fig. 8. (ii) Starting from 6 eV kinetic energy, an appearance energy AEKE=0(H
+
) = 19.7 eV, very close to 19.5 eV (the first onset ascribed to H+/NH3), is obtained, (iii) The energy of 26.2 eV corresponds to the vertical ionization energy
of the NH3 +
(B~2A1) state [25] which is known to give rise to fragments with large amounts of kinetic energy [1].
In the high electron energy range, i.e. above 34 eV, four appearance energies are measured: 34.9 ± 0.4, 36.2 ± 0.3, 39.2 ± 0.2 and 45.7 ± 0.4 eV. The same results are obtained for D+/ND3. The kinetic energy versus
appearance energy diagrams related to these critical energies are shown in fig. 7 by vertical lines (5), (7) and (6) respectively. The last onset being observed for 0.0< VR<0.9 V has not been included in this figure.
As mentioned earlier [1], dissociation processes of doubly ionized NH3 states are mainly involved in
this energy range. Ionization energies corresponding to NH32+ formation were measured at 34.9 ± 0.2 and 39.4 ±
0.5 eV [10]. By PIPICO a doubly ionized state is observed at 44.5 ± 0.5 eV [26]. When doubly ionized states dissociate into singly ionized fragments, the appearance energy for both species must be equal. Some of these processes have already been discussed in the frame of the NH2
+
(ND2 +
) and NH+ formation from NH3 [1].
The H+ (D+) ions appearing at 34.9 ± 0.4 eV, spread over 8 eV translational energy, are probably related to the NH2
+
(ND2 +
) ions observed at 35.4 ± 0.3 eV. This onset was ascribed to
for which an onset energy is calculated at 30.5 eV (see data listed in table 2 ). The energy difference of about 35.4 - 30.5 = 5 eV between observed and calculated onsets is ascribed to translational energy carried by both ND2+ and D+, i.e. 0.5 and 4.5 eV respectively. As for ND2+ a translational energy of 0.7 eV is measured [1], D+ is
observed up to 8 eV. Above 5 eV kinetic energy, protons could be produced with other fragments, i.e. H+, NH+ and N+. For NH+ no threshold is observed in the vicinity of 35 eV [1]. Moreover, these protons being of low intensity, H+ ions produced by the dissociation of H2
+
(2∑u +
) could become important [13]. As mentioned earlier, free H2/NH3 is known to be formed. The large scattering of the data above 5 eV does not allow a least-squares
fit.
No comparison can be made with previous electron impact data. Only Mark et al. [3] mention an onset at 30.6 ±0.5 eV. No critical energy is found in the energy range 26-34 eV in the present work. However, H(n=4) and H(Rydb.) atoms have been observed with excitation thresholds at 33.3 ± 1.2 eV [7] and 33.8 ± 1.0 eV [6], respectively. The former fragments carry 4-5 eV kinetic energy whereas the latter are produced with 3.5-8.2 eV kinetic energy. These processes could be related to the protons observed at 34.9 ± 0.4 eV with kinetic energies higher than 5 eV.
By photoionization [26], H+ and NH2 +
coincidences are measured at 35.4 ±0.5 eV in good agreement with both D+ and ND2+ onsets observed by electron impact in this work.
The appearance energy at 39.21 0.2 eV is observed for 5.0 < VR<8.0 V retarding potential. The
simultaneous observation of a double-ionization energy of NH3 at 39.4 ± 0.5 eV would suggest that this state
no onset is observed at this energy for NH2 +
nor NH+ [1]. An alternative explanation of this critical energy would be the dissociation of a highly excited, singly ionized NH3+ state. In this case the NH32+ ionic state would be
formed through autoionization which would compete with dissociation. Kurawaki and Ogawa [7 ] determined an excitation onset for H(n=4) atoms at 38.4 ± 1.5 eV carrying 8-12 eV kinetic energy. Through the "core-ion" model, the corresponding dissociative ionization process would lie at about 39.3± 1.5 eV accounting for IE(H)-EE(H,n= 4) = 0.85 eV. However, no H(Rydb.) atoms have been detected in this energy range by Carnahan et al. [6].
Between 34.9 and 39.2 eV an onset at 36.2 ± 0.3 eV is less clearly observed in the first differentiated ionization efficiency curve of H+, but could be observed up to 4.3 eV kinetic energy. As it has already been pointed out [1], appearance energies were measured at 36.6 ± 0.3 and 36.2 ± 0.4 eV for ND2+/ND3 and
NH+/NH3, respectively. It has been shown that the NH +
formation occurs through
The corresponding threshold for ND2+ has been interpreted by
The onset for this process is calculated at 29.5 eV, using the data listed in table 2. The amount of total translational energy carried away by the fragments in this process would be 6.7 eV, i.e. 6 eV by D+ and 0.7 eV by ND2+. Experimentally ND2+ is observed up to 0.9 eV whereas the D+ ion could be measured up to 4.3 eV
kinetic energy.
As mentioned in section 3, the appearance energy at 45.7 ± 0.4 e V could only be measured with a reasonable accuracy up to 1.0 eV kinetic energy. At this energy the H+ contribution very rapidly decreases with increasing retarding potential and the signal/noise ratio becomes worse.
For ND2 +
as well as NH+ a threshold energy is measured at 46.5 ± 0.4 and 46.4 ± 0.5 eV; the ions carrying at least 0.7 and 0.9 eV translational energy respectively [1]. Probably these critical energies are related to one another. In addition PIPICO measurements were performed in this energy range and a component, unresolved with respect to m/e= 14 and m/e= 15, has an onset at 44.5±0.5 eV. On the other hand, H(n=4) [7] H(Rydb.) atoms [6] were observed up to 41.7±1.7 eV with translational energies of 8-12 eV.
At this energy, the proton is very likely produced through both
even when for experimental reasons H+ (D+ ) could not be observed at VR > 1.0 V. On the basis of the data listed
in table 2 and the observed 7.6 eV total translational energy carried by NH+ [1], the energy required for the abovementioned NH+-producing process is 45.8 eV.
In the NH2 +
dissociation channel, the measurements were performed on ND3. On ND2 +
only 0.7 eV kinetic energy is measured, i.e. 7 eV total translational energy. The D+ ion is observed up to 1 eV kinetic energy. The highest dissociation limit for ND2
+
formation, which could be calculated from the data listed in table 2, lies at 32.7 eV. By adding 7 eV total translational energy of the fragments, an energy of 39.7 eV is obtained. The energy difference of about 7 eV between the observed onset and the foregoing energy balance could only be
ascribed to the excitation of ND2+. 4.2. The H2 + (D2 + ) dissociation channel
The lowest appearance energy measured for both H2 +
and D2 +
(see figs. 10 and 11) lies at 15.5 ± 0.2 eV. This value is in very good agreement with that published by Mann et al. [2], who observed only one onset at 15.5 ± 0.5 eV. Mark et al. [3] mentioned a threshold at 14.8 ± 0.2 eV.
At this energy the first differentiated ionization efficiency curve rises very steeply and this part of the curve is suppressed by applying 0.2 V retarding potential. The H2
+
(D2 +
) ions produced at 15.5 eV are thermal and are the only contribution to the thermal peak observed in the kinetic energy distribution displayed in fig. 9. Moreover, the ionization energy of molecular H2 is 15.496 eV (see table 2 ), in very good agreement with the
onset energy for H2 +
(D2 +
) in this work. Together these arguments strongly suggest that free H2 is produced from
NH3 in the ion source (likely by thermolysis on the electron emitting filament). The same phenomenon is
observed for ND3.
The first onset ascribed to H2 +
(D2 +
) formation through dissociative ionization of NH3 (ND3) lies at 22.3
± 0.2 eV. Its dependence upon the retarding potential is given by a vertical line (1) in fig. 12. Within experimental error, the data related to H2
+
" and D2 +
behave in the same way.
The lowest threshold which could be calculated for H2 +
production from NH3 is at 19.45 ± 0.18 eV by
using the data listed in table 2. This energy corresponds to the reaction
Experimentally both H2 +
and D2 +
carry away 3.4 eV kinetic energy. The appearance energy AE(H2+)KE=0=22.3-3.4Xl7/15 = 18.5 eV. This value is lower than that for the predicted dissociation mechanism
mentioned above. The discrepancy between calculated onset and latter value is about 1.0 ±0.4 eV. In the discussion of the results on the NH2
+
and NH+ ion formation [1], discrepancies of 0.24 ±0.13 and 0.5 ± 0.3 eV have already been mentioned. They were ascribed to an overestimate of one or both dissociation energies D (NH2-H) and (NH-H).
Considering all the fragment ions studied so far, appearance energies are measured at about 22.6 eV for NH2
+
[1], NH+ [1], H+ (see table 1 ) and H2 +
. This critical energy lies where no ionization cross section is measured for NH3 [25]. All abovementioned ions are formed with large amounts of kinetic energy. The neutral
NH3* state is very likely a Rydberg state, member of a series converging to the NH3 +
(B~2A1 ) state. This latter
being almost dissociative, the NH3 *
state is very probably unstable in all the dissociation channels. Therefore dissociative autoionization will be the most probable mechanism of H2
+
formation at 22.3 eV.
From 26.6 ±0.3 eV the first derivative of the ionization efficiency curve of H2+ (D2+) rises more steeply.
The kinetic energy versus appearance energy plot is shown in fig. 12 by diagram (2). Owing to the scattering of the measurements, the data related to H2
+
and D2 +
are not distinguishable. From 0.2 eV translational energy, the data more or less clearly deviate from a vertical line at about 26.6 eV.
Taking into account all the measurements related to both H2 +
and D2 +
, the best correlation is found when gathering the data into two groups. Two fits are found by this way: (i) a first straight line between 0.2 and 1.4 eV kinetic energy, with a slope of 0.9 extrapolating to 26 eV with a correlation of 0.8 and (ii) a second straight line spread over 1.4-2.0 eV with a slope of 0.35 extrapolating to 23.0 eV with a correlation coefficient of 0.95.
The slope expected for the kinetic energy versus appearance energy straight line depends on the dissociation mechanism involved,
i.e. roughly 0.88, 0.27 and 0.87 for reactions (a), (b) and (c) respectively.
The slowest rising straight line has to be related to reaction (b): (i) the experimental slope of 0.35 compares favourably with the expected value of 0.27 and (ii) the extrapolated threshold of 23 eV is close to the calculated onset of 23.1 eV. The steeply rising straight line could be ascribed to either reaction (a) or (c) or both. Using the data of table 2, the corresponding appearance energies are 19.51 and 23.12 eV. Introducing the excitation energy of NH, the highest dissociation limit calculated for reaction (a) is 24.9 eV. For the two-step reaction (c), when both the parent ion NH2
+
and the product N contain excitation energy, i.e. are formed in the ã
1
A1 and 2D state respectively (see table 2), an onset of 26.46 eV can be calculated. This value is comparable to
the extrapolation at 26 eV.
These processes have to occur through the NH3 +
(B~2A1) state, whose vertical ionization energy lies at
about 26 eV and which very probably is unstable in the Franck-Condon region. The dissociation of NH3 +
at the expense of the same state has been observed for NH+ and H+ but not for NH2
+
. The latter ion would be formed, but spontaneously dissociates through reaction (c).
In the high electron energy range only one onset is measured for H2 +
(D2 +
) at 35.7 ± 0.4 eV. This threshold is observed up to 3.4 eV translational energy (see vertical line (3) in fig. 12). In this energy range double ionization of NH3 occurs [10] as well as dissociation of doubly ionized states [1,26]. In this case the two
singly ionized species will have the same appearance energy and will share the same total translational energy.
Energetically the lowest dissociation process leading to H2 +
from a doubly ionized state is
for which an onset is calculated at 32.8 eV by using the data listed in table 2.
For the NH+ ion, the threshold measured at 36.2 ±0.4 eV [1] agrees within experimental error with the onset measured for H2
+
. Furthermore, on NH+ a kinetic energy of 0.4 eV is observed, i.e. 0.4x17/2=3.4 eV total translational energy. For H2
+
a total kinetic energy of 3.4x17/15 = 3.85 eV is estimated. From both measurements the energy level of the dissociation limit is given by the energy difference 35.7(36.2)-3.85(3.4) =31.85(32.8) eV.
Taking into account the accuracy on the data, the fairly good correlation between the measurements on NH+ and H2
+
as well as the closeness of calculated and experimentally derived dissociation limits allow us to ascribe the abovementioned dissociation mechanism to the appearance energy of H2
+
at 35.7 eV. However, no conclusion can be drawn whether the NH32+ state involved is a 1A1 or a 3E state.
5. Conclusion
The dissociative ionization of NH3 in both the H +
and H2 +
dissociation channels has been investigated by recording the translational energy distribution of both species at different electron energies and by measuring their appearance energies at increasing retarding potential. The simultaneous examination of D+ and D2
+
formation from ND3 has proved to be helpful in the discussion of the experimental results.
At the lowest onset, only H+ is directly produced by dissociative ionization of NH3, very likely through
the NH3 +
(Ã2E) state. Vibronic energy of NH2 has to be involved in this process. This is confirmed by an isotope
effect due to ND2 on the slope of the kinetic ' energy versus appearance energy diagram. The H2 +
ion is produced by direct ionization of H2 formed by thermolysis of NH3 on the electron emitting cathode.
In the energy range 20-26 eV, both species are produced by dissociative autoionization at about 22.5 eV and direct dissociative ionization at 26 eV. However, some evidences are brought to show that a part of the H+
ion current, formed at 22.6 eV, is produced by the spontaneous dissociation of NH2+. The same mechanism is
invoked for a part of the H2 +
ion current observed at 26.2 eV. The H+ ions appearing at this latter energy could be produced by dissociative ionization of H2.
In the high electron energy range of 35-50 eV, mainly direct dissociation of doubly ionized states of NH3 is involved. Most of the processes invoked to account for the experimental data have already been discussed
for the appearance of NH2 +
and NH+ from NH3 in a previous work [1]. Though a double ionization energy of
NH3 was measured at 39.5 eV and an H +
formation threshold at about the same energy, very likely a dissociation of a highly excited, singly ionized NH3 state is involved.
Acknowledgement
We acknowledge the Fonds de la Recherche Fondamentale Collective (FRFC), the Université de Liège and the Action de Recherches Concertées (ARC) of the Belgian Government for financial support. One of us (ML) wishes to thank the Belgian Government for a PREST grant.
References
[1] R. Locht, Ch. Servais, M. Ligot, F. Derwa and J. Momigny, Chem. Phys. 123 (1988) 443. [2] M.M. Mann, A. Hustrulid and J.T. Tate, Phys. Rev. 58 (1940) 340.
[3] T.D. Mark, F. Egger and M. Cheret, J. Chem. Phys. 67 (1977) 3795. [4] G.R. Wight, M.J. van der Wiel and C.E. Brion, J. Phys. B 10 (1977) 1863.
[ 5 ] C.E. Brion, A. Hamnett, G.R. Wight and M.J. van der Wiel, J. Electron Spectry. 12 (1977) 323. [6] B.L. Carnahan, W.W. Kao and E.C. Zipf, J. Chem. Phys. 74 (1981) 5149.
[7] J. Kurawaki and T. Ogawa, Chem. Phys. 86 (1984) 295.
[8] K.C. Smyth, J.A. Schiavone and R.S. Freund, J. Chem. Phys. 59 (1973) 5225. [9] R. Locht, J.L. Olivier and J. Momigny, Chem. Phys. 43 (1979) 425; 49 (1980) 173. [10] R. Locht and J. Momigny, Chem. Phys. Letters 138 (1987) 391.
[11] R. Locht and J. Schopman, Intern. J. Mass Spectrom. Ion Phys. 15 (1974) 361.
[12] Ch. Servais, R. Locht and J. Momigny, Intern. J. Mass Spectrom. Ion Processes 71 (1986) 179. [13] K. Köllman, J. Phys. B 11 (1978) 339.
[14] B. de B. Darwent, Bond dissociation energies in simple molecules, NSRDS NBS 31 (1970).
[15] G. Herzberg, Molecular spectra and molecular structure, Vol. 1. Spectra of diatomic molecules (Van Nostrand, Princeton, 1950). [16] S.J. Dunlavey, J.M. Dyke, N. Jonathan and A. Morris, Mol. Phys. 39 (1980) 1121.
[17] C.E. Moore, Atomic energy levels, Vol. 1, NBS Circ. 467 (1949).
[18] G. Herzberg, Molecular spectra and molecular structure, Vol. 3. Electronic spectra and electronic structure of polyatomic molecules (Van Nostrand, Princeton, 1967).
[19] K.P. Huber and G. Herzberg, Molecular spectra and molecular structure, Vol. 4. Constants of diatomic molecules (Van Nostrand, Princeton, 1979).
[20] R. Colin and A.E. Douglas, Can. J. Phys. 46 (1968) 61.
[21] C. Krier, M.Th. Praet and J.C. Lorquet, J. Chem. Phys. 82 (1985) 4073.
[23] G. Herzberg, Molecular spectra and molecular structure, Vol. 2. Infrared and Raman spectra of polyatomic molecules (Van Nostrand, Princeton, 1945).
[24] N. Böse and W. Sroka, Z. Naturforsch. 26a ( 1971 ) 1491.
[25] G. Bieri, L. Åsbrink and W. von Niessen, J. Electron Spec-try. 27 (1982) 129. [26] D. Winkoun and G. Dujardin, Z. Physik D 4 (1986) 57.