Droplet size spectra and drift effect of two phenmedipham
formulations and four adjuvants mixtures
C. Stainier
a, M-F. Destain
a, B. Schiffers
b, F. Lebeau
aGembloux Agricultural University, aUnité de Mécanique et Construction, bLaboratoire de phytopharmacie,
Passage des Déportés 2, B-5030 Gembloux, Belgium
Tel: 32(0)81.62.21.60 fax: 32.(0)81.62.21.67. E-mail: stainier.c@fsagx.ac.be
Abstract
The effect of 4 adjuvants on two formulations of phenmedipham (EC and SC) applied with three types of hydraulic nozzles (hollow cone, flat fan and air induction) was evaluated using a wind tunnel to determine spray drift potential (DP). The volume median diameter (VMD) and the percentage by volume of droplets less than 100µm diameter was determined using a Malvern Particle Size Analyser. In a wind tunnel DP was measured between 2 and 6m downwind of the nozzle on glass fibre collectors using a fluorescent tracer. The EC formulation produced a smaller VMD and larger DP than the SC formulation irrespective of any effect due to adjuvants. DP increased as the proportion of small droplets increased.
Keywords: drift; formulation; nozzle; droplet size; pesticides; adjuvant
Introduction
Spray drift has become an important aspect of the registration process for pesticides because of potential effects on human health and the environment. Different techniques have been used to study spray drift, but field experiments, although covering aspects such as the impact of wind speed and air turbulence, are time consuming and expensive. The number of
variables involved in field studies makes interpretation difficult, so wind tunnel studies have been advocated (Parkin and Wheeler, 1996; Walklate et al., 2000; Murphy et al., 2000) to characterise the effect of operating parameters on the risk of spray drift under controlled conditions. Irrespective of the technique used drift increases with ‘fine’ sprays. The droplet size spectrum for a given pressure depends on nozzle design, physical properties of the spray liquid and any interaction between these factors. Cone, flat fan and air induction nozzles all produce a wide spectrum of droplet sizes (Matthews, 2000), although the proportion of small droplets will vary. Using a classification of spray quality (e.g. BCPC and ASAE S572) nozzles can be selected, but all the data was obtained using water plus surfactant or water alone. The physical properties of the spray liquid can interact with nozzle design and affect spray quality (Butler Ellis and Tuck, 1999; Butler Ellis et al., 2001; Stainier et al., 2004). The mode by which the liquid sheet breaks up changes due to factors, such as dynamic surface tension. Development of a complete model predicting droplet size and thus potential drift remains difficult and complex, because of the many parameters involved. Thus there is a need for quantification of potential drift (DP) by direct measurements in a wind tunnel. Spraying emulsifiable concentrate (EC) and oil in water emulsions (EW) formulations results in perforated sheet formation (Miller and Butler Ellis, 2000) that generates a coarser spray than water soluble formulations. It has been hypothesised that heterogeneous formulations may affect spray drift whether the heterogeneity is due to the presence of solid particles (suspension concentrate formulation SC) or from micro-hydrophobic globules (emulsifiable concentrate formulation EC). In this study, the potential drift of two formulations of the herbicide phenmedipham were used with different adjuvants and sprayed with three different types of hydraulic nozzle.
Water alone, an emulsifiable concentrate (Betanal EC) and a suspension concentrate (Kemifam SC) (Bayer Crop Science, Monheim am Rhein, Germany) with 4 different adjuvants to provide 15 spray mixtures (Table 1). The adjuvants were an esterified vegetable oil (Actirob B), two organosilicone surfactants (Silwet L-77 and Break thru) and a non-ionic surfactant (Tensiofix D03). The three hydraulic nozzles used had a nominal flow rate of 0.8l/min at 3 bar (Table2).
Droplet size spectra were measured perpendicular to the spray distribution main axis using a Malvern Particle Size Analyser (long bench MasterSizer S) with range of 4.2 – 3500µm. The average of data from 3 locations (Fig 1) across the swath were used to calculate volume median diameter (VMD) and the percentage of the spray by volume containing droplets below 100µm (%<100µm).
An aerodynamic wind tunnel at Gembloux Agricultural University, Belgium constructed according to ISO/DIS 22856-1 was used to determine drift from 16 spray liquids through the three nozzles. The test section of the wind tunnel was 2m wide x 2m high x 6m long with a honeycomb and porous fabric to produce the required air turbulence intensity and uniform velocity (5m/s). The nozzle was moved horizontally in the wind tunnel using a computer controlled servo-motor at 2m/s, perpendicular to the airflow. 10 passages of the nozzle across the working section were used to increase spray deposits. Three replicates were used. Spray drift deposited on 25mm x 100mm glass fibre collectors (PG5 ProGold, Uithoorn, Netherland) was measured using a tracer, fluorescein sodium salt (Sigma –Aldrich). Deposits were measured every metre from 2m to 6m downwind from the nozzle so there were 5 sampling positions (Fig 2) to determine amount of spray deposit per unit area. Four fibre glass collectors were fixed to a tile at each sampling point to avoid contamination due to any tracer
residue on the tunnel floor. The samplers were collected directly after spraying and stored in 50ml plastic tubes in darkness. The tracer was extracted by washing for 5 minutes in di-potassium phosphate buffer solution (K2HPO4, pH9) and quantified with a LS-50b Perkin-Elmer Fluorimeter with a 490nm primary and 510nm secondary filters. Deposit data was averaged for statistical analysis. The proportion of spray that drifted DP was calculated as the integer of the drift curve (Fig 3) using the formula:
q d d d d d D v DP m m m m m ) 2 2 ( 100 6 5 4 3 2 + + + + × × × =
with : DP: Drifted Part between 2 and 6m (%)
dim : Spray drift deposit on collector located i meters downwind from the nozzle (ml/m²)
v : nozzle speed across the tunnel (m/s) D : distance between two collectors (m) q : nozzle output (ml/s)
Statistical analysis, based on three parameters (VMD, % < 100µm, DP), was realised for 3 factors combinations (nozzle, formulations, tank-mixed adjuvant). ANOVA statistical tests were used to underline and rank the interactions between the 3 factors independently on each parameter. For each nozzle, a Newman and Keuls’s statistical test (Dagnelie, 1998, pp.376-379) was used (α = 0.05) within each formulation group to establish the existence of similar behaviour for the different adjuvants. As this statistical test makes a distinction between the variability induced by the three factors, it can eventually highlight a small but significant difference for a factor inducing a smaller variation than the other ones.
The average VMD values were 154µm, 197µm and 473µm and the percentage of droplets less than 100µm by volume 29, 17 and 2 for the cone, flat fan and air induction nozzles respectively (Table 3). Compared to water alone, the VMD was increased by 68%, 78% and 12%, when using the SC formulation for hollow cone, flat fan and air induction nozzles. Similarly the EC formulation increased the VMD 32% and 37% for the hollow cone and flat fan respectively, but there was no significant change with the air induction nozzle. With the increase in VMD using hollow cone and fan nozzles there was a corresponding decrease in the percentage by volume of droplets less than 100µm diameter.
Compared to a water alone spray, each tank mix adjuvant affected the VMD with Actirob or Silwet giving a coarser spray, while Tensiofix and Break thru reduced the VMD. However when the herbicide SC formulation was present, the VMD was reduced by adding the adjuvants compared to the SC alone, although the only significant difference was observed with the SC and Tensiofix mixture sprayed with a flat fan nozzle. When compared with water alone sprays, the addition of Tensiofix and Break thru to the SC spray increased the VMD. Silwet added to water sprayed with a flat fan nozzle increased the VMD compared to a water spray but when added to the SC formulation, the opposite occurred, when compared with the SC in water.
The Newman & Keuls classification between adjuvants for each formulation and nozzle combination (Table 3) indicated significant differences in the volume of small droplets between adjuvants when mixed with water alone. However, when mixed with SC or EC formulations, the only detectable effect on percentage of small droplets was when tensiofix was mixed with the SC formulation.
The horizontal drift profile for water, SC and EC formulation without adjuvants sprayed through the three nozzles (Fig. 4) showed that mean drift (DP) was 23% higher with the hollow cone nozzle than with the flat fan. The least drift was with the air induction nozzle, which reduced DP by 83% compared with the flat fan nozzle. In comparison with water sprays, there was less drift with the SC but more with the EC formulation, using either the hollow cone or flat fan nozzles (table 4). The EC formulation also had more drift with the AI nozzle although overall the amount was far lower than with either the hollow cone or flat fan nozzle.
Discussion
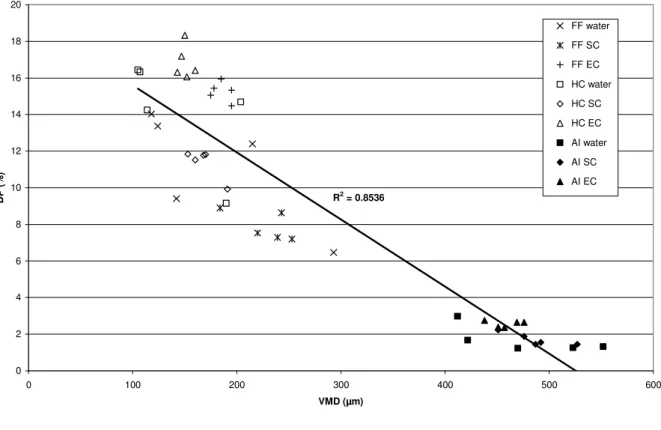
This study aimed to ascertain whether changes in the homogeneity of the spray liquid due to formulation type or by adding adjuvants affected spray formation and drift potential. Earlier work by Butler Ellis and Bradley (2002) with a blank 0.5% EC spray in water had shown a reduction in airborne drift 2 m downwind of spraying through a hollow cone nozzle in a 4m/s wind. In this study EC sprays increased DP, while particulate SC sprays achieved decreased drift. The effect of adjuvants was only discernible when they were mixed with water, rather than a formulated pesticide. The presence of solvents in an EC formulation is a factor that influences the amount of drift depending on the volatility and specific gravity of the spray. Isophorone, was a component of the EC formulation. While not as volatile as some solvents, it may have had an effect on the physical state of the active ingredient in the spray. Compared to the studies by Butler Ellis and Bradley (2002) differences in the sampling system and air velocity might account for some of the differences in results reported in this paper. Nevertheless the results show that despite the reservations on measuring the volume of liquid in small droplets produced by AI nozzles expressed by Butler Ellis and Bradley (2002), there is clear confirmation that drift is primarily affected by droplet size (fig 5), with
the volume of small droplets in a spray being dictated by choice of nozzle and, although not considered here, the operating pressure at the nozzle. Particulates suspended in the spray liquid affect break up of the sheet and on average reduce drift, although not to the same extant as choosing a ‘low-drift’ nozzle. Collection of DP data from wind tunnel studies provides regulatory authorities with a standardised procedure that allows easier comparison between pesticide products and nozzles recommended for applying them.
Acknowledgements
This work was carried out in the context of the drift research project D31-1099, funded by the Walloon Regional Ministry of Agriculture (Belgium). We thanks the Crop Protection Department of the Faculty of Agricultural and Applied Biological Sciences, Gent University (Flanders, Belgium), which brought a significant contribution to the droplet size measurements.
References
Butler Ellis M.C., Bradley (2002). The influence of formulation on spray drift. Aspect of Applied Biology 66, International advances in pesticide application, 257 – 259.
Butler Ellis M.C., Tuck C.R. (1999). How adjuvants influence spray formation with different hydraulic nozzles. Crop Protection 18, 101-109.
Butler Ellis M.C., Tuck C.R., Miller P.C.H. (2001). How surface tension of surfactant solutions influences the characteristics of sprays produced by hydraulic nozzles used for pesticides application. Colloids and Surfaces A: Physicochemical and Engineering Aspects 180, 267-276.
Dagnelie P. (1998), Statistique théorique et appliqué, tome 2 Inférence statistiques à une et à deux dimensions, De Boek & Larcier , Paris, Bruxelles.
ISO. (2005) ISO/DIS 22856-1 Equipment for crop protection – Laboratory measurement of spray drift – part 1 : Wind tunnels
Miller P.C.H., Butler Ellis M.C. (2000). Effects of formulation on spray nozzle performance for applications from ground-based sprayers. Crop Protection 19, 609-615.
Murphy S.D., Miller P.C.H., Parkin C.S. (2000). The effect of boom section and nozzle configuration on the risk of spray drift. J. agric. Engng Res. 75, 127-137.
Parkin C.S., Wheeler P.N. (1996). Influence of spray induced vortices on the movement of drops in wind tunnels. Journal of Agricultural Engineering Research 63, 35-44.
Stainier C, Lebeau F., Straet S., Phaleg V., Destain M-F., Schiffers B. (2004), Study by image analysis and laser-based droplet size distribution measurement of the influence of eight adjuvants on the spray formation for three agricultural spray nozzles, AFPP, colloque Mieux Traiter, 10-11 march, Orléans, France.
Walkate P.J., Miller P.C.H., Gilbert A.J. (2000). Drift classification of boom sprayers based on single nozzle measurements in a wind tunnel. Aspects of Applied Biology 57, Pesticide Application, 49-56.
Tables captions
Table 1. Spray liquids characteristics. Table 2. Spray nozzles characteristics.
Table 3. VMD measurements (µm), % < 100µm measurements (%) and statistical grouping for the 15 spray mixtures and the 3 nozzles, 3 bars.
Table 4. Drifted Part (D.P.) measurements (%) and statistical grouping for the 15 spray mixtures and the 3 nozzles, 3 bars, 50 cm height, 2 m/s boom speed and 5 m/s wind speed.
Tables
Table 1.
Spray mixtures
Water Kemifam SC Betanal
Water + Actirob B Kemifam SC + Actirob B Betanal + Actirob B Water + Tensiofix D03 Kemifam SC + Tensiofix D03 Betanal + Tensiofix D03 Water + Break-thru S-240 Kemifam SC + Break-thru S-240 Betanal + Break-thru S-240 Water + Silwet L-77 Kemifam SC + Silwet L-77 Betanal + Silwet L-77 Formulations: KEMIFAM SC (Suspension Concentrate of phenmedipham 160g/l) 4.45% w/v
BETANAL (Emulsifiable Concentrate of phenmedipham 154g/l) 4.45% w/v
Tank mix adjuvant: Actirob B (Esterified crop oil) 0.40% w/v
Tensiofix D03 (Non-ionic surfactant) 0.20% w/v
Break-thru S-240 (Organo-silicones surfactant (Trisiloxane)) 0.15% w/v
Table 2.
Nozzle type Specification Angle Flow rate (3bars) Model Manufacturer Flat-fan FF 120/0.8/3.0 110° 0.8 l/min LU 120-02 Lechler
Hollow cone HC80/0.78/3.0 80° 0.78 l/min TXD8002VK Spraying System Air induction AI 120/0.8/3.0 110° 0.8 l/min ID 120-02 Lechler
Table 3.
Flat-fan Hollow cone Air induction
VMD %<100µm Group 1 VMD %<100µm Group 4 VMD %<100µm Group 7
water (w) 142 32 1a 114 41 4a 470 2.7 7a
w + actirob B 293 4 1b 190 18 4b 552 1.5 7b
w + tensiofix D03 118 40 1a 107 45 4a 412 3.4 7a
w + break-thru S-240 124 38 1a 105 47 4a 422 2.1 7a
w + silwetL-77 215 10 1c 204 15 4b 523 0.8 7b
VMD %<100µm Group 2 VMD %<100µm Group 5 VMD %<100µm Group 8
SC 253 7 2a 191 20 5a 527 0.9 8a
SC+ actirob B 243 8 2a 168 25 5a 487 1.2 8a
SC + tensiofix D03 184 16 2b 153 28 5a 451 1.8 8a
SC + break-thru S-240 220 10 2a 170 24 5a 476 1 8a
SC + silwetL-77 239 9 2a 160 27 5a 492 0.9 8a
VMD %<100µm Group 3 VMD %<100µm Group 6 VMD %<100µm Group 9
EC 195 14 3a 150 30 6a 457 2 9a
EC+ actirob B 195 14 3a 160 27 6a 469 2.3 9a
EC + tensiofix D03 185 16 3a 143 32 6a 476 2 9a
EC + break-thru S-240 175 21 3a 152 30 6a 451 3.5 9a
Table 4
Flat-fan Hollow cone Air induction
DP Group 1 DP Group 4 DP Group 7
water (w) 9.40 1a 14.24 4a 1.23 7a
w + actirob B 6.47 1b 9.15 4b 1.32 7a
w + tensiofix D03 14.03 1c 16.32 4a 2.98 7b
w + break-thru S-240 13.37 1c 16.44 4a 1.67 7a
w + silwetL-77 12.40 1c 14.69 4a 1.26 7a
DP group 2 D.P. Group 5 DP Group 8
SC 7.20 2a 9.93 5a 1.44 8a
SC+ actirob B 8.63 2a 11.78 5a 1.45 8a
SC + tensiofix D03 8.90 2a 11.84 5a 2.23 8a
SC + break-thru S240 7.53 2a 11.81 5a 1.87 8a
SC + silwetL-77 7.29 2a 11.52 5a 1.55 8a
DP Group 3 DP Group 6 DP Group 9
EC 14.47 3a 18.33 6a 2.36 9a
EC+ actirob B 15.33 3a 16.41 6a 2.65 9a
EC + tensiofix D03 15.94 3a 16.31 6a 2.65 9a
EC + break-thru S-240 15.06 3a 16.06 6a 2.38 9a
Figure captions
Fig. 1. Malvern laser axis position through the spray fan for droplet size measurement Fig. 2. Wind-tunnel trial setup for drift measurements.
Fig. 3. Horizontal drift curve and Drifted Part, flat-fan nozzle, 3 bars, 50 cm height, 2 m/s boom speed and 5 m/s wind speed.
Fig. 4. Mean drift curve of water, SC formulation and EC formulation dispersed in water for (a) the flat-fan, (b) hollow cone and (c) air induction nozzles, 3 bars, 50 cm height, 2m/s boom speed and 5m/s wind speed.
Fig. 5. Relationship between VMD and Drifted Part (DP) for the different nozzle/spray mixtures groups.
Figures Figure 1 150mm 30mm 30mm Measurement axis (1 – 2 – 3) Spray fan Nozzle 1 2 3
Figure 2 2 m 1m 6m Spray nozzle orientation Wind direction (5m/s) Nozzle displacement axis (2m/s)
WIND TUNNEL TEST SECTION Ground collector
Figure 3 0,000 0,100 0,200 0,300 0,400 0,500 0,600 0 1 2 3 4 5 6 7
Distance from nozzle (m)
c o ll e c te d v o lu m e ( m l/ m ²) Collectedvolume
Nozzle flow rate : 0,8 l/min Nozzle speed : 2 m/s
Theoretical volume : 6,5 ml/m’
Figure 4 a, b, c 0,000 0,100 0,200 0,300 0,400 0,500 0,600 0,700 2 3 4 5 6
Distance from nozzle (m)
c o ll e c te d v o lu m e ( m l/ m ²) water SC EC 0,000 0,100 0,200 0,300 0,400 0,500 0,600 0,700 0,800 0,900 2 3 4 5 6
Distance from nozzle (m)
c o ll e c te d v o lu m e ( m l/ m ²) water SC EC 0,000 0,100 0,200 2 3 4 5 6
Distance from nozzle (m)
c o ll e c te d v o lu m e ( m l/ m ²) water SC EC Flat fan Hollow cone Air induction
Figure 5 R2 = 0.8536 0 2 4 6 8 10 12 14 16 18 20 0 100 200 300 400 500 600 VMD (µm) D P ( % ) FF water FF SC FF EC HC water HC SC HC EC AI water AI SC AI EC Série10