DIRECT MULTIPLE-POINT GEOSTATISTICAL SIMULATION OF EDGE PROPERTIES FOR MODELING THIN IRREGULARLY-SHAPED SURFACES
M. Huysmans1, A. Dassargues1,2
1 KULeuven, Earth and Environmental Sciences, Leuven, Belgium, [email protected], Tel: 0032 16 326449, Fax: 0032 16 322980
2 Université de Liège, Department of Architecture, Geology, Environment and Civil Engineering (ArGEnCo), Hydrogeology and Environmental Geology, Liège, Belgium
Thin irregularly-shaped surfaces such as clay drapes often have a major control on flow and transport in heterogeneous porous media. Clay drapes are often complex curvilinear 3-dimensional surfaces and display a very complex spatial distribution. Variogram-based stochastic approaches are often also not able to describe the spatial distribution of clay drapes since complex, curvilinear, continuous and interconnected structures cannot be characterized using only two-point statistics. Multiple-point geostatistics aims to overcome the limitations of the variogram. The premise of multiple-point geostatistics is to move beyond two-point correlations between variables and to obtain (cross) correlation moments at three or more locations at a time using "training images" to characterize the patterns of geological heterogeneity. Multiple-point geostatistics is able to reproduce thin irregularly-shaped surfaces such as clay drapes but is often computationally intensive. To capture the thin surfaces, a small grid cell size should be adopted for the training image. This results in large training images and a large search template size and thus a large CPU and RAM demand (Huysmans and Dassargues, 2009).
This paper describes and applies a methodology to simulate thin irregularly-shaped surfaces with a smaller CPU and RAM demand than the conventional multiple-point statistical methods. The proposed method is based on the idea proposed by Stright et al. (2006) of using edge properties for upscaled flow simulation without losing information about thin irregularly-shaped flow barriers. To preserve these important fine-scale features at the flow simulation block scale, Stright et al. (2006) introduces an additional modelling variable as the edge of a model cell. The edge of a model cell is a continuous or categorical value associated with the cell face. This idea is extended in this paper to not only use edge properties in the flow simulation step but also in multiple-point geostatistical facies simulation step. This work explores the idea of directly simulating edge properties instead of pixel properties to make it possible to perform multiple-point geostatistical simulations with a larger cell size and thus a smaller computation time and memory demand. The proposed methodology of directly simulating edge properties is explained by applying it to a small and simple training image. Next, the method is applied to simulation of clay drapes in a real cross-bedded aquifer in Belgium.
The method starts from a training image depicting the thin irregularly-shaped surfaces of interest. The grid scale of this training image should be fine enough so that the thin surfaces can be depicted using pixels. Fig 1a shows a simple training image to illustrate the method. It shows sand bodies separated by a few horizontal and inclined clay drapes.
Second, the training image is indexed. Each large scale facies body is indexed individually, from 1 to the number of facies bodies, so that the thin irregularly-shaped surfaces of interest separate the individual facies bodies. In our example, each sand body is given a number from one to eight (Fig 1b). Third, a model grid size for simulation is chosen. This grid should be chosen so that it allows flow simulation within a reasonable computation time and so that it preserves the flow behaviour and connectivity of the relevant structures of the fine scale training image. This coarser grid is superimposed over the training image and grid nodes are placed at the center of each grid cell (Fig 1b). In the fourth step of the method, the grid is searched in the x, y and z-direction for the presence of clay drapes between grid nodes of the coarser grid (Stright et al., 2006). If the index value of the two nodes differs, then the edge between the two nodes is flagged as “1”, indicating that a clay drape is present. Otherwise the edge between the two nodes is flagged as “0”, indicating that no clay drape is present (Fig 1c). After this process, the edge properties can be represented by two matrices (or three 3D matrices in 3D) with the same size as the coarse grid: matrix B displaying the edge properties at the bottom of a grid cell (Fig 1d) and matrix R displaying the edge properties at the right side of a grid cell (Fig 1e). The edge properties at the top and left side of a cell are not stored since they can be obtained from the edge properties at the bottom and right side of neighbouring cells. In the fifth step of the method, matrices B and R are combined into one matrix E by applying the coding shown in Table 1 describing the four different possibilities for each cell. This allows obtaining a single training image displaying all edge properties. If, for example, a cell displays no flow barrier, this cell is
coded “0”. If, for example, a cell displays a flow barrier at the right and not at the bottom, this cell is coded “1”. The E-coded training image of our simple example is shown in Figure 1f. The E-coded training image can now be used as input training image to perform SNESIM simulations with 4 categories, i.e. the four possible outcomes for E. This E-coded training image (Fig 1f) is much coarser than the original training image depicting thin irregularly-shaped surfaces of interest using pixels (Fig 1a), while still preserving all relevant information about the presence of the clay drapes.
Table 1 Definition of E-coding
B R E
0 0 0
0 1 1
1 0 2
1 1 3
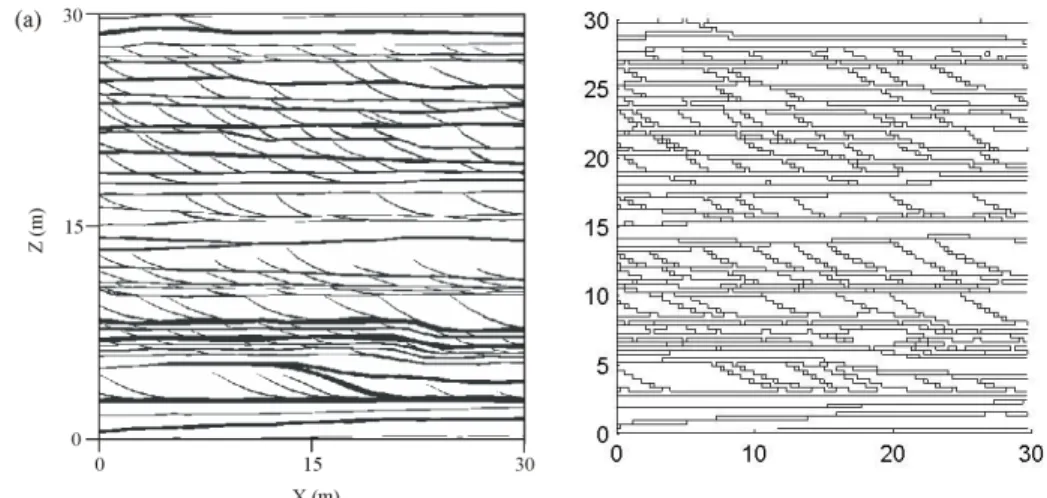
The proposed method is also applied to the cross-bedded Brussels Sands aquifer in Belgium. The small grid cell size training image (Fig. 2a) is converted into an edge training image with a larger grid cell size (Figure 2b). This edge training image is used as training image to perform SNESIM simulations with 4 categories. In this case, direct SNESIM simulation of edge properties is 60 times faster than ordinary SNESIM simulation of facies.
Figure 2 (a) Vertical 2D training image of 30 m x 30 m in N40°E direction (white = sand facies, black = clay-rich facies) (adapted from Huysmans and Dassargues, 2009); (b) Edge training
image
Huysmans M. and Dassargues A., 2009, Application of multiple-point geostatistics on modeling groundwater flow and transport in a cross-bedded aquifer, Hydrogeology Journal 17(8), 1901-1911
Stright, L. , Caers, J. and Li, H. (2006) Coupled geological modeling and history matching of fine-scale curvilinear flow barriers, 19th SCRF annual meeting, Stanford Center for Reservoir Forecasting, Stanford, May, 2006.