Alain Jousten, Mathieu Lefebvre and Sergio Perelman
Disability in Belgium
There is More than Meets the Eye
Disability in Belgium: there is more than meets the eye Alain Jousten, Mathieu Lefebvre, and Sergio Perelman1
September 2010
First draft
Abstract
The paper provides a perspective on the development of the Belgian disability insurance system. Using both survey and administrative data, it sketches a picture of the (changing) factors leading towards disability, as well as the outcomes in terms of program participation. The paper shows the key role of integrating other forms of early retirement programs into the analysis. The main findings are an unspectacular trend in the number of DI beneficiaries over time combined with a strong expansion of (early-) retirement schemes.
JEL Classification Numbers: H55, J21, J26, J14
Keywords: pensions, social security, disability, handicapped, early retirement, unemployment, labor force participation
1
The authors (Alain Jousten, Université de Liège, IZA, and Netspar ; M. Lefebvre and S. Perelman, Université de Liège) wish to thank Michael Turco (CIMIRE), Lut Vanden Meersch (INAMI-RIZIV) and Khiêm Nguyen (ONEM-RVA). Financial support from the “Communauté Française de Belgique” ARC contract (ARC
05/10-332) is gratefully acknowledged. All errors are our own. Corresponding author: ajousten@ulg.ac.be
I. INTRODUCTION
The economic literature has produced a wide body of research on the determinants of labor supply at older ages. It suggests that the generous early retirement routes opened up within the setting of various social protection systems are largely responsible for the low participation of elderly. There is no doubt that the strongest factors driving early retirement are the financial
incentives provided by social security systems2 but health issues might be of importance as well3.
Specifically, disability insurance (DI) is a key component of the social security system in most advanced countries. Belgium is no exception to this role with the public DI system protecting workers in case of longer-term loss of work capacity. However few studies on Belgium have focused on DI as one of several systems allowing elderly to leave the labor force.
As compared to the substantially larger health and retirement programs, disability insurance has only attracted a limited interest in the Belgian public policy debate. According to Eurostat, spending on DI accounted for only 1.8% of GDP in 2007. Two key factors are at play.
On the one hand, while there is no doubt that poor health is a key determinant of inactivity, the multiplicity of exit routes available to older workers in Belgium makes it difficult to clearly identify the relationship between health condition and DI participation, and hence also the influence of DI on retirement decisions. On the other hand, poor health may also affect a worker’s productivity and hence affect his risk of job loss. In both cases, there exist various schemes that allow the workers to withdraw from the labor market.
In light of these issues, we focus on two specific questions in this paper. First, we evaluate whether there is a systematic link between indicators of population health – both objective and subjective – and program participation. We research whether the improvement observed in health status and mortality in the last decades is associated with a reduction of programs participation – with a special focus on the DI program. We would expect such a link to prevail, though causality of this link could obviously run both ways.
Second, we describe the role of the DI system in the wider social security system. Previous work on retirement incentives has clearly illustrated the need to take a comprehensive approach when looking at the behavioral consequences of social protection systems – particularly in a context of reform over time (see Dellis et al, 2003 and Desmet et al, 2005). Indeed Belgium excels in the use of a variety of early retirement programs, if the average age of retirement was about 61.4 in 2007, it was 57 in 2000.
The paper is structured as follows. Section 2 describes the institutional landscape of the Belgian social insurance and assistance schemes. We provide a description of the changes to the different early retirement schemes over time – with an emphasis on those relevant in the disability context. Section 3 provides an overview of historical data on health trends. Relying both on administrative and survey data, we show the link between health status and mortality trends, on the one side, and labor market and disability participation, on the other. Section 4 analyzes program participation, with a special emphasis on the link between behavioral trends and changes in the program design. This is of prime importance since the coexistence of several schemes raises a problem of
2
See Pestieau and Stijns (1999), Dellis et al. (2003) and Desmet et al. (2005).
3
communicating vessels wherein a change in the rules of one scheme may have a direct impact on the participation to another scheme. Section 5 concludes the paper.
II. INSTITUTIONAL BACKGROUND
The aim of this section is to describe the most important social protection schemes that can serve as a source of replacement income when retiring from the labor market within a disability
context. As in previous work on retirement incentives and labor market outcomes (see Jousten et
al 2005, 2010), for reasons of data availability our focus will be the wage-earner scheme.4
Table 1: List of exit routes
DI Disability insurance system
UI Unemployment insurance system
CER Conventional early retirement system
SER Special early retirement system
RPP Retirement prepension system
OAU Old-age unemployment system
A. Disability insurance
The DI system is the main program targeted at people withdrawing from the labor market for disability reasons. To be eligible for the benefit, the worker has to satisfy a series of conditions. First, there is a condition in terms of the loss of earnings capacity in the usual job. In order to be eligible, the worker has to suffer from a loss of earnings capacity of 66% over a period of at least 12 months – as certified by the national DI administration (INAMI-RIZIV). Continued benefit eligibility is validated using periodic medical and administrative controls.
Beyond this loss of earnings-capacity requirement, workers also have to satisfy minimum contributory requirements to qualify for benefits. The coverage under the system prior to the onset of the disability has to be assured for at least two quarters, combined with at least 120 days of actual or assimilated work (or 400 hours for part-time workers) before the covered event occurs. The system is financed on a pure pay-as-you-go (PAYG) basis.
Benefits are payable up to a maximum age of 65 – corresponding to the normal retirement age. At this age, people become eligible for regular retirement benefits and are automatically transferred into the retirement system. In line with other social insurance replacement income programs, such as unemployment (UI), health insurance (HI) and conventional early retirement (CER), periods of benefit receipt fully count towards the buildup of pensions – though no
contributions are due. Periods on DI are fully assimilated to work in pension records, with fictive (indexed) wages being imputed into the earnings history at a level corresponding to real earnings in the year prior to disability onset (see below).
4
The wage earner social insurance system is by the far the largest one in terms of enrollment terms, also representing the largest share of public spending on social security. It is less generous than the scheme for civil-servants and more generous than the one for the self-employed.
The benefit level is a function of the household status of the worker and is paid out free of income taxes. The benefit is equal to 65% of reference earnings if the insured has dependents; 40% if the insured cohabits but has no dependents; 53% if the insured lives alone. Reference earnings are based on real observed earnings in the period leading up to the onset of the insured event. A cap on benefits applies for higher levels of income. Benefits are adjusted periodically for changes in the consumer prices using the so-called “health-index” – a slowed-down version of the consumer price index serving as a basis of indexation notably for rents and social benefits. In the 12 months leading up to the benefit eligibility, workers suffering from a loss of work capacity are not left without income. During this so-called “primary incapacity”, people are covered under the rules of the HI – with slightly different eligibility rules that are administered in a decentralized way by the various mutual health insurance organizations. During the first month of incapacity, the benefit is equal to 60% of the reference income. Over the next 11 months, the benefit is equal to 60% if the insured has dependents or lives alone and 55% if he cohabits. When the DI system was introduced in 1963 the benefit was equivalent to 60% of reference earnings if the insured has dependents and 33% otherwise. These replacement rates were adjusted along time. In 1986, a differentiation between individuals living alone and cohabitants was introduced and replacement rates adjusted to 65% for insured with dependents, 40% if cohabiting with no dependents and 45% if the disabled person lives alone. In 2002, the replacement rate of the disabled living alone was further increased to 50%; before finally reaching current levels in 2004.
Aside from changes in the replacement rates, an important reform occurred in 1998 significantly enlarging the notion of “dependents” – by including the members of the spouse’s family. The aim was to align the definition with the one used in the unemployment rules in order to make systems more coherent.
B. Pension system
The wage-earner pension system is the main program covering the elderly. The program is financed by tax-deductible employer and employee contributions, as well as by transfers from the federal budget. The system runs on a pure PAYG basis.
Individuals are eligible to full benefits at the age of 65, with early retirement possible at age 60 for both women and men. A full career corresponds to 45 years of earnings or assimilated periods. Assimilated periods correspond to periods on DI, UI, HI, ER as well as various other arrangements such as career breaks, and some other forms of leave. No actuarial adjustment is applied for early retirement beyond the effect possibly playing through the incompleteness of the earnings history.
Social security benefits correspond to 75% of average lifetime earnings for one-earner couples and to 60% for others. Benefits have a preferential tax treatment and are regularly indexed using the health index, as well as occasionally up-rated on a purely discretionary basis to prevent a severe decoupling of benefits from average wages in the economy. Special regimes also remain in place for some specific sectors, such as most notably for coal mining and the maritime sector. Survivor benefits are available since 1968.
Originally, the basis for the current-day system was laid in two separate steps for blue and white-collar employees in 1953 and 1957. Since its creation, the system has undergone a series of major
changes. In 1967, the systems were merged and key changes introduced. Male retirement age was set at 65 and female retirement at 60, with corresponding full-career lengths of 45 and 40 years – combined with a possibility to retire early by 5 years with a 5% reduction per year of
anticipation.
A reform of 1977 can be seen as the first step towards an active policy of shifting people into inactive early retirement program – even though this specific program was only short-lived and
phased-out in 1979 and 1982.5 The reform allows for early retirement within the above general
pension system without financial penalties. The so-called “special early retirement” (SER) give disabled workers or long term unemployed aged of at least 60 for men and of 55 for women a bonus equal to the difference between the actual pension and the one they would receive if it was not reduced by the « 5 percent rule ».
The ensuing 1983 creates a new (and longer-lived) scheme of early retirement within the framework of the wage-earner pension system. The program of “retirement prepension” (RPP) allows male workers to retire a maximum of 5 years early without any benefit reduction if the employer commits to replacing the worker by an unemployed who is benefiting from a full-time compensation from the unemployment insurance. The system only ended in 1991 with the formal end of a normal retirement age.
In 1991, a major reform of the system modifies the landscape in retirement ages. While female early retirement before the age of 60 was already eliminated in 1987, the 1991 reform generalized the concept of a window of retirement ages: subject to career requirements, workers of both sexes are free to choose the retirement age between 60 and 65. The normal retirement ages for women and men do however remain different at ages 60 and 65. The 5% rule, as well as the RPP both lose their rationale and are eliminated.
It is however only in 1997 that the Belgian government, forced by a European court of justice ruling, harmonized the normal retirement age and the career-length requirements for women and men. The decision was taken to align the female full career condition to the one applicable to men. Since 1997, the normal retirement age for women has gradually been raised to 61 in 1997, 62 in 2000, 63 in 2003, 64 in 2006 and finally attained the now steady-steady of 65 in 2009, with the corresponding increases in full-career requirements. While aimed at eliminating
discrimination, the measure has also a clearly beneficial impact in budgetary terms and contributes positively to the longer term viability of the regime.
The most recent reform to retirement incentives under the pension system dates back to 2007.
Under the so-called “Intergenerational Solidarity Pact” (ISP)6 negotiated between the social
partners and the government in late 2005, workers working beyond the age of 62 or beyond 44 years of career can benefit from a pension supplement. The pension bonus of an amount of 2 € per day worked beyond these limits, augments the annual benefit payable, and this independently
5
The program was the first of a series of programs put in place to shift older workers out of the labor market to free up jobs for younger workers. Jousten et al (2010) discusses these “lump-of- labor” issues in more detail.
6
The Belgian Intergenerational Solidarity Pact includes some 30 measures aimed at reducing early retirement without changing the legal retirement age or current benefits already granted. Measures include limiting the number of people taking early retirement, stimulating employers to retain or hire older workers as well as making early retirement less attractive for both workers and employers.
of the wage earned or the contributions accumulated. As such, it can be seen as a much stronger relative incentive for lower-wage earners than for higher-wage earners.
C. Conventional early retirement
Next to the pension system, a parallel system of complementary benefits for early retirement is created in 1973 for the old workers in case of firing: the conventional early retirement (CER). In order to be eligible, the worker has to have been laid off by his employer and also satisfy some
career length requirements7. Benefits correspond to the ones payable under the unemployment
insurance system (see below) topped up by a complementary benefit paid by the employer – the latter being equal to half the difference between net wage and the unemployment benefit.
A particularity of the system is that these early retirees are exempted from job search and—as for all unemployed—the time spent in the early retirement program is fully credited in the earnings file for pension purposes.
At the outset, the system is only accessible if the employer recruits a replacement worker benefiting from full-time unemployment benefits as a replacement for the worker.
Further, the initial age of eligibility is set at 60. But both criteria are hollowed out over time by means of legislative change and collective bargaining agreements within industries. As a result, there ultimately exists a variety of different regimes with different career requirements, minimum ages, replacement of the worker, etc for different sectors and companies. Though legislation from 1986 as well as the ISP of 2005 tried to harmonize and put constraints onto this situation,
numerous exceptions persist with respect to the general rules. Even today, while workers below the age of 60 do in theory have to be replaced when they are put onto early retirement, this is not the case for companies that are considered in economic difficulty or in restructuring – with the age sometimes being as low as 50. The same applies if the company is closing or unable to find a suitable replacement, etc. Similarly, while the age of 58 is currently the statutory minimum access age, a lower age is possible in some sectors (steel, glass, textile, etc.) depending on more stringent career conditions and/or conditions on hardship of the job.
D. Unemployment and old-age unemployment
The last exit path out of the labor market works through the unemployment insurance system. Two alternatives exist, the specific old-age unemployment (OAU) system and the regular unemployment insurance system (UI).
Eligibility for the regular UI system is essentially based on having paid contributions during at least 12 months in paid employment, or assimilated periods in the last 18 months. The basic UI system is available to workers of all ages and pays out benefits of 60% of the last gross wage. Both the reference wage and the benefits have caps and floors. As a result, the replacement rate of the unemployment benefits was 30% of average gross wages in 2004 (Faniel, 2008). Benefits
7
Initially the minimum length was set to 25 years. It has been gradually increased to 30 years for men and 26 years for women. In 2012, it it set to increase to 35 and 28 years for men and women respectively.
are not subject to income tax and are not limited in time with payments ending upon reaching the normal retirement age of 65. At this age, the transit into the pension system follows rules similar to the DI system.
Under UI rules, individuals have to be available for the job market, and actively look for
employment. A specificity of the system is that benefits, as for the rest of social security, are paid out by a federal agency, while job placement is only in the hands of the various regional
authorities.
The OAU status was introduced back in 1985 into the Belgian social insurance landscape. In line with the previously discussed programs, its motivation was essentially one of freeing up space on the job market in a lump-of-labor logic (see Jousten et al, 2010). As compared to the regular UI system, several key factors of differentiation exist. First, the beneficiary of OAU benefits does not have to be actively looking for a job, nor does he have to be available for the labor market. Second, benefits are more generous than UI. In addition to the UI benefits, the old-age
unemployed receive a complement that is a function of age and family status.
To qualify for OAU, workers have to satisfy age and unemployment criteria. Initially, the system was limited to those people aged 55 and above who were unemployed for at least 2 years, as of 1996 the age was lowered to 50 and the UI duration to 1 year. In 2004, faced with the growing importance of these arrangements, the government progressively introduced changes to the legislation. New entrants currently have to satisfy more stringent conditions to benefit from the job search and availability waiver. Under the new rules, only workers aged 58 and above or with long careers still benefit from a full waiver, younger workers benefiting from an intermediate
system as compared to the basic UI system.8
In its most extreme version, the system has been used in what is known as « Canada Dry » retirement arrangements (Cremer et al, 2008), where employers separate from older workers by sweetening the firing with lump sum compensations/side payments—this way avoiding the more complicated and stringent severance pay.
III. HISTORICAL HEALTH TRENDS
After having reviewed the institutional setting, it is useful to review some indicators of out outcomes in terms of health and mortality. Figure 1 presents the general trend in terms of mortality for the population aged 55-65 in Belgium. While there has been some variation across sexes and age groups, the dominating trend is clearly a steep decrease in mortality, or expressed differently a steep increase in life expectancy. Though encouraging, it does however not mean that morbidity also decreased.
8
Starting 2002, the age at which people can claim the old-age unemployed status is increased to 58 with a transitory period in which it is first 56 then 57. To exit the labor market before these ages, the workers have to justify a career of 38 years.
Figure 1: Mortality rates for male (left) and female (right) 0 .0 1 .0 2 .0 3 .0 4 Mo rt a lit y ra te 1950 1960 1970 1980 1990 2000 2006 Year
Male age 55 Male age 60
Male age 65 0 .0 1 .0 2 .0 3 .0 4 Mo rtal it y r a te 1950 1960 1970 1980 1990 2000 2006 Year
Female age 55 Female age 60
Female age 65
Source: Human Mortality Database.
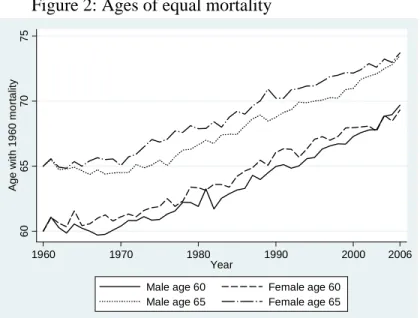
Two additional figures give a snapshot picture of the strong improvements in mortality. The first indicates the age at which members of the age 60 and 65 cohorts in the various calendar years will suffer from a mortality rate that their 1960 counterparts suffered when 60 and 65
respectively. The increasing trend displayed in figure 2 indicates a clear shift towards longer life expectancies as higher mortality rates occur much later in life, about 10 years from 1960 to 2006. Figure 2: Ages of equal mortality
60 65 70 75 Age w it h 19 6 0 m o rt a lit y 1960 1970 1980 1990 2000 2006 Year
Male age 60 Female age 60 Male age 65 Female age 65
Source: Human Mortality Database.
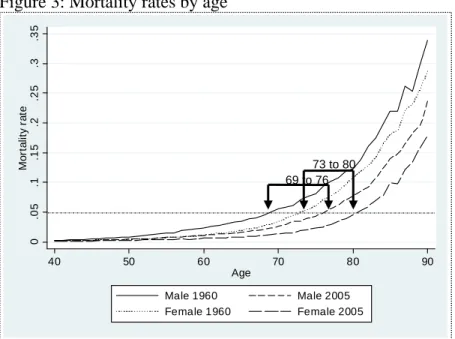
The second compares mortality rate for men and women in 1960 and 2005. Considering a 5% mortality rate, figure 3 shows that the age at which this rate is attained shifted from 69 to 76 for men and from 73 to 80 for women, a gain of 7 years in both cases.
Figure 3: Mortality rates by age
Source: Human Mortality Database
Beyond pure mortality indicators, we only have very limited health data available. The first one is the Eurobarometer – a cross-national survey carried out over a wide range of European countries. A question on subjective health has been asked periodically for the years 1987, 1989, 1990, 1993 and 2001. However a major drawback is that the question is not expressed in the same way and the scale of answers has also changed overtime. The second survey is the Belgian Health Interview Survey (HIS) that exists since 1997 and is conducted every four years. For the latter we only have access to data by 10 year age-cohorts.
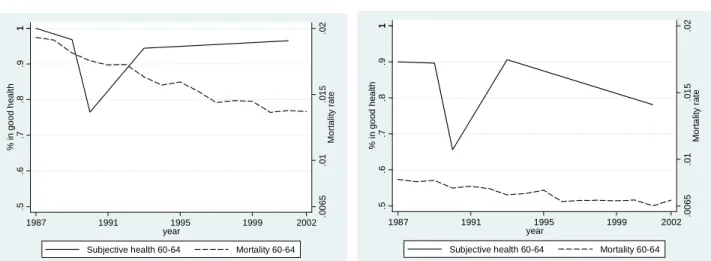
Looking first at the Eurobarometer data of figure 4 and comparing with the underlying mortality trends also plotted on the graphs, it is clear that this data has only a very limited use – if only because of the changing questions over the different waxes. While the mortality rates show a clear improvement along the period, the perceived health displays no clear pattern.
The HIS provides self-reported subjective and objective health measures. The advantage is that HIS allows to link mortality to morbidity. Figure 5 displays the percentage of people aged 55 to 64 who declare being in a bad health, those having functional limitations, those having chronic conditions and the average Body-Mass index in this population. It show that contrary to the drop in mortality also reported, health measures look rather flat – except may be for the subjective health measure that seems to display a slightly decreasing trend, especially for women.
Given the sparse information on direct health outcomes, we conclude that mortality is likely the only meaningful indicator of health improvements in Belgium. Also it is the only available indicator covering a rather long period and showing consistent estimation along time.
0 .0 5 .1 .1 5 .2 .2 5 .3 .3 5 Mo rt a lit y r a te 40 50 60 70 80 90 Age Male 1960 Male 2005 Female 1960 Female 2005 73 to 80 69 to 76
Figure 4: Good health (Eurobarometer) and mortality for male (left) and female (right) .0 06 5 .0 1 .0 1 5 .0 2 M o rt al it y r a te 1 .5 .6 .7 .8 .9 1 % i n go od h e a lt h 1987 1991 1995 1999 2002 year
Subjective health 60-64 Mortality 60-64
.0 0 6 5 .0 1 .0 15 .0 2 Mo rt a lit y r a te 1 .5 .6 .7 .8 .9 1 % i n go od h e a lt h 1987 1991 1995 1999 2002 year
Subjective health 60-64 Mortality 60-64
Source: Eurobarometer and Human Mortality Database
Note: The subjective health indicator gives the percentage of people who declare to be in fairly good, good or very good health.
Figure 5: Health measures (HIS) and mortality for male (left) and female (right)
.0 0 6 .0 1 .0 1 5 Mo rt a lit y rat e 20 25 30 35 40 45 % a n d av e rag e B M I 1997 2001 2004 2008 year
Subjective bad health 55-64 Chronic cond. 55-64 Functional limit. 55-64 BMI 55-64 Mortality 60-64 .0 0 6 .0 1 .0 1 5 Mo rt a lit y ra te 20 25 30 35 40 45 % a n d av e rag e B M I 1997 2001 2004 2008 year
Subjective bad health 55-64 Chronic cond. 55-64 Functional limit. 55-64 BMI 55-64 Mortality 60-64
Source: Belgian Health Interview Survey and Human Mortality Database
Note: The subjective health indicator gives the percentage of people who declare to be in bad or very bad health. The chronic condition indicator gives the percentage of people who declare to have one or more longstanding health condition. The functional limitation indicator gives the percentage of people who have functional limitations. The BMI index is the average Body Mass Index in the specific population.
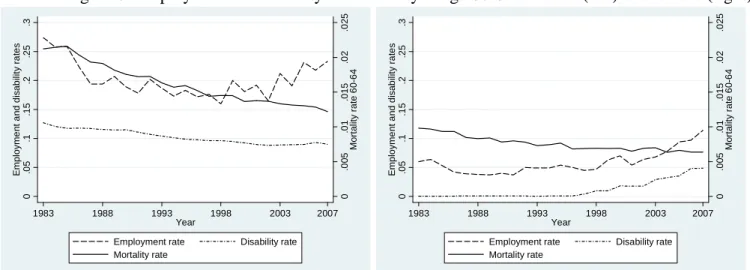
To get a sense of the importance of longevity changes on labor force participation we present cross-tabulations of two key labor force indicators against mortality. Implicitly, we want to verify whether changes in the average health and well-being of the population affect the labor market. In theory, if the DI system were to play its role as a protection against bad health both variables should be affected – particularly for workers close to the retirement age. Figure 6 plot the trends of mortality against the employment rate and DI receipt. The employment rate is derived using
the data from the Labor Force Survey that has been conducted since the early 1980’s, while the
DI rate is based on data from the federal DI administration.9
Figure 6: Employment vs. mortality vs. disability at age 60-64 for male (left) and female (right)
0 .0 0 5 .0 1 .0 1 5 .0 2 .0 2 5 Mo rt a lity ra te 6 0 -6 4 0 .0 5 .1 .1 5 .2 .2 5 .3 E m p lo y m e n t an d di s a bi lit y r a te s 1983 1988 1993 1998 2003 2007 Year
Employment rate Disability rate
Mortality rate 0 .0 0 5 .0 1 .0 1 5 .0 2 .0 2 5 Mo rt a lity ra te 6 0 -6 4 0 .0 5 .1 .1 5 .2 .2 5 .3 E m p lo y m e n t an d di s a bi lit y r a te s 1983 1988 1993 1998 2003 2007 Year
Employment rate Disability rate
Mortality rate
Source: Human Mortality Database, INAMI-RIZIV and Labor Force Survey.
For men, mortality has faced a steady decline over this 25 year period while the employment rates have started to edge upwards in since the end of the 1990’s – a trend more broadly observed all across the OECD. The same is true, though to a lesser extent, for DI in the second half of the first decade of the new millennium. For women, the upward trend in employment is much more sustained and can largely be explained by an increasing fraction of women joining the labor market and becoming eligible for benefits. Furthermore, the inexistence of DI recipiency until the late 1990’s and the steep increase thereof at the end of the observation period can be explained by the increase of the retirement age from a departure level of 60 – hence originally excluding all women above 60 from the benefits of the DI system.
One conclusion emerges: DI receipt and employment rates do not correlate well with mortality and/or health indicators.
IV. PATH WAYS TO RETIREMENT AND PROGRAM REFORM
This section extends the previous analysis and looks beyond the narrow concept of DI benefit receipt as an indicator of program participation. It also expands the focus beyond the age group 60-64 as similar effects on activity levels can also affect younger and older cohorts.
9
We rely on administrative data given that LFS data on disability are only available for the period starting in 1992 and are rather erratic.
A. Key Labor Market Indicators
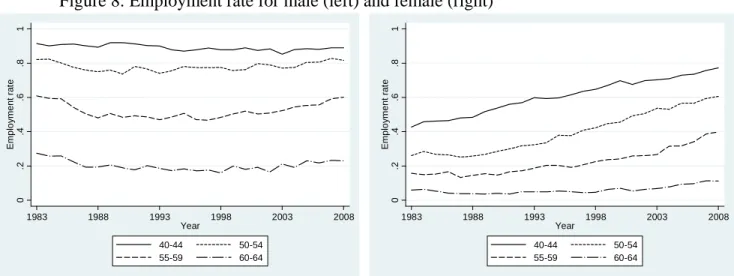
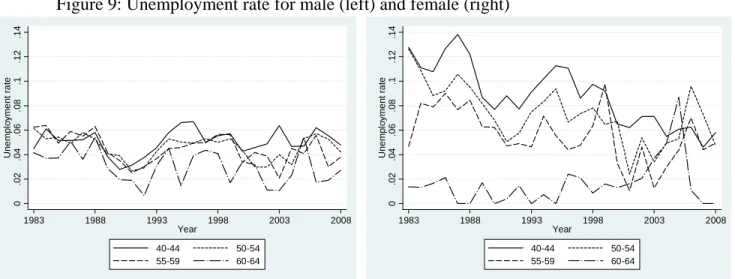
Figures 7, 8 and 9 give an overview of labor market outcomes over the period of time covered by the Labor Force Survey. These more extensive labor force data comfort the previous observations of long-term trends on the labor market, with male rates being relatively stable over the entire period of observation, while female employment and labor force participation strongly trend upwards. While unemployment rates vary considerably over the economic cycle, there is little impact on overall employment and labor force participation levels.
Figure 7: Labor force participation for male (left) and female (right)
0 .2 .4 .6 .8 1 La bo r F o rc e P a rt ic ip at io n 1983 1988 1993 1998 2003 2008 Year 40-44 50-54 55-59 60-64 0 .2 .4 .6 .8 1 La bo r F o rc e P a rt ic ip at io n 1983 1988 1993 1998 2003 2008 Year 40-44 50-54 55-59 60-64
Source: Labor Force Survey
Figure 8: Employment rate for male (left) and female (right)
0 .2 .4 .6 .8 1 E m pl oy m e n t r a te 1983 1988 1993 1998 2003 2008 Year 40-44 50-54 55-59 60-64 0 .2 .4 .6 .8 1 E m pl oy m e n t r a te 1983 1988 1993 1998 2003 2008 Year 40-44 50-54 55-59 60-64
Figure 9: Unemployment rate for male (left) and female (right) 0 .0 2 .0 4 .0 6 .0 8 .1 .1 2 .1 4 U n e m pl oy me n t r a te 1983 1988 1993 1998 2003 2008 Year 40-44 50-54 55-59 60-64 0 .0 2 .0 4 .0 6 .0 8 .1 .1 2 .1 4 U n e m pl oy me n t r a te 1983 1988 1993 1998 2003 2008 Year 40-44 50-54 55-59 60-64
Source: Labor Force Survey
Beyond these traditional sets of labor market indicators, we propose two additional measures. Figures 10 graph the same LFS employment data for the ages ranging from 50 to 70 in three different calendar years. It confirms the preceding observations.
Figure 10: Employment rate 5-year age bracket for male (left) and female (right)
0 .2 .4 .6 .8 E m pl oy m e nt r a te 50 55 60 65 70 Age 1983 1993 2006 0 .2 .4 .6 .8 E m pl oy m e nt r a te 50 55 60 65 70 Age 1983 1993 2006
Source: Labor Force Survey
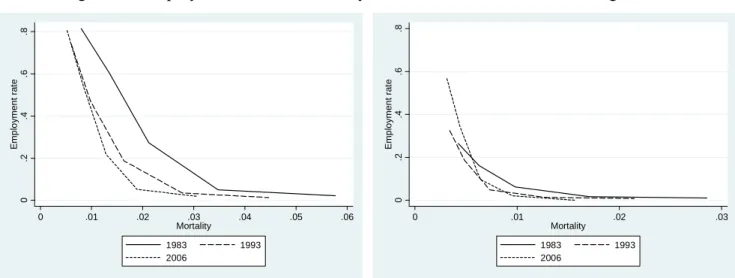
A final tabulation links the employment rate to mortality rates in different calendar years. Every point represents the position of a 5-year age bracket in the given year. The results of figures 11 show that employment rates at any given mortality rate have steadily dropped for men. The reason for this is that as time went by, any given mortality level corresponded to a higher and higher age, which in turns is associated with a lower employment rate. For women, beyond this reduced mortality effect, there is a second strong generational factor at work, involving a steeply increasing labor force participation over the observation period.
Figure 11: Employment rate and mortality rate for male (left) and female (right) 0 .2 .4 .6 .8 E m pl oy m e n t r a te 0 .01 .02 .03 .04 .05 .06 Mortality 1983 1993 2006 0 .2 .4 .6 .8 E m pl oy m e n t r a te 0 .01 .02 .03 Mortality 1983 1993 2006
Source: Labor Force Survey and Human Mortality Database
B. Social Security Program Participation Disability insurance
While the preceding LFS data have the distinct advantage of giving a close reflection of the individuals’ true economic status, they are not able to reflect the richness of the Belgian
institutional landscape. Therefore, it should not have come as a surprise that the aggregate data of the previous subsection does not seem to reflect any of the specific social security reforms we discussed in section 2.
In order to investigate the effect of institutions on labor market participation, we draw on additional administrative data. In this context, program participation or “take-up” is defined as the number of individuals receiving benefits within the context of each program divided by the population in the corresponding cohort. To identify the various reforms to the social security schemes described in section 2, we draw vertical lines in the graphs plotting participation by age across time. These horizontal lines serve as a guide as to when the various reforms should have their effects, or at the very least start having effects.
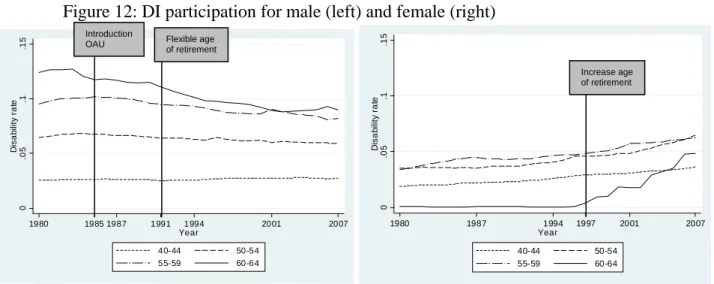
Looking at the DI program participation presented in figures 12, we observe different trends for male and female. Male DI rate for the age-groups 40-44, 50-54 and 55-59 is almost constant while disability for those aged 60-64 is decreasing. None of the reforms to generosity and eligibility of DI seem to have has an impact on participation. However, reforms concerning access to other program may well explain part of the decrease – particularly for those aged 60-64. For example, this could have been the case with the opening-up of the OAU route in 1985 and the introduction of a flexible age of retirement without actuarial adjustment factor in 1991. The positive trend for women of all age cohorts follows a different rationale mostly because of a strong expansion of the share of women in the labor market. While reforms to OAU and other early retirement routes affect women less due to insufficient work histories to qualify for such
benefits, while the increase of the female normal retirement age was not without effects – such as previously discussed.
Figure 12: DI participation for male (left) and female (right)
Source: INAMI-RIZIV
The Belgian disability administration prefers to use a different reference population when determining participation. Their reference population is composed of those individuals that are eligible to claim benefits because they contribute, minus those on CER because they do not have any economic incentives to switch to the DI system.
If one follows this logic of excluding those that are either not eligible, or have no economic interest to join the DI ranks, then this definition of the population is still too broad. For example, it is highly likely that the individuals on UI and OAU also do not have much of an economic incentive to switch – given the previously discussed absence of explicit time limits in benefit receipt.
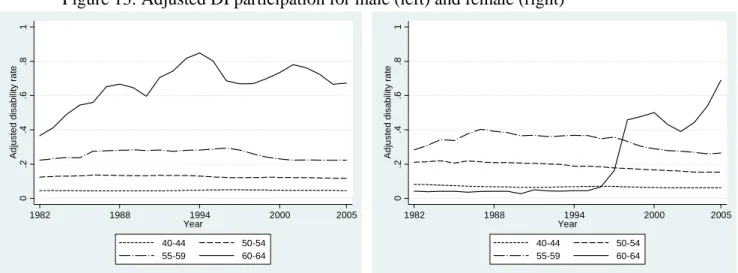
Using this adjusted population figure as a reference point, we derive equivalent participation trends over time (figures 13). The figures reveal much more sharply the effect of the reforms discussed in section 2. The increase in the age groups 55-59 after 1986 corresponds to the introduction of the old-age unemployment status which strongly reduces the denominator of the disability rate by shrinking the population that has an economic interest in claiming DI. Also, the initial trend observed for the age group 60-64 can be traced back to the increase in the number of retirees until 1987, thus shrinking the reference group. A similar logic applies to the early 1990’s with its major reforms to the retirement system.
0 .0 5 .1 .1 5 D is a b ili ty r a te 1980 1987 1994 1997 2001 2007 Year 40-44 50-54 55-59 60-64 Increase age of retirement 0 .0 5 .1 .1 5 D is a b ilit y r a te 1980 1985 1987 1991 1994 2001 2007 Year 40-44 50-54 55-59 60-64 Introduction
OAU Flexible age
Figure 13: Adjusted DI participation for male (left) and female (right) 0 .2 .4 .6 .8 1 A d ju s ted d is a bi lit y r a te 1982 1988 1994 2000 2005 Year 40-44 50-54 55-59 60-64 0 .2 .4 .6 .8 1 A d ju s ted d is a bi lit y r a te 1982 1988 1994 2000 2005 Year 40-44 50-54 55-59 60-64
Source: INAMI-RIZIV, ONEM and BNB-Belgostat
Summing up the information of figures 12 and 13, we can draw two conclusions. First, the trends in DI participation over time are not confined to the age group close to retirement, but also younger cohorts are affected. Second, while aggregate DI participation rates have stayed
unchanged, there have been substantial changes to the people “at economic risk” of filing for DI benefits, notably because of reforms to the eligibility and generosity of other social security programs targeted at the older segments of the labor force.
Other Social Security Programs
The effect of other program is however not limited to the one of restricting the population economically at risk of filing for benefits. Indeed, the multiplicity and generosity of other exit routes make it possible that truly disabled people file for other social security benefits such as CER, OAU, or UI in lieu of filing for DI. In this sense, the question of evaluating the
participation and the changes in participation over time is of prime importance.
We first focus on the regular UI program. As with the just discussed DI data, the UI data comes from the federal UI administration. The number of unemployed thus corresponds to the number of individuals currently claiming UI benefits under the rules in place. Given the institutional setup, this means that some truly unemployed people may not be eligible for benefits, while some segments of those receiving benefits would not be considered unemployed according to the standard definition of the ILO.
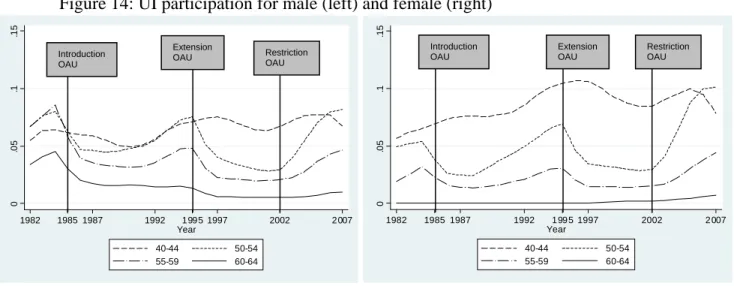
The time pattern of UI participation of figures 14 displays three clearly separated phases over time. Contrary to DI numbers, these rates seem to be independent of the demographic trend and are more heavily exposed to cyclical variations in the economy. Economic cycles don’t however provide a complete picture.
The stark decrease of UI participation after 1984 can be traced back to the introduction of OAU such as identified by the first vertical line. The shift into OAU is however not total, if only because some people don’t satisfy the somewhat more stringent entry criteria for the OAU system as compared to UI. Similarly, the further liberalization and expansion of the system in
1995 corresponds to the next drop of people on the UI rolls – an effect further reinforced by the arrival of the “Canada Dry” pensions in 1997. Finally, the third phase corresponds to the tightening of the access to OAU in 2002 – with an ensuing communicating vessels effect increasing UI as OAU decreases (see also figures 15).
Figure 14: UI participation for male (left) and female (right)
Source: BNB-Belgostat
However the decrease in the number of unemployed is lower than the increase in the number of old-age unemployed – as a quick glance at the rates presented in figures 14 and 15 document. Thus OAU clearly appears as a new exit path with a net addition of exits and not only
reallocations between programs.
Figure 15: OAU participation for male (left) and female (right)
Source: ONEM-RVA
As compared to their male counterparts, the situation for women is not very different, as the preceding figures 14 and 15 clearly illustrate. Unsurprisingly, the pattern for the 60-64 age group
0 .0 5 .1 .1 5 1982 1985 1987 1992 1995 1997 2002 2007 Year 40-44 50-54 55-59 60-64 Introduction OAU Extension OAU Restriction OAU 0 .0 5 .1 .1 5 1982 1985 1987 1992 1 99 5 1997 2002 2 007 Year 40-44 50-54 55-59 60-64 Introduction OAU Extension OAU Restriction OAU 0 .0 5 .1 .1 5 1982 1985 1987 1992 1995 1997 2002 2005 Year 40-44 50-54 55-59 60-64 Introduction OAU Extension OAU Restriction OAU 0 .0 5 .1 .1 5 1982 1985 1987 1992 1995 1997 2002 2005 Year 40-44 50-54 55-59 60-64 Introduction OAU Extension OAU Restriction OAU
displays a somewhat different pattern than for men, again for the same reason as before: the initially lower retirement and early retirement ages for women, with the ensuing labor market effects after their progressive increase to starting in 1997.
Figure 16: CER participation for male (left) and female (right)
Source: INAMI-RIZIV
Finally, figures 16 and 17 present the trends regarding CER and the regular pension system participation. The CER trends for men of all age groups are characterized by a strong
responsiveness to changes in the CER and OAU eligibility affecting the relative attractiveness of this system. Women benefit much less from the system, given the career length requirements that are often a non-trivial hurdle in case of incomplete careers. The two reforms to the main pension system modifying the early and normal retirement ages for women have the expected effects on CER and the pension scheme – with shifts towards CER in the affected groups.
Figure 17: Retirement participation for male (left) and female (right)
Source: ONP-RVP
For men, the trends in the regular pension system reflect reforms rather closely until the end of the last millennium. For example, the increase for ages 60-64 over the first half of the 1980s is
0 .1 .2 .3 .4 1982 1987 1991 1996 2001 2005 Year 50-54 55-59 60-64 End of SER Flexible age of retirement 0 .0 5 .1 .1 5 .2 .2 5 1980 1986 1990 1995 2000 2007 Year 50-54 55-59 60-64 Extension OAU Decrease eligibility age 0 .0 5 .1 .1 5 .2 .2 5 1980 1985 1990 1995 2000 2007 Year 50-54 55-59 60-64 Increase age of
early retirement Increase age
of retirement 0 .1 .2 .3 .4 1982 1987 1991 1996 2001 2005 Year 50-54 55-59 60-64 Increase age of retirement
related to the SER and RPP measures. The observed path after 2000 cannot be traced back to any specific legislative change – and coincides with general improvements on the labor market leading to an increase in the effective age of retirement. Similarly, the trends for the female age group 60-64 before the progressive increase of the retirement age as of 1997 is difficult to link to any specific change: the participation rates being stocks, they reflect the cumulative weight of past reforms. Thus changes to the OAU, the UI and the CER have no doubt had an influence. However, they are insufficient to explain the sheer size of fluctuations observed in the pension scheme, that might partially also be due to interactions of incentives and benefits for couples, as well as the sometimes unpredictable effect of incomplete careers on benefit eligibility.
Figures 18 present the information on program participation in a synthetic way for all available social security systems. Figure 18 highlights the “connected vessels” aspect of the various social security schemes with a strong role for OAU. Also, by now, OAU and UI combined account for more than 35% of all workers in the 50-64 age bracket making the unemployment benefit receipt the single most prominent retirement status! The fraction even rises to well beyond 60% when integrating the CER schemes that are also administered through the UI scheme.
Figure 18: Distribution of exit paths (%) for male (left) and female (right) - Age 50-64
0% 20% 40% 60% 80% 100% 1983 1985 1987 1989 1991 1993 1995 1997 1999 2001 2003 2005
Disability Conventional early retirement Retirement Unemployment OA unemployment
0% 20% 40% 60% 80% 100% 1983 1985 1987 1989 1991 1993 1995 1997 1999 2001 2003 2005
Disability Conventional early retirement Retirement Unemployment OA unemployment
Source: INAMI-RIZIV, ONEM, BNB-Belgostat, ONP-RZV
Note: Based on the number of people in benefit receipt in the various schemes.
C. Mortality, health and DI
Figure 19 displays the overall growth rate of participation in the different systems on a year-by-year basis – as well as the growth of the different component systems. The results show the relative constancy of the DI scheme – that can be seen as a rather marginal program. Two interpretations are possible. First, the optimistic one would argue that that entry into the DI program is so severely limited by powerful effective gate-keeping mechanisms that it is close to impossible to enter the system unless a serious medical or psychological condition exists. The second, less optimistic one, is based on the fact that other social insurance programs have a sufficient ease of access combined with a generosity that render the more stringent DI system less attractive.
Figure 19: Growth rate in the systems for male (left) and female (right) - Age 50-64 0 50000 100000 150000 200000 250000 300000 1983 1985 1987 1989 1991 1993 1995 1997 1999 2001 2003 2005 N u m b er i n ea ch sc h e m e -10% -5% 0% 5% 10% 15% 20% 25% % of ch ange
Disability Conventional early retirement Retirement Unemployment OA unemployment Growth rate
0 50000 100000 150000 200000 250000 300000 350000 400000 1983 1985 1987 1989 1991 1993 1995 1997 1999 2001 2003 2005 N u mb e r in e ach schem e -4% -2% 0% 2% 4% 6% 8% 10% 12% 14% 16% 18% % o f chang e
Disability Conventional early retirement Retirement Unemployment OA unemployment Growth rate
Source: INAMI-RIZIV, ONEM, BNB-Belgostat, ONP-RZV
Note: Based on the number of people in benefit receipt in the various schemes.
The data reported in figures 20 illustrates that the world of DI benefit participation is less stable and immobile than one would conclude from the preceding discussion. When decomposing by primary cause of DI benefit payment, one notices that mental health issues become a more and more prevalent issue as compared to purely physical ones. This leads to interesting avenues for future research: Could DI payments be lower if more severely tested? Do other programs also have a changing pool of beneficiaries, maybe including increasing numbers of truly disabled people?
Figure 20: Percentage of disabled individuals by cause, male (left) and female (right) - Age 50-64
0% 20% 40% 60% 80% 100% 1995 1996 1997 1998 1999 2000 2001 2002 2003 2004 2005 2006 2007 2008 2009
Circulatory Muskoskeletal Endocrinal Mental health Nervous system Tumor and cancer Respiratory and digestive Others
0% 20% 40% 60% 80% 100% 1995 1996 1997 1998 1999 2000 2001 2002 2003 2004 2005 2006 2007 2008 2009
Circulatory Muskoskeletal Endocrinal Mental health Nervous system Tumor and cancer Respiratory and digestive Others
Source: INAMI-RIZIV
This idea is further reinforced when looking at the relative prevalence of DI participation in the populations aged 40-44 and 60-64, the former not being eligible for other early retirement programs. These data are represented in figure 21 and show steep decline in the difference between the two groups – hence indicating a relatively lower prevalence of DI cases in the older population as time went by. Though these data don’t allow us to conclude formally on the shifting of true DI recipients onto other programs, such a phenomenon is highly likely.
Figure 21: DI participation age 60-64 less age 40-44 for men .0 2 .0 4 .0 6 .0 8 .1 .1 2 1980 1987 1994 2001 2007 Year Source: INAMI-RIZIV V. CONCLUSIONS
Disability insurance has attracted a limited interest in the Belgian policy debate. This is no doubt influenced by the relatively limited budgetary cost of this program, when comparing it to its bigger health and public pension siblings.
The present paper shows that disability insurance indeed seems to have a rather unspectacular time trend over the last decades. We show that the other social security programs allowing an early exit from the labor market play the key role in the Belgian retirement context.
As compared to younger cohorts, older workers tend to benefit from disability payments less and less frequently. Furthermore, the composition of the disabled population is changing over time, with increasing numbers of benefits being based on mental problems that are intrinsically harder to check than physical impairments.
This has two policy implications. First, in spite of its appearance, the increasing role of harder-to-check benefit decisions may well mean that the disability program is serving as an early
retirement route. Second, substantial numbers of disabled may in fact be using other social security programs to exit the labor market. The latter would mean that the various social
insurance programs are getting more and more diverted from their original aims – in the Belgian context particularly the unemployment system.
Additional research on the underlying health characteristics of the beneficiaries of the various social security programs would be warranted to guide any future reforms. A further area of investigation could be a systematic analysis of the work environment that people face during their active life. This environment has no doubt undergone profound changes over the last decades, both because of a seminal trend towards the service sector and stricter general work-safety requirements in place.
References
BNB-Belgostat. (2010). Online Database on Economic Indicators for Belgium. http://www.nbb.be/belgostat
Cremer, H., Lozachmeur, J.M. and Pestieau, P. (2009). “Use and Misuse of Unemployment Benefits for Early Retirement”. European Journal of Political Economy, vol. 27(2), pp.174-185.
Dellis, A., Desmet, R. Jousten, A. and Perelman, S. (2003) “Micro-Modelling of Retirement in Belgium,” in Social Security and Retirement Around the World: Micro-estimation, ed., by J. Gruber and D. Wise (Chicago: University Chicago Press).
Desmet, R., Jousten, A. , Perelman S. and Pestieau, P. (2007) “Micro-Simulation of Social Security in Belgium,” in Social Security Programs and Retirement Around the World:
Fiscal Implications of Reform, ed., by J. Gruber and D. Wise (Chicago: University
Chicago Press).
Disney, R., Emmerson, C. and M. Wakefield (2006) “Ill Health and Retirement in Britain: A Panel Data-based Analysis”, Journal of Health Economics, vol. 25(4), 621-649.
European Labor Force Surveys 1983–2008. Eurostat : Luxembourg.
Faniel, Jean (2008). “L’assurance chômage, entre pressions européennes et polémiques régionales, » Chroniques internationales de l’IRES no 115.
Human Mortality Database. University of California, Berkeley (USA), and Max Planck
Institute for Demographic Research (Germany). Available at www.mortality.org or
www.humanmortality.de.
INAMI-RIZIV (2009). Statistiques des indemnités, INAMI-RIZIV: Brussels.
Jousten, A., Lefebvre, M., Perelman, S. and Pestieau, P. (2005) “Social Security in Belgium: Distributive Outcomes” Institute for the Study of Labor (IZA) Discussion Paper no. 1486.
Jousten, A., Lefebvre, M., Perelman, S. and Pestieau, P., 2010, “The effect of Early Retirement on Youth Unemployment. The Case of Belgium” in Social Security
Programs and Retirement Around the World: The Relationship to Youth Employment,
ed. by J. Gruber and D. Wise (Chicago: University Chicago Press).
Kalweij, A. and F. Vermeulen (2008) “Health and Labour Force Participation of Older People in Europe: What do Objective Health Indicators add to the Analysis”, Health Economics vol. 17(5), 619-638.
ONP-RVP (2009). Statistiques annuelles des bénéficiaires de prestations. ONP-RVP : Brussels.
Pestieau, P. and J.P. Stijns (1999) “Social Security and Retirement in Belgium” in Social
Security Programs and Retirement Around the World, ed. by J. Gruber and D. Wise