Performance evaluation and legitimacy of the third sector: the case of
the Belgian domiciliary care quasi-market
Defourny A.
1, Henry A.
2, Nassaut S.
3, Defourny J.
4, Nyssens M.
50. Introduction
During the last decades, public regulation of social policies has undergone profound transformations. Many countries have introduced welfare quasi-markets which consist in a separation of the financing and provision of social services. The present contribution deals with the “service voucher scheme”, a Belgian public policy, emblematic of these evolutions, which was introduced in 2001 in the field of domestic services. This measure, as stated by the Law, aims to develop both proximity services and employment (also fighting against undeclared work), as recommended by the European strategy for employment.
This paper is structured as follows. First, we will describe the “service-voucher” measure and see why it can be defined as a quasi-market mechanism, opening the field of domiciliary care to a broad set of providers, be they public, for-profit or not for profit. Second, we will show that the twofold objectives targeted by the “service voucher” (developing proximity services and increasing employment) is reflected in the diversity of providers and, particularly, in the social mission pursued by some of the non-profit providers. On behalf of a mission of work integration or home care, those providers benefit from additional public funding, which was considered, by some commercial providers, as an “over-subsidization” and so, as unfair competition. Finally, in order to assess the legitimacy of that claim, we will provide some insights of an empirical analysis that highlight the differences in quality of work and of service among the different types of “service voucher” providers.
1. The service voucher: a quasi-market mechanism
In Belgium, the service voucher system has been launched on the 1st of January 2004 and has met, until now, with an impressive success: almost 60.000 workers employed, 200.000 active users, and around 1.500 providers with, among them, a number of organisations especially created with this public scheme. This system is mainly designed to foster the creation of regular salaried work for low qualified people in the housework field where services were, up to now, mostly provided on the black market.
Incidentally, this policy is also designed to ease the work – family life balance, by providing housework services and, by the way, implying a better functioning of the labour market, through an increased availability of parents for work. The sharp increase of the demand for vouchers is however limited by a shortage of work supply and a significant burden on the public budget, though it is expected that this creation of jobs relieves unemployment
1 Defourny (A.), Aspirante FNRS, Assistante de recherche au CERISIS-UCL, Boulevard Devreux, 6, B-6000 Charleroi, Belgique, 0032(0)71202528, anne.defournyclouvain.be
2 Henry (A.), Assistant de recherche au CES-ULg, Sart Tilman B33 Boîte 4 B-4000 Liège, Belgique, 0032(0)4 3663135, a.henry@ulg.ac.be
3 Nassaut (S.), Assistant de recherche au CERISIS-UCL, Boulevard Devreux, 6, B-6000 Charleroi, Belgique, 0032(0)71202509, stephane.nassaut@uclouvain.be
4
Defourny (J.), Professeur à l’ULg, Sart Tilman B33 Boîte 4 B-4000 Liège, Belgique, 0032(0)4 3663136, J.Defourny@ulg.ac.be
5 Nyssens (M.), Professeur à l’UCL, Boulevard Devreux, 6, B-6000 Charleroi, Belgique, 0032(0)71202537, marthe.nyssens@uclouvain.be
allowances, increases income taxes receipts and social security contributions. This budgetary situation has recently led the government to cut back its initial financial contribution of 14.30 Euros per “service voucher” to 13.50 Euros, and to raise the price paid by the user from 6.70 Euros to 7 Euros. The cut in subsidy raised serious concerns among providers, claiming that it would jeopardize the jobs created.
The “service voucher” system works as follows. Any person willing to get domestic services can buy vouchers at 7 Euros per hour to the company in charge of the administration of the system. Then, the consumer chooses a registered provider, belonging to the for-profit sector, third sector or public sector. The services can be provided in house (cleaning, cooking, and ironing) or outside the house (mainly grocery-buying services, ironing and transport for dependent persons). Every hour of service provided is then paid with one voucher, thus at a fixed price of 7 Euros per hour or, possibly, of 4.9 Euros after a tax cut of 30%. Finally, the provider returns the vouchers to the company in charge of the administration of the system and receives 20.50 Euros – 7 Euros corresponding to the price paid by the consumer and the additional public subsidy of 13.50 Euros - for covering all the costs associated with one working hour of domestic work (wages, social security contributions, training and supervision of the worker, transportation costs …).
Following Le Grand (1991), a quasi-market implies a split between the functions of financing and providing, which were traditionally devoted, in the field of social services, to the State. Within a quasi-market, the state still contributes to the financing of the service but provision is open to all kinds of organisations: public sector, third sector and for profit sector which compete on the market. The “Belgian service voucher” can be qualified as a “quasi-market” policy since a variety of for profit, public and third sector providers (with different missions, legal status, access to public funding) are now competing for the provision of domestic services that are still, to a large extent, funded by the State. Indeed, as customers are not ready to pay more than the black market price, the State sets the hourly price to 7 Euros for the consumer, for a service whose cost for the employer is close to 20 Euros per hour. However, the subsidy is not directly allocated to the provider but rather to the consumers who “bear” it to the provider, thus enhancing their capacity of choice. At last, the state intervention lies in the registration procedure of the providers.
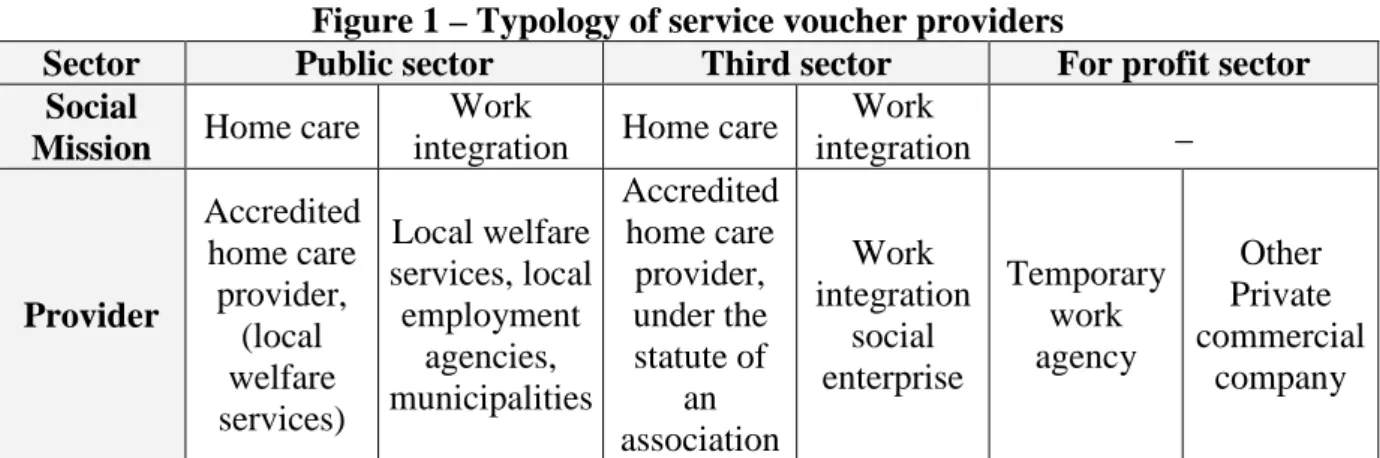
2. A diversity of providers
Given the twofold dimension of this public scheme (developing proximity services – in this case, housework – and raising employment), it is not surprising to find on the quasi-market, beside for profit providers, some providers driven by a social mission of work integration for low qualified workers and others, by a social mission of home care services to vulnerable persons. Indeed, work integration social enterprises, whose mission is to create temporary or long-term jobs (possibly with the service voucher) for the most disadvantaged workers and, among them, those who have not reached the upper secondary school, are well-established actors on the quasi-market. Likewise, we find the accredited home care providers – namely the “accredited services of assistance for families and elderly people” – which are basically delivering polyvalent home care services, including housework but also a sanitary, social and administrative assistance. Though these public or private non-profit organizations are initially focused on vulnerable families and elderly people (in situation of autonomy loss, disabled, ill, coping with financial difficulties …), they are not, in joining the voucher system, necessarily targeting this type of beneficiaries. Rather, they entered the voucher system on the basis of their expertise in domiciliary care, but also in order to closely monitor the opening of their field to a competitive regulation. More precisely, they feared that other “service voucher” providers, though only authorized to deliver housework, actually offer homecare, without
being accredited to that purpose (and thus offering no guarantees in terms of quality of the service, and of protection of the worker).
Figure 1 shows our typology of the service voucher providers according to their social mission (work integration or home care) and their sector (for profit, public and third sector). The for-profit sector is mainly composed by temporary work agencies and other types of private commercial companies. The public sector includes providers pursuing a social mission of home care - local welfare services accredited as domiciliary care provider - and of work integration such as some services developed by local welfare services, local public employment agencies or municipalities. The organisations belonging to the third sector are associations accredited as home care provider and work integration social enterprises.
Figure 1 – Typology of service voucher providers
Sector Public sector Third sector For profit sector
Social
Mission Home care
Work
integration Home care
Work integration _ Provider Accredited home care provider, (local welfare services) Local welfare services, local employment agencies, municipalities Accredited home care provider, under the statute of an association Work integration social enterprise Temporary work agency Other Private commercial company
Table 1 gives the distribution (in %), in 2006, of registered providers and of workers, between the types of providers.
Table 1: Overview of the quasi-market in terms of providers and of employment creation % of Registered providers Distribution of workers % of workers
For profit sector 35,5% 33332 55%
Temporary work agency 3,3%6 22323 36,9%
Other private commercial company 32,2% 11009 18,2%
Third sector 24,3% 16738 27,7%
Registered home care associations 6,3% 7471 12,3%
Work integration social enterprises 10,3% 6264 10,3%
Other third sector providers (with an undetermined mission)
7,7% 3003 5%
Public sector 40,2% 10507 17,3%
Local welfare offices registered as home care provider
7,6% 1604 2,6%
Local welfare offices7, local employment agencies, municipalities (work
integration mission)
32,6% 8903 14,7%
Total 100% 60577 100%
Source : Base de données ONEM (2006)
6 In terms of head offices, the temporary work agencies represent only 3,2% of the service voucher providers. But, in terms of branches, their representation is much higher.
7
This diversity of missions among the service providers leads, as a consequence, to a variety of financial resources available to the providers. Indeed, the introduction of a competitive regulation has highlighted the competitors’ peculiarities, particularly in terms of access to public funding which is, in the case of the service voucher, a critical issue. Indeed, when the exchange value of the service voucher was still of 21 Euros, a significant percentage of providers (more than 60%) claimed that this amount was insufficient to cover the costs of a decent job. This situation worsened when the government decided, for budgetary reasons, to cut the subsidy of one Euro per voucher. Consequently, in order to cover their costs, some providers rely on supplementary public resources such as active labour policies or regional subsidies linked to other accreditations, as in the case of the work integration social enterprises where public resources are conditional to a regulatory framework compliance, dealing with the quality of the work integration. However, from the point of view of the for-profit providers, the variability of access to public resources was considered as an “over-subsidization” benefiting to specific providers and so, as unfair competition for commercial enterprises. In such a context, the legitimacy of the non-profit providers pursuing a social mission, requiring de facto additional resources, becomes a central issue.
3. A comparative analysis of the quality of work and service
A comparative analysis of the quality of work and service is made all the more important that, compared to foreign quasi-markets in the fields of domiciliary care or work integration, the service voucher quasi-market appears as very lightly regulated. The registration procedure for providers is very little demanding and, in terms of quality of work, the “service voucher” law is, rather, introducing deregulation. Indeed, providers can offer employment contract below the threshold of 1/3rd of a full-time job which is the minimum required by the regular labor law. They can also offer an unrestricted number of limited-duration contracts during a transitory period of 3 or 6 months, which is a supplementary derogation to labor standards. However, the “service voucher” law provides that an employer must offer a long-term contract at the end of that transitory period. Regarding the service quality, certification only requires that the provider exclusively delivers proximity services or, if they already deliver other types of services, establish a specific branch for their service voucher activity. No other type of obligations is required in terms of quality of the service. This light regulatory framework is finally reflected in the disconnection between the level of public financing, which is only a matter of volume of activity, and any consideration in terms of job quality and of the service provided.
In order to question the commercial providers’ assertion of unfair competition, it would be necessary to compare provider’s global performance. It would then require to compare “wide” production of providers with the public resources received. “Wide” production means that outputs (products of the activity), but also direct impacts (consequences of the activity on direct beneficiaries) and indirect impacts (effects of the activity on people or organizations which are not direct beneficiaries) should be taken into consideration. According to this, the following multi-criteria grid (see table 2) has been designed. In this research, we will thus examine the quality of services delivered, contrary to the official evaluation reports which are focusing quasi-exclusively on the quantity and (partially) quality of jobs and on the cost of the measure.
Table 2: Multi-criteria grid to evaluate performance of the service voucher scheme
Outputs Number of users, vouchers and created jobs
User’s direct Impacts
Service quality (user need’s evaluation, service’s accessibility to all users, service flexibility, service reliability, user’s protection, provider’s
evaluation, service’s evaluation…)
Worker’s direct impacts
Job quality (training, type of supervision, wages, type of contracts offered…)
Collective impacts
Better functioning of labor market, better balance between private and professional life, appropriateness of service offered to the user’s profile,
equity, social cohesion…
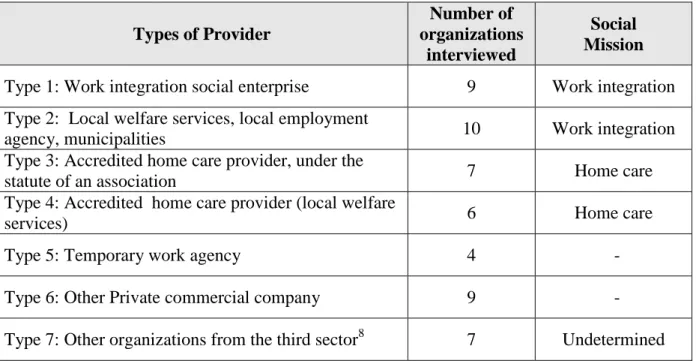
This comparative analysis is based on the processing of two sets of data: on the one hand, an administrative data base that provides us information about all workers and service voucher employers on the quasi-market in 2005 and 2006. In 2005, the information is quarterly given while in 2006, the data base is annual; on the other hand, data collected in 2007 and 2008 among a sample of 52 providers selected according to our typology (see table 3) and interviewed with respect to quality employment and service. These two sets of data are currently being processed but it is already possible to present in this paper some results concerning jobs and service quality.
Table 3: Description of our sample
Types of Provider Number of organizations interviewed Social Mission
Type 1: Work integration social enterprise 9 Work integration Type 2: Local welfare services, local employment
agency, municipalities 10 Work integration
Type 3: Accredited home care provider, under the
statute of an association 7 Home care
Type 4: Accredited home care provider (local welfare
services) 6 Home care
Type 5: Temporary work agency 4
-Type 6: Other Private commercial company 9
-Type 7: Other organizations from the third sector8 7 Undetermined
8 We put in this last category organizations from the third-sector whose mission is difficult to identify on the basis of available information. These organizations have no accreditation showing that they follow any specific social mission and therefore can only rely on resources coming from the service voucher scheme.
3.1. Quality of work
The administrative data base gives us information about two relevant job quality indicators. First, we analyze the type of contract –fixed or long term contract- offered by the provider to the worker at the hiring. Second, we follow workers from their entry in the voucher system to know how long they stay employed by their initial provider. Regarding these two indicators, we ask the question whether type of contract offered at the hiring and tenure in the initial employer vary across providers’ type. To that purpose, we only consider workers who entered the voucher system within the second quarter of 2005 (noted 2005q2 in what follows). The main reason is because we have information only until 2006, these new entrants are those who can be followed over the longest period of observation. Figure 4 shows the distribution of these new entrants in 2005q2 across providers' type. Almost 20% of them have been employed by providers with a home care mission (mainly third sector providers), against 22% for employers with a work integration mission (15% by public providers). Finally, the for-profit sector employs 57% of these new entrant workers (44% for the temporary work agencies alone).
Figure 4
% of workers in each type of providers
7% 15% 16% 3% 44% 13% 2%
Work integration social enterprise
Local welfare services, local employment agency, municipalities
Accredited home care provider, association
Accredited home care provider, local welfare services
Temporary work agency
Other Private commercial company
Other organizations from the third sector
• Long term versus limited duration contract
Figure 5 shows the percentage of workers who received a long term contract at their hiring across providers’ type. Looking at this graph, we can conclude that the two providers that offer less long term contracts directly are the temporary work agencies and the other organizations from the third sector, while quite high percentages of new workers in other providers’ type receive directly a long-term contract. For example, the work integration enterprises directly propose a long-term contract to 90% of their new workers.
Figure 5
Percentage of workers who received a long term contract at the hiring 0,00% 20,00% 40,00% 60,00% 80,00% 100,00% W o rk in te g ra ti o n L o c a l w e lf a re s e rv ic e s ,… H o m e c a re , a s s o c ia ti o n H o m e c a re ,l o c a l w e lf a re s e rv ic e s T e m p o ra ry w o rk a g e n c y O th e r P ri v a te c o m m e rc ia l c ie O th e r o rg a n iz a ti o n s (t h ir d s e c to r) A ll p ro v id e rs
• Workers’ tenure across types of providers
We are also able to follow new entrant workers and calculate how long they stay by their initial employer. As mentioned earlier, we concentrate on new workers entered in 2005q2 and we can follow them till 2006. We also use the fact that data in 2005 are provided quarterly. Given this, we can calculate four lengths of tenure. Length of tenure 0 is defined as being observed as new entrant in 2005q2 and being absent (by the same employer) the following periods. Length of tenure 1 is defined as being observed in the employer in 2005q2 and in 2005q3 but not during the rest of the period, in 2005q4 and in 2006. Length of tenure 2 is calculated for workers who are observed working for the same employer in 2005q2 and 2005q3 and 2005q4 but not in 2006. Finally, length of tenure 3 is defined as working for the same employer over the whole period of observation. Figure 5 presents the percentage of workers in each length of tenure across provider’s type. Again temporary work agencies show clear differences with respect to the other providers. While in the four first types of providers in the graph (Work integration social enterprises; Local welfare services, local employment agency, municipalities, Accredited home care provider, association and local welfare services) a large majority of workers stay the whole period of observation to their initial employer, temporary work agencies show a quite high part of their new workers who quit directly (after less than 3 months).
At this stage, two comments must be done. First, we can not say whether it is the worker who quits or whether it is the employer who fires. Second, when workers quit their employer, different trajectories are possible: either they leave the voucher device or they go to another employer within the voucher system that can be of the same or a different type from the initial one. We could analyze where workers go when they quit their initial employer but it is left for further work.
Figure 5
Duration in the initial provider
0,00% 10,00% 20,00% 30,00% 40,00% 50,00% 60,00% 70,00% 80,00% 90,00% W o rk in te g ra ti o n L o c a l w e lf a re s e rv ic e s ,… H o m e c a re , a s s o c ia ti o n H o m e c a re ,l o c a l w e lf a re T e m p o ra ry w o rk a g e n c y O th e r P ri v a te c o m m e rc ia l c ie O th e r o rg a n iz a ti o n s (t h ir d s e c to r) A ll p ro v id e rs %tenure 0 %tenure 1 %tenure 2 %tenure 3
Though this administrative database covers the whole population of service voucher workers and provides enlightening information about key aspects of jobs quality, it is not sufficient to take into account all dimensions of the performance described in the multi-criteria grid of performance (table 3). In this context, 52 providers have been interviewed with the aim of collecting more information about organizational patterns with regard to the quality of jobs created and service delivered, and also to the resources available for providers. Again, the first results show that types of providers behave differently, which supposedly leads to different costs’ structure. We will here examine two more aspects in terms of quality of jobs created, i.e. training and supervision offered by providers.
• Training
Contrary to the official evaluation reports, a distinction has been made in our interviews between two types of training: the training given before the first service of the worker (“formation before”) and the formation given afterwards (“formation after”). If it is not possible to conclude that differences exist between providers in terms of “formation before” (most providers do not offer this type of formation), clear differences appear when “formation after” is taken into account. Results indeed show the importance of “training after” according to the provider’s mission. Figure 6 shows that third and public sector providers, with a social mission of work integration (column 1 and 2) and home care (column 3 and 4), give more “training after” to all or a part of their workers. At the opposite, temporary work agencies from our sample never give this kind of training to more than 50% of their workers. It is furthermore interesting to note that other commercial companies behave differently from temporary work agencies, making for profit sector heterogeneous.
Figure 6
Training "after" offered by type of providers
0% 10% 20% 30% 40% 50% 60% 70% 80% 90% 100% Work integration social enterprise Local w elfare services (LWS), LEA, municipalities Accredited home care provider (association) Accredited home care provider (LWS) Temporary w ork agencies Other private commercial companies Other organisations from third sector No training after offered Training after offered to 1 to 49% of workers Trainig after offered to 50 to 99% of workers Training after offered to all workers
The following figure takes into account both training before and after. Moreover this time, it only considers training included in work time. Differences appear again between providers since these with a home care mission (coming from the public or third sector) offer more training than others.
Figure 7
Training "before" and "after" included in work time by type of providers 0% 10% 20% 30% 40% 50% 60% 70% 80% 90% 100% Work integration social enterprise Local w elfare services (LWS), LEA, municipalities Accredited home care provider (association) Accredited home care provider (LWS) Temporary w ork agencies Other private commercial companies Other organisations from third sector No training before offered and training after offered to less than 50% of workers Training before offered and/or training after offered to more than 50% of workers
It is interesting to consider if training is included in work time because, as already mentioned, the level of public financing is only related to the amount of service hours delivered. In this context, some providers try to maximize their activity rate, calculated as the number of hours of housework delivered (and subsidized) divided by the total of hours paid according to work contracts. Consequently, providers willing to maximize their resources do not spend time on “non-productive” activities such as training. The same argument has to be kept in mind when supervision will be considered below. A financial audit recently showed in this connection that temporary work agencies and other commercial enterprises have the higher activity rate, with respectively 94,20% and 88,29% while other organizations reach only a maximum rate of 85% - work integration social enterprises only reach an activity rate of 76% (PricewaterhouseCoopers, 2007).
• Supervision
Another way to differentiate providers in terms of quality of jobs created is to look at the supervision offered to workers. This seems particularly important since workers hired in this scheme are mainly composed of low qualified/educated people. Official evaluation reports have besides showed some differences between providers on this matter. If all providers hire largely low educated workers, providers such as work integration social enterprises and local welfare services hire more low skilled workers. More or less 50% of their workers are indeed at the most graduated from primary or lower secondary school.
In this context, different types of supervision have been examined in our interviews: collective supervision (meetings) and individual supervision. However, significant differences between providers only appear when collective supervision is considered. Concerning this dimension, it isn’t only interesting to know that there is a collective supervision (such as official evaluation reports do) but it is also important to take into account the type of collective supervision organised. Different variables have therefore been analysed concerning the frequency, the duration and the time of the supervision. In this paper, we will present a cluster analysis based on the results of a multiple correspondence analysis including three variables. These consider 1) if collective supervision is organised, 2) the frequency of collective supervision and 3) if this supervision is included in work time. It has been possible to classify our providers into 4 subsets: the first one represents organisations which organise the most collective supervision, the second and the third ones regroup providers which organise what we call “intermediate” collective supervision, while the fourth regroup providers with no collective supervision.9 Figure 8 and 9 show the existing associations between these groups (clusters) and the different types of providers thanks to a final simple correspondence analysis.
9 The characteristics of the four clusters are the following: Cluster 1 - Most collective supervision: collective meeting organized at least once a month, included in work time; Cluster 2 - Intermediate collective supervision 1: collective meeting organized less than once a month but which is included in work time; Cluster 3 - Intermediate collective supervision 2: collective meeting organized sometimes less than once a month and sometimes at least once a month but which is not included in work time; Cluster 4 - Most collective supervision: no collective meeting organized.
Figure 8
Collective supervision : Cluster distribution among types of
providers
0% 10% 20% 30% 40% 50% 60% 70% 80% 90% 100% Cluster 1: Most collective supervision (14 organizations) Cluster 2 : Intermediate collective supervision 1 (11 organizations) Cluster 3 : Intermediate collective supervision 2 (6 organizations) Cluster 4 : No Collective supervision (21 organizations)Other organizations from third sector
Other private commercial companies
Temporary work agencies Accredited home care provider (LWS) Accredited home care provider (association) Local welfare services (LWS), LEA, municipalities Work integration social enterprises
Figure 9
Collective supervision: Repartion of providers
in clusters
0% 20% 40% 60% 80% 100% Work integration social enterprise Local w elfare services (LWS), LEA, municipalities Accredited home care provider (association) Accredited home care provider (LWS) Temporary w ork agencies Other private commercial companies Other organisations f rom third sector Cluster 4 : No collective supervision (21 organizations) Cluster 3 : Intermediate collective supervision 2 (6 organizations) Cluster 2 : Intermediate collective supervision 1 (11 organizations) Cluster 1 : Most collective supervision (14 organizations)The two figures above show that providers with a social mission are, more than other providers, supervising (collectively at least) their workers. It is particularly the case when the accredited homecare providers are considered. Furthermore, if only providers with social
mission are considered (column 1 to 4)10, third sector providers appear to supervise more than their public counterparts.
3.2. Quality of service
At first sight, the type of services considered here – housework services – raises few issues in terms of quality of service. However, by definition, proximity services are characterised by an objective dimension of proximity, the services being provided in the house of the user, and by a subjective dimension of proximity, i.e. the relational dimension between the user and the worker, which is central for the quality of the service (Laville et Nyssens, 2006). The objective side of proximity implies that substantial asymmetries of information between the worker and the employer are affecting the provision of the service. This raises the question of what types of services are really delivered by the houseworker to what types of beneficiaries. Are some providers (and what kind?) informed that their workers complete unauthorized tasks, such as child-care or home care, and how do they address that potential problem? This question is all the more important that some users are potentially vulnerable, such as old dependent persons, and that the “service voucher” workers are not trained to provide a good quality home care or child care. Here, we will examine four dimensions of the service provision that appear relevant in the specific case of the “service voucher”.
• Types of users
The official reports published by the Ministry of Employment do not mention the age distribution of users between the different types of providers, but state however that there are two major segments of “service voucher” users. The first group – the largest one – includes the relatively young bi-active couples that need an externalization of domestic tasks to improve their work–family life balance. According to the report, "the number of users reaches a peak around the age of 35 years (when many individuals found a family with one or more children)”. The second group is made of elderly persons, with 26% users over 60 years and nearly 8% over 80 years. The reports underline that the “service voucher” enables these users to live in their own homes longer, especially when they are physically impaired. This added value is corroborated by the fact that an “important” to “very important” reason explaining the recourse to the system is, for 52% of the users in the sample, “not to be able to physically carry out certain tasks”.
The results of our research show that three providers out of four are able to categorize their users in function of their age. This share is relatively stable for every category of providers, except for the temporary work agencies where only one (out of four) employer is able to give indications about the age of its users. If we look at the distribution of the oldest persons (over 75 years) among the providers (see figure 10), we observe that the public sector behaves in a (statistically significant) distinctive way compared to the third and for-profit sectors. Though these late sectors have almost identical profiles, the public sector comprises the most (resp. least) providers with a high (resp. low) percentage of users over 75 years.
10 Other organizations from the third sector are not included because no social mission has been recognized by an accreditation for these organizations.
Figure 10
Age distribution among the three sectors
0% 10% 20% 30% 40% 50% 60% 70% 80% 90% 100%
Third Sector Public Sector For Profit Sector
providers with [41%;60%] of users over 75 years providers with [11%;40%] of users over 75 years providers with [0%;10%] of users over 75 years
If we take into consideration both the sector and the mission of the provider (see figure 11), we find that, in the public sector, the providers with the most users over 75 years are mainly local welfare offices registered as home care providers and, to a lesser extent, providers with a work integration mission, such as local employment agencies and local welfare offices (not registered as home care provider). As for the third sector, we notice that the registered home care associations tend to count higher percentage of elderly people than other third sector organizations. At last, the for-profit sector is rather homogeneous in terms of age distribution given that a vast majority of commercial providers have relatively few aged persons among their clientele.
Figure 11
Age distribution among the categories of providers
0% 10% 20% 30% 40% 50% 60% 70% 80% 90% 100% Third sector -Wise (N=9) Public sector -LEA, LWO (N=9) Third sector -Registered home care associations (N=7) Public sector -Registered home care LWO
(N=6) For-profit sector - TWA (N=4) For-profit sector - other private commercial company (N=9) Other third sector initiatives (associations) (N=7) providers with [41%;60%] of users over 75 years providers with [11%;40%] of users over 75 years providers with [0%;10%] of users over 75 years
• User’s motives
As mentioned above, official evaluation reports point to the fact that the service voucher addresses two main individual (and collective) issues, i.e. facilitating the work-life balance of active users and allowing elderly people to stay in their own houses rather than move into residential care. We asked the providers in our sample what was the degree of frequency of the following motives expressed by their “service voucher” users: improvement of work-life balance, home help for elderly people with physical impairment (but not extended loss of autonomy), home help for elderly people with a loss of autonomy (requiring also sanitary, social, administrative assistance), and home help for families in trouble. The “work-life balance improvement” is considered as a very frequent motive by 81% of the providers. As for the other rationales to resort to the service voucher, “physical impairment” is quoted as a very frequent motive by 73% of the providers, home help for dependent users by 21% and home help for families in trouble by 13%. Generally speaking, “service voucher” providers are thus led to provide “proximity services” in situations where vulnerable people are involved. However, public sector providers are more frequently associated to low level frequencies of the “work-life balance” motive than the third or for-profit sectors, meaning that public providers may, more frequently than others, voluntarily target more vulnerable people (physically, socially, …) and, as shown above, focus on more elderly people (75+).
• Tasks completed
We asked the providers in our sample to state if their workers were allowed to complete tasks that are not explicitly authorized by the “service voucher” law, such as helping old persons wash themselves, getting in/out of bed, managing medication, helping to move in the house, psychological support, administrative help, and child care. The following table provides the percentage of employers that authorize the provision of those tasks, showing that the service delivered may frequently exceed the scope of a technical help to enter into the field of personal and child care:
If we divide the providers into two groups – those providing only housework and those providing extra-tasks -, we observe that both the sector and the mission have an influence on a provider’s propensity to carry out unauthorized tasks. Figure 12 shows that the registered home care providers (non-profit, public or private) are more prone to properly delineate the housework service and so doing, to avoid a confusion in terms of tasks executed. Then come the providers driven by a mission of work integration (non-profit, public or private) which deliver extra-tasks in approximately one case out of two. At last, the providers pursuing a profit mission are the least careful in terms of tasks effectively completed: almost 7 employers out of 10 authorize its workers to cross the limits of a home help service.
Assistance with walking Assistance with getting in/out of bed Assistance with washing Managing medication Psychologi -cal support Administra
-tive help Child care
Figure 12
Unauthorized tasks completed
0% 10% 20% 30% 40% 50% 60% 70% 80% 90% 100%
Work Integration Home care Profit
No Yes
If we now take into account both the mission and the sector, we detect a “sector” effect (see figure 13) given that, except for the “other third sector initiatives”, third sector providers (with a mission of work integration or home care) are better behaving on that issue, compared to public or for-profit providers.
Figure 13
Unauthorized tasks among providers' categories
0% 10% 20% 30% 40% 50% 60% 70% 80% 90% 100% Third sector -Wise (N=9) Public sector -LEA, LWO (N=9) Third sector -Registered home care associations (N=7) Public sector -Registered home care LWO (N=6) For-profit sector - TWA (N=4) For-profit sector - other private commercial company (N=9) Other third sector initiatives (associations) (N=7) No Yes
• Set up of the service
Given that potentially vulnerable users are involved, the set up of the service is important in as much as it allows the employer to check, from the outset, if the service is appropriate with regard to the user’s profile and needs. The employer’s intervention at an early stage is also
important to assess the workload and to provide a risk assessment of the work environment. In order to be effective, this requires a home inspection to the user’s home before the start of the provision of the service, a visit that is frequently coupled with the signature of the contract. We then asked the providers in our sample to describe the modus operandi regarding the contract’s signature, operation that can be achieved in different manners: at a distance (by mail, email or at the agency), or in the house (by a supervisor/manager or by the home worker herself). A signature at the agency allows a face-to-face interaction between the provider and the client and gives the employer the opportunity to make explicit the rules framing the service provision. A signature at the user’s home by the home worker herself enables the latter to evaluate, on her workplace, the workload, possible dangers, etc. However, from the four possible ways of signing the contract, the one that involves a manager/supervisor at the user’s home offers the most guarantees in terms of service and employment quality, and of protection of both the user and the worker.
A clustering based on a multiple correspondence analysis allows us to classify the providers into 4 clusters: the first one gathers the providers that accomplish very frequently this task by mail; the second one, those that privilege a signature at home by a supervisor; the third one comprises the employers that sign very frequently the contract at the agency; and the fourth one includes the providers that very frequently make the home worker responsible for signing the contract. Figure 14 shows the association (statistically significant) between the providers’ mission and the 4 groups:
Figure 14
Mission's influence on the type of contract's signature
0% 10% 20% 30% 40% 50% 60% 70% 80% 90% 100%
Work Integration Home care Profit
At home, by a home worker At the agency At home, by a supervisor By mail
It then appears that, compared to other providers, those pursuing a home care mission rely more frequently on a visit at the user’s home to sign the contract. As for employers driven by a profit mission, they resort more frequently to a mail exchange (in more than 50% of cases), but also to a home inspection in one case out of four. The providers with a work integration mission stand on some sort of intermediate position, 30% of them relying on a mail exchange and on home inspection. It should be noted that, among those providers, the signature happens to take place at the agency in almost 30% of cases. A break down of the four groups by category of providers shows that registered home care providers, be they public or private (from the third sector), show relatively similar organizational patterns in terms of signature of the contract. However, among the for-profit providers, the temporary work agencies differ
significantly from the other for-profit providers by relying exclusively on mail exchange, while the late providers carry out the contract’s signature at home in 30% of cases. At last, third sector providers with a work integration mission tend to sign the contract more frequently by mail (in more than 50% of cases) than do public providers with the same mission (10% of cases).
4. Conclusions
The service voucher scheme is an interesting research field because of its twofold dimension: developing proximity services (housework) and raising employment. Given this characteristic, it’s not astonishing to find providers from different types, in terms of sector (third, public and for-profit sector) and mission (home care, work integration,…) competing on this quasi-market. Moreover, because of the lack of regulation of the service voucher scheme (by comparison to foreign quasi-markets), it seems possible to better grasp the effects of the sector and the (social) mission on the organisational practices and on the “wide” production of each type of provider.
Concerning these aspects, this paper shows some first interesting results in terms of quality of jobs and quality of services which permit to differentiate providers. First, as noticed with the different dimensions concerning job’s quality treated in this paper, providers are differentiating themselves in terms of the quality of job they offer. It will be soon possible to show it more clearly by processing completely our data and by taking more dimensions into account. It is however already possible to note important differences mainly between providers following a social mission and the others. The former ones, by offering more training and more supervision than the latter and by giving to their workers the opportunity to get a more stable job contribute to the general interest. They indeed tend to give jobs of better quality to the segment of the workforce composed of the low qualified/educated people and they therefore improve social cohesion. Moreover, some aspects of job quality are also important through the impact they generate on service quality. More trained and supervised workers will undoubtedly have a positive impact on service quality. However, there is sometimes a trade-off between job and service quality. Flexibility, for instance, can sometimes only be reached through a less quality job. In order to improve this dimension, the workers could for instance have to provide services in the evening or during the weekend. Similarly, user’s satisfaction is sometimes strongly linked with their possibility to choose and change of worker at their will and following their own judgment criteria (which can sometimes be discriminatory). Organizations permitting this of course cause a negative impacts on job quality. The relation between job and service quality is thus not always straightforward.
As for the quality of services, we showed that public sector providers tend to reach, more than other providers, the segment of the very aged persons. This is not, as such, an issue as long as these providers carefully delineate the housework service and, if needed, redirect dependent users to a home care service. In this regard, the mission pursued by a provider seems to be of prime importance, as we observed that most of the home care providers, from the public and third sectors, are more prone than others to turn down the provision of tasks that exceed the scope of the service voucher. This interpretation is corroborated by the high percentage of home care providers that carry out a home inspection before the commencement of the provision. This proper delineation of the housework service can be understood as a contribution of these non-profit providers to the general interest, in that they tend to make
sure that the different types of users benefit from a service that fits adequately to their needs, thereby supposedly helping seniors to remain at home longer. Aside from that, public providers that pursue a mission of work integration (such as local employment agencies or local welfare offices not registered as home care provider) tend to permit the provision of unauthorized tasks and, consequently, to confuse the two types of services, which may represent a major concern for frail users (and their house workers). As for the for-profit sector, we noticed that they do not reach, by priority, the group of elderly people, probably due to the additional burden (ordering vouchers, etc.) that this type of clients may generate. Seemingly, this type of providers focuses primarily on the solvency and the ability of customers to properly manage the system. However, for-profit providers are the more “wide-open” sector in terms of provision of unauthorized tasks, though the temporary work agencies seem to behave distinctively from other commercial companies. Moreover, in one case out of two, providers with a profit mission set up the service at the distance (by mail). It should be noted, though, that 30% of providers with a profit mission do not authorize extra-tasks and 20% complete a home inspection.
The elements presented in this paper are the first steps in order to catch the “wide” production of providers, which has to be compared with the financial supports received. By comparing providers’ global performance, it is then possible to question the argument of the for-profit sector’s claiming that the third and public sectors are over-subsidised. According to Gadrey (2004), when for profit organizations compete with public or not for-profit providers, the only justification that one can advance to grant public funding without threatening the principle of fair competition, indeed lies in the observable existence of contributions to the general interest, that for-profit enterprises do not pursue, or at least less effectively than public or third sectors providers. Consequently, with the introduction of quasi-markets mechanisms in the field of proximity services, a comparative analysis such as the one provided here becomes a necessary prerequisite for the recognition of the non-profit and, in particular, the third sector providers’ legitimacy. First trends have been presented in this paper. However these must still be confirmed in the future…
Bibliographical references
Commission Européenne (1999), Evaluer les programmes socio-économiques Vol.1, 2, 3 et 6, Office des publications officielles des Communautés européennes, Luxembourg.
Defourny, J., P., Develtere & B., Fonteneau (Eds.) (1999), L'économie sociale au Nord et au
Sud, De Boeck & Larcier, Paris/Bruxelles.
Defourny, J. & Nyssens, M. (2001), "Belgium: social enterprises in community services", in C. Borzaga, & J. Defourny, (Eds), The Emergence of Social Enterprise, Routledge, Londres, 47-65.
Flynn, R. & Williams, G. (Eds.) (1997), Contracting for Health: Quasi-Markets and the NHS, Oxford University Press, Oxford.
Gadrey, J. (1990), "Rapports sociaux de service : une autre régulation", revue économique 41:1, 48-69.
Gadrey, J. (1996), Services : la productivité en question Desclée de Brouwer, Paris.
Gadrey, J. (2004), L’utilité sociale des organisations de l'économie sociale et solidaire. Une
mise en perspective sur la base de travaux récents.
Gilain, B & Nyssens, M (2001), "Belgique : l'histoire d'un partenariat associatif-public ", in J-L. Laville & M. Nyssens (Eds.), Les services sociaux entre associations, État et marché,
l’aide aux personnes âgées, La Découverte, Paris, 47-65.
Greenaway, D. (1991), "Markets and Quasi Markets in Social Services: Editorial Note", The
Economic Journal, 101:408, 1254-1255.
Idea Consult (2006), Evaluation du régime des titres-services pour les services et emplois de
proximité 2005 – Rapport final, Bruxelles.
Idea Consult (2007), Evaluation du régime des titres-services pour les services et emplois de
proximité 2006 - Rapport final, Bruxelles.
Jetté, C. & Lévesque, B. (2003), "Les rapports de consommation et la participation des usagers", in Y. Vaillancourt, F. Aubry & C. Jetté (Eds.), L’économie sociale dans les services
à domicile, Presses de l’Université du Québec.
Knapp, M., Hardy, B. & Forder, J. (2001), "Commissioning for Quality: Ten Years of Social Care Markets in England", Journal of Social Policy: 30.
Laville, J-L & Nyssens, M (2001), "États-providence et services sociaux", in J.-L. Laville & M. Nyssens (Eds.), Les services sociaux entre associations, État et marché, l’aide aux
personnes âgées La découverte, Paris.
Laville, J.L. & Nyssens, M. (2006), "Services de proximité ", in J.-L. Laville & A. D. Cattani (Eds.), Dictionnaire de l’Autre Economie, Desclée de Brouwer collection folio actuel, Paris, 561-571.
Le Grand, J. (1982), The strategy of equality, Allen and Unwin, London.
Le Grand, J. (1991), "Quasi-markets and Social Policy", The Economic Journal, 101:408, 1256-1267.
Maarwell N., McInerney P.-B. (2005), “The Nonprofit/For-Profit Continuum : theorizing the dynamics of Mixed-Form Markets”, Nonprofit and voluntary sector quarterly, vol. 34, n°1, p.7-28.
Marée, M. (2006), "Les impacts collectifs de l'insertion. Définition, typologie et techniques de mesure", in I. Nicaise, M. Nyssens & M. Marée (Eds.), Economie sociale, inclusion sociale et
intérêt général, Politique Scientifique Fédérale / Academia Press, Gand.
McMaster, R. (2002), "The Analysis of Welfare State Reform: Why the « Quasi-Markets » Narrative Is Descriptively Inadequate and Misleading", Journal of Economic Issues, 36:3. Netten A., McDaid D., Fernandez J.-L., Forder J., Knapp M., Matosevic T. & J., Shapiro (2005), "Measuring and Understanding Social Services Outputs", PSSRU Discussion Paper
2132/3.
ONEM (2006), Rapport Annuel 2006, Bruxelles.
PriceWaterhouseCoopers (2007), Audit financier du système des titres-services pour les
emplois et services de proximité.
Rossi, P. & Freeman, H. (1989), Evaluation: A systematic approach, Sage Publication, Thousand Oaks.
Stone, M. & Cutcher-Gershenfeld, S. (2001), "Challenges of Measuring Performance in Nonprofit Organizations", in P. FLYNN & V.A. Hodgkinson (Eds.), Measuring the Impact of
the Nonprofit Sector, Academic/Plenum Publishers, New-York.
Vanvelthoven, P. (2007), Communiqué de presse du ministre lors de la présentation de l'audit financier du système des titres-services, 16/07/2007.
Vermer, M., Nassaut, S., Nyssens, M (2008), "Les effets d’une coexistence de différents modes de régulation, suite à la création d’un quasi-marché dans le secteur de l’aide à domicile belge. Le cas des Services d’aide aux familles et aux personnes âgées", "Economies et