--Manuscript
Draft--Full Title: Determination of Physico-biochemical Proprieties and Composition in Volatile Constituents by Solid Phase Micro-Extraction of Honey Samples from Different Botanical and Geographical Origins in Morocco
Manuscript Number: TJAR-2018-0201R1
Article Type: Original research article
Keywords: Morocco, Honey, Botanical Origin, Volatile compounds, SPME-GC-MS
Manuscript Classifications: Biochemistry and chemical ecology; Hive product science
Abstract: There is a very few information available on the physicochemical proprieties and biochemical composition of the honey commercially available which are truly endangered in Morocco. None of the studied honey is available for commercial
purposes, which is the main interest and novelty of this study. The aim of this work is to characterize and classify 47 honey samples collected from different localities in Morocco and to compare them with 2 foreign samples honey from Ghana and France, based on their physicochemical proprieties, phenolic contents, radical scavenging activity and volatile compounds by SPME-GC/MS were used to evaluate the quality and cluster all honey samples. Variance analysis revealed highly significant differences between samples (p<0.05). Monofloral honey was characterized by the higher
concentration of proline (292.77±13.30). Mutifloral honey from France showed higher amounts of diastase (17.50±1.80) than other compounds, while eucalyptus honey had higher amount of HMF (105.14±3.7) than the others multifloral honey from Ghana honey showed higher content of phenol total (149.31±0.41) mg GAE/100g and flavonoids content (58.28±2.6mgRu/100g) than carotenoids (40.76±0.7) mg Eβ-carotene/100g). Thyme honey showed the higher phenol content (70.97±1.35) mg GAE/100g, flavonoids content (47.18±2.43) mg ERu /100g) and carotenoids content (74.94±3.08mEβ-carotene) than other monofloral honey and glucose honey examined. The principal components analysis (PCA) was performed in order to classify honey samples and identify the most discriminant parameters. Lastly, using ANOVA and correlations for all parameters, significant differences between diverse types of honey were examined. Biochemical and SPME/GC/MS methods were used to propose a complementary approach for honey classification.
Order of Authors: hanine hafida, PH D
Fauconnier Marie Laure, Pr Kenne tierry, DR
Rizki hajar, Dr Ouradi hamza, Dr Ennahli said, Pr Hssaini Lahcen, Dr
List of changes (classified in several items) according to the first reviewer comments Item : free radical scavenging
Line numberOld statementNew statementComment
137All honey samples were collected from market. Honey samples were kept at 4-5°C until analysisAll honey samples were collected from market and local produced at different region. All samples were packed in glass bottles (100g/ honey/type) and stored in dark room at 4-5°C until analysisThe conditions of sampling are specified and completed
159
Proline content is determined calorimetrically according to (Von der Ohe et al., 1991) method. Proline was calculated following formulaProline content was determined calorimetrically according to (Von der Ohe et al., 1991) and calculated following formula:there are errors in the writing and in the grammar.
1972.3.4. DPPH radical scavenging assay2.3.4. DPPH free radical scavenging activityThe titled has been changed following the reviewer comment. Free radical scavenging are used instead of antioxidant activity, since the latter is a broad term of which free radical scavenging activity using DP
PH is one of several methods used to evaluate this aspect
308-210-The results are also expressed as using a mg of Trolox equivalent per 100g of extract following formula The equation used to convert % inhibition to trolox equivalent per extract (cited in the table 4, was added
453-454Freeradical-scavenging activities
of the different honey from different botanical origin
Free radical-scavenging activities using DPPH method (mg trolox equivalent/ 100g of exract) of the different honey from different botanical originIn the same context as above, the title of Table 4 was changed to be more explicit in the light of the first reviewer comments.
248Free antioxidant activity (mg ET/100gFree radical scavenging activity (mg Trolox eq. /100g)Same comments above (Table 2)
Item : Statistical analysis (use of the mean square and ***) Line numberOld statementNew statementComment
245Duncan testpost hoc Duncan multiple-rangeFor more explicitness
248Descriptive analysis and analysis of variance of evaluated samplesDescriptive analysis and analysis of variance (mean squares) of evaluated samplesthe expression “(mean squares)” was added in order to make a reference to the fact that the table presents the ANOVA results as a mean squares followed with asterisks to mention the level of significant of the test
248*** are presented over the mean square and denotes significant of difference at level of 0.001 according to analysis of variance.This expression was added in the foot of the table 2. In fact, ANOVA results are usually presented as F and P value or as a mean square with asterisks that refer to the level of significance of the test (ANOVA one way as is the case of this work)
Line numberOld statementNew statementComment
252-253 -The post hoc Duncan multiple-range test showed significant pairwise differences and classify simples into 21 homogenous subsetsThese statements were
343The expression table 2b was deleted.
Item : Principal component PCA (PCA)
Line numberOld statementNew statementComment
515Principal components Principal components (PC)“(PC)” was added in the table to explain the use of this abbreviation which means “principal component”
PC1 and PC2principal components …PC1 and PC2first and the second principal components PC1 and PC2….
tem : other changes
Line numberOld statementNew statementcomment
340 Data are the mean of three replicationsAverage values ± standard errors of mean of three replicationsSample change for a better understanding.
451 . 3.6
Around 30 major volatile compounds were identified and semi quantified in the volatile fractions of honey samples
3.6. Volatile compounds characterization
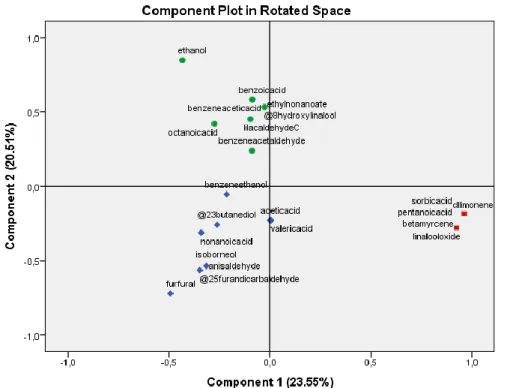
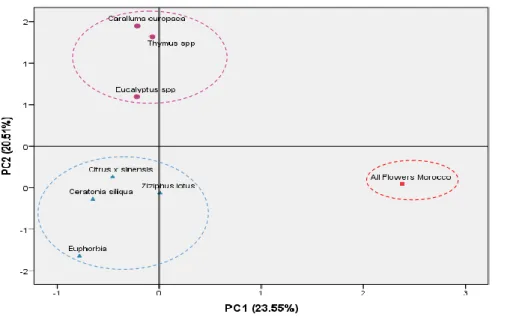
HS-SPME method combined to GC-MS analysis allowed identification of about 30 compounds in honey samples which relative amounts are determinated based on percentage area. Identified compounds include alcohols, aldehydes, ketones, acids, esters, terpenes and nitrogen compounds are shown in Table 5
New table 5
Complete quantification of VOCs using HS-SPME in complex mixture as honey was nearly impossible even if the technique is very sensitive and practical than others. Indeed, it is very difficult to get the recovery rate of any individual compound using the SPME-fiber. Secondary, as a complex mixture of VOCs, each compound of honey compete against each other during the sampling step. In result some 'weaker' VOCs
3.Response:
It seems to be a typing error and values in table have been displaced. We would like to write: Table 5
Type of honeyCompoundCAS numberPercentage % Caralluma europaeaEthanol64-17-539.2
lilac aldehyde A53447-45-3 8.6 lilac aldehyde D3447-48-6 6.6 nonanoic acid112-05-08.7 benzoic acid,65-85-0 2.0 Eucalyptus sppethanol64-17-518.5 lilac aldehyde C78-59-114.5 benzeneacetaldehyde122-78-16.3 benzeneethanol60-12-85.7 nonanoic acid112-05-011.0 ethanol64-17-538.5 Thymus spp8-hydroxylinalool103619-06-33.9 ethyl nonanoate123-29-510.4 lilac aldehyde C53447-47-56.1 benzeneacetic acid103-82-22.4 ethanol64-17-520.4 Citrus x sinensisfurfural98-01-16.3 benzeneethanol60-12-814.5 nonanoic acid112-05-010.4 2,5-furandicarbaldehyde823-82-52.2 ethanol64-17-512.7 Ceratonia siliquafurfural98-01-114.4 2,3-butanediol513-85-94.5 nonanoic acid112-05-010.5 octanoic acid124-07-27.7 ethanol64-17-513.3
Ziziphus lotusacetic acid64-19-79.5 (z)-linalool oxide5989-33-36.3 furfural98-01-18.1
pentanoic acid109-52-413.2 ethanol64-17-511.1
Running head: Biochemical and volatile honey profile
Determination of Physico-biochemical Proprieties and Composition in Volatile Constituents 1
by Solid Phase Micro-Extraction of Honey Samples from Different Botanical and 2
Geographical Origins in Morocco 3
4 5
Hanine Ha*, Fauconnier M Lb,Kenne Tb, Rizki Ha, Ouradi Ha,EnnahliSc, HssainiLa,d 6
7
aLaboratory of Bio-interfaces and Bioprocessing, My Sliman University, Faculty of Sciences 8
and Technics, BO 523 BeniMellal, Morocco 9
bLaboratory of Volatolomic, Gembloux AgroBiotech, University of Liege, Passage des 10
Déportés, 25030 Gembloux, Belgium 11
cNational School of Agriculture, ENA, Meknes, Morocco 12
d National Institute of Agricultural Research (INRA), Meknes, Morocco 13
14
*Corresponding author: hafidahanine0@gmail.com
15 16 17 18
The authors are grateful to the Agricultural Cooperative of Afourer (Morocco) for providing 19
samples and support in this collecting necessary information about local honey. The technical 20
support of the faculty of Gembloux Agro Biotech of LiegeUniversity (Belgium) for technical 21 support. 22 23 24
1
2
3
4
5
6
7
8
9
10
11
12
13
14
15
16
17
18
19
20
21
22
23
24
25
26
27
28
29
30
31
32
33
34
35
36
37
38
39
40
41
42
43
44
45
46
47
48
49
50
51
52
53
Abstract 25
26
There is a very few information available on the physicochemical proprieties and 27
biochemical composition of the honey commercially available which are truly endangered in 28
Morocco. None of the studied honey is available for commercial purposes, which is the main 29
interest and novelty of this study. The aim of this work is to characterize and classify 47 30
honey samples collected from different localities in Morocco and to compare them with 2 31
foreign samples honey from Ghana and France, based on their physicochemical proprieties, 32
phenolic contents, radical scavenging activity and volatile compounds by SPME-GC/MS were 33
used to evaluate the quality and cluster all honey samples. Variance analysis revealed highly 34
significant differences between samples (p<0.05). Monofloral honey was characterized by the 35
higher concentration of proline (292.77±13.30). Mutifloral honey from France showed higher 36
amounts of diastase (17.50±1.80) than other compounds, while eucalyptus honey had higher 37
amount of HMF (105.14±3.7) than the others multifloral honey from Ghana honey showed 38
higher content of phenol total (149.31±0.41) mg GAE/100g and flavonoids content 39
(58.28±2.6mgRu/100g) than carotenoids (40.76±0.7) mg Eβ-carotene/100g). Thyme honey 40
showed the higher phenol content (70.97±1.35) mg GAE/100g, flavonoids content 41
(47.18±2.43) mg ERu /100g) and carotenoids content (74.94±3.08mEβ-carotene) than other 42
monofloral honey and glucose honey examined. The principal components analysis (PCA) 43
was performed in order to classify honey samples and identify the most discriminant 44
parameters. Lastly, using ANOVA and correlations for all parameters, significant differences 45
between diverse types of honey were examined. Biochemical and SPME/GC/MS methods 46
were used to propose a complementary approach for honey classification. 47
There is a very few information available on the physicochemical proprieties and biochemical 48
composition of the honey commercially available which are truly endangered in Morocco. 49
None of the studied honey is available for commercial purposes, which is the main interest 50
6
7
8
9
10
11
12
13
14
15
16
17
18
19
20
21
22
23
24
25
26
27
28
29
30
31
32
33
34
35
36
37
38
39
40
41
42
43
44
45
46
47
48
49
50
51
52
53
and novelty of this study. The aim of this work is to characterize and classify 47 honey 51
samples collected from different localities in Morocco and to compare them with 2 foreign 52
samples honey from Ghana and France, based on their physicochemical proprieties, phenolic 53
contents, radical scavenging activity and volatile compounds. Spectrophotometric methods 54
and solid phase micro-extraction SPME-GC/MS were used to evaluate the quality and cluster 55
all collected honey samples. Variance analysis revealed highly significant differences between 56
samples (p<0.05). Monofloral honey was characterized by the higher concentration of proline 57
(292.77±13.30). Mutifloral honey from France showed higher amounts of diastase 58
(17.50±1.80) than other compounds, while eucalyptus honey had higher amount of HMF 59
(105.14±3.7) than the others multifloral honey from Ghana honey showed higher content of 60
phenol total (149.31±0.41) mg GAE/100g and flavonoids content (58.28±2.6mgRu/100g) 61
than carotenoids (40.76±0.7) mg Eβ-carotene/100g). Thyme honey showed the higher amount 62
of phenol content (70.97±1.35) mg GAE/100g, flavonoids content (47.18±2.43) mg ERu 63
/100g) and carotenoids content (74.94±3.08mEβ-carotene) than other monofloral honey and 64
glucose honey examined. The principal components analysis (PCA) was performed in order to 65
classify honey samples and identify the most discriminant parameters. Lastly, using ANOVA 66
and correlations for all parameters, significant differences between diverse types of honey 67
were examined. Biochemical and SPME/GC/MS methods were used to propose a 68
complementary approach for honey classification. 69
Keywords:Morocco,Honey, Botanical Origin, Volatile compounds, SPME-GC-MS 70
71 72
Introduction
73
Honey is the natural sweet substance produced by honeybees from the nectar of 74
blossoms or from the secretion of living parts of plants or excretions of plant sucking insects 75
on the living parts of plants. For the formation of honey, honeybees collect, transform and 76
6
7
8
9
10
11
12
13
14
15
16
17
18
19
20
21
22
23
24
25
26
27
28
29
30
31
32
33
34
35
36
37
38
39
40
41
42
43
44
45
46
47
48
49
50
51
52
53
combine the secretion of plants or the nectar of blossoms with specific substances of their 77
own, store and leave in the honey comb to ripen and mature (Codex alimentarus, 2001). 78
Consisting of a complex mixture of carbohydrates (80-85%) (White etDoner, 1980), most 79
important sugars existed in honey are fructose and glucose. Also, honey contains water, 0.1-80
0.4% protein, 0.2% ash and minor quantities of amino acids, enzymes and vitamins (White 81
etDoner, 1980; Jeffrey and Echazarreta, 1996; Gheldof, etal., 2002; James, 2009). A wide 82
range of minor constituents is also present in honey, which many of them are known to have 83
antioxidant properties. These minor constituents include phenolic acids and flavonoids 84
(Martos et al., 2000), the phenolic compounds of honey are collected first by the bees from 85
the plants. The total phenolic content in honey is strongly correlated with its antioxidant 86
activity (Beretta et al., 2005; Bertoncelj et al., 2007; Meda et al., 2005). Honey is considered 87
to be one of the nature’s original sweetener, it has been used as a food for at least six thousand 88
(Grahan, 1992). It was reported that honey is rich with two classes of phenolic acid: 89
substituted benzoic acids and cinnamic acids, and flavonoids. Those compounds could be 90
considered as potential markers for the botanical origin of honey (Alvarez-Suarez et al., 91
2012). Flavonoids reported in honey are flavonols, flavonones and flavones, they contribute 92
on the pigmentation, taste and flavor of honey (Estevinho et al., 2008). These minor 93
constituents are known to have distinctive nutritional or medicinal properties (James etal., 94
2009). However, the specific composition depends on many factors, such as the nectar 95
composition of the plant source, bee species, the climate, environmental and seasonal 96
conditions, agricultural practices and treatment of honey during extraction and storage 97
(Marchinietal., 2006; Iglesias and al., 2012). 98
Honey is one of the most targeted commercial product for nutritional, medicinal and 99
industrial purposes.The chemical and physical properties of honey influence positively honey 100
healing capacity, with a great role in the treatment of burns, gastrointestinal disorders, 101
6
7
8
9
10
11
12
13
14
15
16
17
18
19
20
21
22
23
24
25
26
27
28
29
30
31
32
33
34
35
36
37
38
39
40
41
42
43
44
45
46
47
48
49
50
51
52
53
respiratory illnesses, infected and chronic wounds (Castaldo&Capasso, 2002; Orhan et al., 102
2003; Ramalhosa et al., 2011). The antibiotic properties of honey have been scientifically 103
proven (MolanetBetts, 2004). The antimicrobial effectiveness reported have been evaluated 104
with diverse setsof methodologies, degrees of sensitivity and microbial strains, what leads to 105
difficulties comparing results from work teams (Vargas et al., 2007). 106
Aroma compounds are also present in honey at very low concentrations as complex 107
mixtures of volatile components different in their chemical structure and, with a relatively low 108
molecular weight. Regarding the composition of volatiles, authors report that same volatile 109
components are present in the majority of honey, although the mutual proportions of these 110
substances can be different (Verzera et al. 2001; De la Fuente et al. 2005; Radovic et al. 2001; 111
Soria et al. 2002, 2004; Thrasyvoulou et al. 2002; Anklam 1998; Piasenzotto et al. 2003; 112
Overton, Manura 1999). Similarly, some components are specific to only one type of honey. 113
So, the composition of volatile compounds of honey could be used as biomarkers to determine 114
its botanic origin. The composition and properties of a particular honey sample depend 115
highly on the type of flowers visited by the bees as well as on climatic change. Honeybees 116
and their products can also be employed as potential bioindicators of environmental 117
contamination. These specific chemical and physical properties could be used for the 118
determination of the botanical origin of honey (Marcelo E C et al, 2007) 119
Each type of honey with different origin has been affirmed with the occurrence of at 120
least 113 volatile compounds belonging to the following classes of compounds: acyclic and 121
monocyclic monoterpens and their oxygenated derivatives, furan and sulfuric derivatives, 122
aliphatic, aromatic and nitrogenous compounds. Even if the large number of these compounds 123
were reported in previous studies, only some of them could be considered as potential markers 124
of the botanical origin of a given type of honey. 125
6
7
8
9
10
11
12
13
14
15
16
17
18
19
20
21
22
23
24
25
26
27
28
29
30
31
32
33
34
35
36
37
38
39
40
41
42
43
44
45
46
47
48
49
50
51
52
53
For quality control of honey, several physical and chemical features, which mostly 126
include water content, enzyme activity of invertase, hydroxymethylfurfural (HMF), electrical 127
conductivity, and sugar composition, have to be determined but very few studies have 128
analyzed physical and chemical properties of some honey, but none of them have determined 129
the biochemical parameters of the different varieties of honey in Morocco. So, the aim of the 130
current study was to evaluate the biochemical composition and the antioxidant activity of 131
different types of honey, and also to identify the volatile composition honey using SPME-GC-132
MS techniques to eventually identify the biomarkers of each variety of honey. The goal of 133
the present work was first, to verify some of the qualitative parameters such proline, HMF, 134
diastase, and second, to contribute to the very scarce available data on volatiles compounds 135
content of Morocco region honey. Furthermore, we have evaluated if the physicochemical, 136
biochemical parameters and volatiles compounds content of Morocco honey can determine 137
the botanical origin. The sampling protocol was made up in order to obtain the most 138
representative insight of the sampled regional areas. All samples were collected in Morocco 139
regions. 140
In the present work, 47 samples of honey within a defined area of Morocco were 141
collected and two multifloralhoney samples from Ghana and France. The influence of 142
botanical origin and technical practice on (i) biochemical composition and volatile organic 143
compounds, (ii) the nutritional and elemental composition of honey wasanalyzed. We used 144
methods of multivariate analysis, such as cluster and discriminants analysis, and attempted to 145
track differences (if any), both between individual samples of honey. 146 147 148 149
6
7
8
9
10
11
12
13
14
15
16
17
18
19
20
21
22
23
24
25
26
27
28
29
30
31
32
33
34
35
36
37
38
39
40
41
42
43
44
45
46
47
48
49
50
51
52
53
Materials and methods
150
Honey Samples
151
The study was conducted on 47 samples of the typical honey produced in Different 152
locality of Morocco. The honey samples came from various botanical origins;They include 153
seven unifloral and multifloralhoney( Table.1): Carallumaeuropaea honey, Eucalyptus spp 154
honey , Thymespp honey , Citrus x sinensis honey ), Ceratoniasiliqua honey, Ziziphus lotus 155
honey , Euphorbia honey, multifloralhoney samples,multifloralforeign honeysamples (GTf-156
from Ghana and , FTF ( honey from France)) and syrups sugar honey (SY). All honey 157
samples were collected from market and local produced at different region. All samples were 158
packed in glass bottles (100g/ honey/type) and stored in dark room at 4-5°C until analysis. 159
Honey samples were kept at 4–5°C until analysis. All tests were performed in triplicate. 160
161
Table.1. 162
Botanical and geographical origins of studied honeysamples 163
Honey type Locality Area
Carallumaeuropaea -TzDg 1,2,3 -Morocco - Tiznit Eucalyptusspp - Jdeuc1,2,3 - Ceuc1,2,3 - Morocco - Morocco - El Jadida -Casablanca Thymusspp - TiTh1,2,3 - AssTh1,2,33 - Morocco - Morocco -Azilal - Tinghir Citrus x sinensis - BaOr1,2,3
- ByOr1,2,3 - Morocco - Morocco - BeniMellal - BeniMellal Ceratoniasiliqua -KbCa1,2,3 - ZeCa1,2,3 - AdCa1,2,3 - Morocco - Morocco - Morocco - Khenifra - Beni Mellal - Beni Mellal Ziziphus lotus - FbJu1,2,3 - Morocco - FkihBensalah
Euphorbia - BtEup1,2,3 - BzEup1,2,3 - BkEup1,2,3 - Morocco - Morocco - Morocco - Beni Mellal - Azilal - Beni Mellal multifloralhoney -MTf - FoTf, FeHe, ML - FTf, PE - GTfMTf - Morocco - Morocco -France -Ghana -FkihBensaleh - FkihBensalah
Formatted: Font color: Custom Color(RGB(68,114,196)) Formatted: Font color: Custom Color(RGB(68,114,196)) Formatted: Font color: Custom Color(RGB(68,114,196)) Formatted: Font color: Custom Color(RGB(68,114,196))
6
7
8
9
10
11
12
13
14
15
16
17
18
19
20
21
22
23
24
25
26
27
28
29
30
31
32
33
34
35
36
37
38
39
40
41
42
43
44
45
46
47
48
49
50
51
52
53
Syrups sugar honey - Sy - Morocco
2.2. Physicochemical analysis
164
The HMF, diastase activity, and Proline were determined according to Association of Official 165
Analytical Chemists (AOAC) methods. 166
2.2.1 Hydroxy Methyl Furfural (HMF) content 167
The HMF content measurement is based on the absorbance at 284 nm according to White 168
method( White and Doner, 1980). HMF content (mg/Kg of honey) is calculated as follows : 169
HMF = (A284 nm - A336 nm) × 149.7 × 5 × D. 170
Where A284 nm and A336 nm correspond to absorbance levels of sample solution at 284 and 171
336 nm respectively, the constant of 149.7 was derived from the molecular weight of HMF 172
and the molar absorptivity of HMF at λ=284 nm and finally D is the dilution factor. 173
174
2.2.2.DiastasicIndex (Bogdanov et al, 1997). 175
The diastase index(DI) was determined according to (Bogdanov and al, 1997) by monitoring 176
the absorbance at 660 to reach 0.235. A plot of absorbance against time, or a regression 177
equation, was used to determine the time (tx) required to reach the specified absorbance, 178
0.235. The Diastase Number (Schade unit) is calculated as 300 divided by tx 179
2.2.3.Proline content 180
Proline content is determined calorimetrically according to(Von der Ohe et al., 1991)method. 181
Proline content was calculated by following formula: 182 Proline (mg/Kg) = (Ps/A) × (P/P2) × 80 183
6
7
8
9
10
11
12
13
14
15
16
17
18
19
20
21
22
23
24
25
26
27
28
29
30
31
32
33
34
35
36
37
38
39
40
41
42
43
44
45
46
47
48
49
50
51
52
53
Where Ps is absorbance of the sample solution, A is the average of the two absorbances. 184
Measurements for the proline standard solution, P is the mg of proline taken for the stoke 185
solution, P2 is the weight of honey in grams and 80 is the dilution factor. 186
2.2.4. Honey color measurement 187
The honey color was measured by a spectrophotometric measurement according to(White 188
method 1980). Honey samples were heated to 45°C to dissolve sugar crystals; and the color 189
was determined using by spectrophotometer using(Spectra physic, Jasco) of the absorbance of 190
50% Diluted honey solution (w/v) at 635 nm. The honey was classified according to the 191
Pfund scale after conversion of the absorbance values 192
mm Pfund = 38.70 - 371.39 × Abs 193
Where the Pfund is the intensity of the honey color in the pfund scale and Abs is the 194
absorbance at 635 nm. 195
2.3. Phytochemical analysis
196
2.3.1.Total phenolic content 197
The total phenolic content (TPC) was determined with Folin-Ciocalteu reagent by 198
absorbance measurement at 725nm using gallic acid as standard as described by (Velioglu and 199
al. 1998) with minor modification. Each 1 g of honey sample was diluted to 10 mL with 200
distilled water. 0.5 mL of honey solution was then mixed with 3.7 mL of Folin-Ciocalteu 201
reagents. After incubation for 5 minutes, 3.7 mL of 60% w/v aqueous sodium carbonate 202
solution was added and the mixture was incubated at room temperature for 90 minutes. The 203
absorbance of the reaction mixture was measured and total phenolic content was expressed in 204
mg of gallic acid equivalent (GAE) per kg of honey. 205
206
2.3.2.Total flavonoids content 207
Total flavonoid content (TFC) was determined usingrutin as the standard at 430nm according 208
to (Djeridane et al 2006). A1 % honey solution was prepared in warm water (0.4g/mL) and 209
6
7
8
9
10
11
12
13
14
15
16
17
18
19
20
21
22
23
24
25
26
27
28
29
30
31
32
33
34
35
36
37
38
39
40
41
42
43
44
45
46
47
48
49
50
51
52
53
mixed with 1mL of aluminum chloride (2%) diluted with methanol. The results were 210
expressed in mg rutin equivalent per100g of honey. 211
212
2.3.3. Determination of carotenoids content
213
The carotenoids extraction was carried out using the method of (Soto-Zamora et al 2005) 214
where 0.1 g of honey was dissolved in 10 mL in a solvent mixture with different percentages 215
(hexane: 50%, ethanol: 25% and acetone 25%), after the addition of 0.5mL of 1M KOH the 216
mixture was stirred for 90 minutes and the absorbance was measured at 470 nm. the results 217
are expressed in mg of β-carotene equivalent / g of honey. 218
219
2.3.4. DPPH free radical scavenging assayactivity 220
The antioxidant activity of honey samples in the presence of the stable free radical DPPH was 221
measured as described previously (Hartmann, 2007). Briefly, 1.25 mL of honey solution was 222
dissolved in distilled water (0.025 g/mL) and was mixed with 1.5 mL of a 60mM solution of 223
DPPH in methanol. After 5 min, the absorbance was read at 517 nm against water/methanol 224
(1:1 v/v) blank. For the control sample, 1.25 mL of methanol was mixed with 1.5 mL DPPH. 225
After 30mn the remaining DPPH radicals were quantified by measuring the absorption at 517 226
nm. The antioxidant activity of honey was expressed as a percentage of inhibition and was 227
calculated using the following formula (Meda et al, 2005) 228
% inhibition = [(A0 -A1)/A0] *100, where A0 was the absorbance of the control solution and 229
A1 was the absorbance in the presence of the sample and standards. 230
The results are also expressed as using a mg of Trolox equivalent per 100g of extract 231
following formula : 232
233 234
2.4. Volatile compound analysis: Extraction and GC–MS analysis
235
6
7
8
9
10
11
12
13
14
15
16
17
18
19
20
21
22
23
24
25
26
27
28
29
30
31
32
33
34
35
36
37
38
39
40
41
42
43
44
45
46
47
48
49
50
51
52
53
Static headspace extraction of volatile compounds was performed by using solid phase 236
microextraction (SPME) with a 65µm Divinylbenzene / Carboxen / Polydimethylsiloxane 237
(DVB/CAR/PDMS) fiber. The analysis of the honey components was carried out by gas 238
chromatography-mass spectrometry (GC-MS) using a gas chromatography Agilent 7890A 239
with masse selective detector 5975Network MSD and coupled to an automatic sampling 240
system MPS (Gerstel), a polyethylenglycol capillary column VF-WAXms (30 m x 0.25 mm 241
i.d. x 0.25 μm film thickness) and a split/splitless injector, and the Library pal600k. About 1g 242
of the investigated sample was placed into a 20ml vial closed with a screw and heated to 60°C 243
for 20 minutes and the fiber was then exposed to honey headspace. After 20 min, the SPME 244
fiber was automatically withdrawn from the vial and introduced into the GC injector. 245
Working conditions were :splitless mode with injector temperature at 250°C, the oven 246
temperature program was 50°C for 4 minutes, rising at 5°C/minute to 230°C (held for 10 247
minutes) ; then rising at 10°C/minute to 250°C ; and finally, 3 minutes at 250°C, a constant 248
flow of 1 ml/minute (helium) was set up. Mass spectra were recorded in EI mode at 70 eV, 249
scanning the 35-395 m/z range. The interface and source temperature were 230 and 250°C, 250 respectively 251 252 2.5. Statistical analysis 253
Since analysis have been performed using a different measure unit which make them having 254
unequal weights, data were standardized so that each variable has a mean of 0 and a standard 255
deviation of 1. 256
Data analysis was performed using SPSS v22. They were subjected to one-way ANOVA 257
followed by Duncan Multiple Range Test (DMRT) for comparison of their means tested at 258
95% confidence level. Correlation coefficients and their levels of significance were calculated 259
using Pearson correlation. Principal component analysis was carried out using correlation 260
Formatted: Line spacing: Double
6
7
8
9
10
11
12
13
14
15
16
17
18
19
20
21
22
23
24
25
26
27
28
29
30
31
32
33
34
35
36
37
38
39
40
41
42
43
44
45
46
47
48
49
50
51
52
53
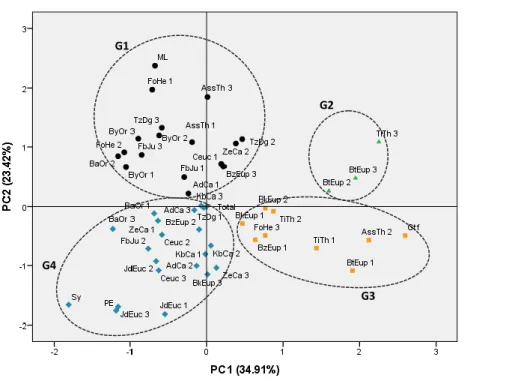
matrix and Varimax rotation method. Principal Component Analysis was used in order to 261
visualize the relative distribution of the honey samples according to their botanical 262
origin.The traditional approach is to use the first few PCs in data analysis since they capture 263
most of the variation in the original data set. 264
Results and discussion
265
Descriptive analysis
266
Results of characterization are summarized in Table 2. Important ranges of variation were 267
recorded for all variables, that showed a highly significant differences (p<0.0015) among 268
evaluated samples. According post hoc Duncan multiple-rangeto Duncan test, all variables 269
generated a high number of homogeneous groups that varied from 14 to 24. 270
Table.2 271
Descriptive analysis and analysis of variance (mean squares) of evaluated samples 272
Mini Max Mean Mean
Std. Deviatio n Mean Square Homogeneo us groups number internationa l standard limits (codex alimentariu s) HMF (mg/kg) 0.38 108.88 45.66 3.13 2052.32*** 21 Less than 40 mg/kg Proline(mg/kg) 0.35 302.15 191.1 0 15.48 7096.74*** 20 Less than 180 mg/kg Color (mm Pfund) 3.007 390.96 126.5 8 3.56 27780.32** * 20 Diastasic Index (UnitySchade) 0 20 3.49 0.55 23.9*** 14 Less than 8 Unity Schade Phenols (mg EAG/100 g) 0.58 150.35 50.31 2.93 1206.63*** 23 Flavonoides (mg ERu/100g) 0.03 84.06 28.63 3.33 624.69*** 21 Carotenoides (mg E β-carotene/100 g) 0 194.55 47.90 31.29 1956.97*** 24
6
7
8
9
10
11
12
13
14
15
16
17
18
19
20
21
22
23
24
25
26
27
28
29
30
31
32
33
34
35
36
37
38
39
40
41
42
43
44
45
46
47
48
49
50
51
52
53
Free Antioxidant Activityradical scavenging activity (mg Trolox Eq. ET/100g) 20.32 44.03 35.50 1.46 42.25*** 15
*** are presented over the mean square and denotes significant of difference at level of 0.001 according to analysis of variance.
273 274
HMF content varied from 0.38±0.4 to 108.88±3.9 mg / kg with an average of 45.66±3.13 275
(table.2). The post hoc Duncan multiple-range test showed significant pairwise 276
differencesand classify simples into 21 homogenous subsets. The highest value was 277
obtained with eucalyptus spp honey samples, however the lowest contentwas recorded by a 278
mutifloralhoney samples (0.38 ± 0.4 mg / kg)(FoHe 2). Hydroxymethylfurfural (HMF) is 279
naturally present in honey, it is derived from a fructose degradation in under acidic 280
condition and the postharvest associated trace levels reported range between 1 to 3 mg / kg 281
(Falicco et al 2004, Makhloufi et al, 2010). 282
The concentration of HMF is considered as an indicator of honey freshness (Corbella and 283
Cozzolino, 2006), because its content increases as honey is heated or aged (Marceau et al, 284
1994, khalil et al, 2010). As a tool to evaluate honey quality, international standards (Codex 285
Alimentarius Commission, 2001) have recommend a limit of 40 mg / kg. There was 40.82% 286
of measured samples with HMF concentration above the limit (40mg / kg), the sample ZeCa 3 287
(Ceratonia siliqua honey), old honey samples but not heated, showed a diastatic activity 288
greater than 8 schadewhich is the minimum value required by the (codex alimentarius, 2001) 289
commission. However, overheated samples showed a water content higher than 20% in water 290
contentwhich means there are easily degradable, Meanwhile; Although, 60% of the samples 291
had HMF contents below 40 mg / kg, suggesting there were fresh, but they have been stored 292
under poorly controlled temperature conditions because their diastatic activity is less than 8 293 schade. 294 Formatted: Left
6
7
8
9
10
11
12
13
14
15
16
17
18
19
20
21
22
23
24
25
26
27
28
29
30
31
32
33
34
35
36
37
38
39
40
41
42
43
44
45
46
47
48
49
50
51
52
53
Comparatively to our result, (Belhaj et al 2015) and ,(Terrab et al 2002) had reported that 295
HMF content ranged between 3.87 to 100mg/Kg and 3.8 to 48.44mg/Kg respectively 296
forhoney samples produced in TADLA-AZILAL region of Morocco of eucalyptus honey 297
sample from Moroccobut the highest value of HMF content was obtained in Algerian honey 298
samples with 9.6 and 157.4mg/kg of honey (Makhloufi 2001).The increase of HMF content 299
may be due to the temperate climate of the country, it was reported HMF production is a 300
natural phenomenon taking place progressively at room temperature and accelerated as 301
temperature increases regardless of Horney nature ( Perdrix, 2003) 302
Although, honey is thermally processed to eliminate yeast, it could result in product quality 303
deterioration. Uncontrolled heating alters the parameters such as hydroxymethylfurfural 304
(HMF) content and enzyme activity unfavorably. The initial HMF content in different honey 305
types varies drastically and it depends upon the climatic conditions of the region besides other 306
factors. Excessive amount of HMF has been considered as evidence of overheating, causing 307
browning and loss of freshness of honey. (R Subramania et al, 2007) 308
(Singh and Bath P.K. 1998). Regarding the relationship between heating and HMF formation 309
in different types of honey,heating temperature and time showed significant effect on HMF 310
formation. Similar studies on effects of thermal treatment of honey were conducted by (Tosi 311
et al, 2002). The authors reported HMF formation during the treatment process did not depend 312
on their initial amount in honey. 313
They also reported that during thermal processing, the time-temperature combination is very 314
crucial for maintaining the HMF level below the maximum permissible limit (Gupta et al., 315
1992). In the Other hand(Conrad et al., 2010), report that high level of HMF can cause DNA 316
damage in human cells and contribute to obesity and heart disease. It is worth mentioning that 317
HMF content is not an intrinsic property of honey, so it cannot be used for the determination 318
of botanical origin (Schweitzer et al., 2004). 319
6
7
8
9
10
11
12
13
14
15
16
17
18
19
20
21
22
23
24
25
26
27
28
29
30
31
32
33
34
35
36
37
38
39
40
41
42
43
44
45
46
47
48
49
50
51
52
53
Diastase is the natural enzyme (α and β amylase) catalyzing the degradation of 0.01g of starch 320
in 1h at 40°C and then viscosity loss in honey (FurkanYardibi, Gumus T, 2010). Diastase 321
activity in honey depends on the amount of nectar the bee processes at each period, 322
geographic and floral origins of the product (Escuredo, O.andal, 2011), (Diastase activity can 323
be used as an index of aging and temperature abuse, but with precaution, because its 324
variability is high (Gomes, S and al, 2010). 325
Diastase in honey converts long-chain sugars to short-chain sugars and the enzymes activity 326
hints with possible heating and/or poor storage
327
conditions(Sourcehttp://www.phadebas.com/areas-of-use/alimentary/diastase-in-honey) .lts 328
sensitivity towards temperature is very high. Diastase activity determination is used as a 329
parameter related to the freshness of honey, to its warming or storing condition (vorlova, L., 330
Pridal, A., 2002): 331
According to table 2, diastase activity of honey samples ranged from 0.00 and 17.5Schade 332
unit, with an average of 3.5 Schade unit. A limit of 8 units Schade is the minimum limit 333
required by international standards, with a tolerance of 3 Schade units for poor honey, 334
provided that the HMF content does not exceed 15 mg / kg. Around 8.16% of the samples 335
analyzed (Multiflowershoney from market (ML), AssTh 3 (Thyme honey), FoHe 336
1(multiflorals) and ZeCa 3(Ceratonia Z honey)) are above 8 Schade units, they have HMF 337
contents below 40 mg / kg with the exception of Ceratonia honey ZeCa 3 (Ceratonia Z) which 338
reflects the lack of heating of these honey, however 10, 20% of the honey studied (TzDg 3, 339
FoHe 2, ByOr 3, Fbju 3) had values greater than 3 Schade unit with HMF contents below 15 340
mg / kg which explains why they are naturally low in enzyme. On the other hand 42.85% of 341
the honey analyzed (PE, BtEup 3, KbCa 3, Ceuc 1, Fbju 1, TiTh 2, AdCa 1, AssTh 2, BtEup 342
3, TzDg 1, BaOr 1, ZeCa 1, BzEup 3, ByOr 1, BzEup 3, BtEup 2, TiTh 1, BtEup 3, BaOr 2, 343
AssTh 1 and ByOr 2) are below the limit (8 Schade units) with an HMF content of less than 344
6
7
8
9
10
11
12
13
14
15
16
17
18
19
20
21
22
23
24
25
26
27
28
29
30
31
32
33
34
35
36
37
38
39
40
41
42
43
44
45
46
47
48
49
50
51
52
53
40 mg / kg which lead us to assume they are fresh samples but they have been heated or 345
poorly stored. Atthe end, 38.61% of the samples are old honey since they recorded higher 346
levels of HMF limit required by standards (40 mg / kg) and a low diastase activity. Louveaux 347
(1968) reported that the diastase content gradually decreases and tends to zero during aging of 348
honey. Other works (Belhaj et al 2015) reported a range between 6.7and 15Schadeunits 349
inhoney samples collected in TADLA-AZILAL region during the 2014-2015 season. Very 350
low or very high diastase activity in honey are undesirable and high diastase activity explain 351
the formation of acid coming from fermentationsince acids help the enzyme to break down 352
starch (FurkanYardishM ,Gurmus T, 2010). 353
The main amino acid of honey is proline. The latter is a honey quality trait but it is not used in 354
the Codex Alimentarius 2001. The proline content of examined samples varied between 0.35 -355
302.15 mg/kg with an average of 191.10 mg / kg.The post hoc Duncan test classified simples 356
into 20 homogenous subsets which attest an important significant pairwise differences.Cotte 357
et al, (2004) reported that honey has reached maturity when its proline content is greater than 358
183 mg / kg, and lower values indicate a lack of maturity or freshness or falsification (Petrov, 359
1974; Won DerOhe et al., 1991). There was 28.57% of the honey analyzed during this study 360
lacking maturity stage, these samples also had high water content exceeding 20%, except for 361
BaOr 1, TiTh 1, ZeCa 1, MTf and Sy, which are probably falsified. On the other hand, 362
71.43% of the samples were mature, the highest value reported in eucalyptus honey, and the 363
lowest content was observed in synthetic honey(Bosi et al, 1978) and Davies, (1982) reported 364
that proline content could be considered as an indicator of botanical origin. 365
Results of honey samples color evaluation are given in the table 2.The color of honey samples 366
are shown in table 2b. The color of the honey was significantly affected by the storage 367
temperature and period with deterioration at a condition storage temperature. Samples were 368
classified into 20 subsets according to Duncan test (p<0.05). The results of the 369
6
7
8
9
10
11
12
13
14
15
16
17
18
19
20
21
22
23
24
25
26
27
28
29
30
31
32
33
34
35
36
37
38
39
40
41
42
43
44
45
46
47
48
49
50
51
52
53
table2bshowed that color value (PFUND) willbe in the range of 390.96 mmPfund to 3 mm 370
Pfund. The highest value was obtained from Ghana honey but the lowest value from unifloral 371
of citrus (OuledYaich) was observed with 126.58mm Pfund. The highest and lowest color 372
intensities were related to multifloral honey from Ghana (387.64 mmPfund andcitrus honey 373
(13.25mmPfund), respectively Euphorbia, Thymus, Eucalyptus,Ziziphus lotus, Caralluma 374
europaea andCarallumaeuropaea honey were significantly different from each other. The 375
honey samples will be classified into 6 groups according to their lightness and 376
darkness.According to these result 34.7% of honey samples studied here considered dark 377
honey and 12.44% light honey.Tsigouri at al.,(2004)reported color of 208 samples of Greece 378
honey in the range of 5 and 100mm Pfund and the lowerst color for Citrus honeywhich is 379
similar to the results obtained in this study.As reported in many studies( Viuda and al, 2010), 380
the honey color is one of the factors determining its price as well as its acceptance in the 381
world market. Honey from different botanical sources consist of different compositions and 382
concentrationsof pigments mainly polyphenols and carotenoids, flavonoids and long-chain 383
phenolics, and as well as other components like terpene and isoprene (Alvarez, L.M, 2011). 384
Also, Color intensity in honey might also be related to the products resulting from the 385
Maillard reaction (Miotto, D, 2011). The result of table 1 that all honey from different 386
botanical sources consist of different compositions and concentration of pigments mainly 387
polyphenols and carotenoids (Alvarez L M, 2011) and might be affected by geographic 388
characteristic such as mutifloral honey from Ghana with darkness honey (387.6 mmPfund). 389
3.2. Total polyphenol content
390
Total phenolics of honey samples showed a high significant variability among samples 391
(p<0.001). Duncan multiple-range test showed significant pairwise differences with 21 392
homogenous subsets (table 2). Values ranged from0.58±0.2 mg GAE/100g (gallic acid 393
equivalent by 100 gram of extract) for the Citrus x sinensisto 150.35±1.3 mg GAE/100g for 394
Thymespp honey. The average value was about 50.31±2.93 mg GAE/100g. The highest 395
6
7
8
9
10
11
12
13
14
15
16
17
18
19
20
21
22
23
24
25
26
27
28
29
30
31
32
33
34
35
36
37
38
39
40
41
42
43
44
45
46
47
48
49
50
51
52
53
content was obtained in multi flowers honey from Ghana with 149.41±0.4 mg GAE/100g 396
(Table 3).The results (Table 3) shows that the total phenolic content were 397
significantlydifferent among the honey samples with P < 0.005. The highest content of 398
polyphenolic was obtained in honey Thymusspp(70.97±1.3mg GAE/100g) followed by 399
Ziziphus lotus (53.57±0.2 mg GAE/100g), Eucalyptus spp (52.27±0.2 mg GAE/100g), Honey 400
samples from All Flowers Morroco, Ceratonia siliqua, Caralluma europaea and finally 401
Citrus x sinensis(Table 3)..Significant variation (p>0.05) was observed between the honey 402
samples from the same botanical origin ad different regions. This implies that the 403
concentration and type of polyphenolic compounds in honey are variable and essentially 404
depend on the geographical, botanical resources and climatic characteristics (Kucuk and al., 405
2007), they contribute to the appearance and functional properties of honey (Alvarez Suarez 406
and al, 2010) 407
These results are in concordance to those reported by (Khalil and al 2011) and they were 408
higher than values observed in Spain (2 to 17 mg GAE/100g (Thibaut Istasse etal, 2016), . 409
This is expected as properties and composition of honey is strongly affected by various 410
factors including its nectar source, collection season, mode of storage, and harvest technology 411
and conditions (Kaskoniene and Venskutonis, 2010). The phenoliccompounds constitute a 412
good attribute of quality of honey and giving an antioxidant property has a beneficial 413
therapeutic effect. The Thymus ssp honey from Morocco and multifloral honey from Ghana 414
have more nutritional value regarding to polyphenols content. 415
3.3. Total flavonoid content
416
Total flavonoid contents of the different types of honey are illustrated in Table 3. The results 417
reveal that Thymus spphoney contains a significant amount of flavonoids with 47.18±2.4mg 418
Ru/100 g, followed by Euphorbia honey, Caralluma europaea honey, Ceratonia siliqua 419
honey, Eucalyptus spp honey, Ziziphus lotus honey and multiflorals Moroccan honey and 420
6
7
8
9
10
11
12
13
14
15
16
17
18
19
20
21
22
23
24
25
26
27
28
29
30
31
32
33
34
35
36
37
38
39
40
41
42
43
44
45
46
47
48
49
50
51
52
53
finally Citrus x sinensis honey. All the Moroccan honey from the different botanical origin 421
shows a lower value than multiflorals honey from Ghana. The components in honey reported 422
to be responsible for its antioxidant effects are flavonoids, phenolic acids, ascorbic acid, 423
catalase, peroxidase, carotenoids, and the products of Maillard reactions. However, the 424
amount and type of these antioxidants are largely dependent on the floral source, honey 425
variety and a correlation between antioxidant activity and total phenolic content has been 426
established (Khalil and Alam, 2011); (Gheldofetal., 2002). The results are in agreement with 427
those of previous studies, were authors found that honey samples with higher polyphenol 428
content also yield high flavonoid levels (Moniruzzaman and al., 2013; (Khalil and al., 2012). 429
Most phenolic compounds are in the form of flavonoids.They make up a great family of plant 430
phenolic pigments and are effective in aroma of honey(Escuredo, Oand al, 2012). The 431
quantity and type of these identified in honey vary according to the botanical source. In 432
contrast, darker honey contain higher amounts of flavonoids than bland honey, as well as 433
greater antioxidant capacity (Medic and al., 2004).The concentration and type of flavonoids is 434
strongly affected by the floral origin of honey (Ulusoy, E and al, 2010) 435
3.4. Total carotenoid content
436
Total carotenoids contents of the studied honey are shown in Table 3. A close look at the 437
results shows always that Thymus has the highest content of carotenoids, followed by 438
Euphorbia, Ceratoniasiliqua, Citrus x sinensis, Ziziphus lotus, Eucalyptus spp and finally 439
multifloralhoney from Moroccan. Rodriguez-Amaya, (2001); Faciullino et al., 2006 reported 440
that the amount of carotenoids in honey is influenced by the growing conditions and maturit y 441
of the fruits, and the flowers visited by the bees. It was also cited that honey color is not 442
attributed only to carotenoids but to the presence of phenolic compounds and depend on the 443
flower origin. These authors found a high correlation between polyphenol content and honey 444
color (Amiot et al., 1989). 445
6
7
8
9
10
11
12
13
14
15
16
17
18
19
20
21
22
23
24
25
26
27
28
29
30
31
32
33
34
35
36
37
38
39
40
41
42
43
44
45
46
47
48
49
50
51
52
53
446
Table 3 447
Biochemical proprieties of local and foreign honey samples. The mean, standard deviation and the 448
variable ranges are reported according to their botanical origin 449
Type of honey Phenolics
compounds mg GAE/100g Flavonoids compounds mg Ru/100g Carotenoids compounds mg β-carotene E/100g Carallumaeuropaea 49.56± 0.42 31.15±0.1 15.09±0.3 Eucalyptus spp 52.27±0.2 29.4±0.2 31.86±0.6 Thymus spp 70.97±1.3 47.18±2.4 74.94±3.08 Citrus x sinensis 41.48±0.2 10.43±0.1 43.1±0.2 Ceratoniasiliqua 51.88±0.2 30.85±0.01 56.17±1.5 Ziziphus lotus 53.57±0.2 17.61±0.4 36.49±0.1 Euphorbia 46.33±0.4 39.1±2.05 66.39±2.02 Multifloralhoney from Morocco 53.57±0.8 17.75±0.1 18.04±0.6
Multifloral honey from Ghana 149.41±0.4 58.28±2.6 40.76±0.7 Honey of Sugar syrups (SY) 0.73 ± 0.2 0.043 ± 0.01 09.0 ± 0/2 Multifloral honey from France 17.98 ± 0.5 21.38 ± 7.1 36.67 ± 6.5 * Data are reported as means ± SE for three replications.
450 451
3.5. Antioxidant activityFree radical scavenging activity
452
In evaluating the radical-scavenging potential of a sample including honey, the DPPH assay is 453
frequently used. Usually, a high DPPH scavenging activity reflects high levels of antioxidant 454
potential. The results of DPPH radical scavenging percentage and quantities of the Moroccan 455
honey samples (expressed % and mg) showed inTable 4. The antioxidant activities of honey 456
samples ranged from 21.16±0.5 for Thymusspp honey and 36.54±0.4 ET/100g from mutifloral 457
honey from Ghana. The mean DPPH radical-scavenging activity of the investigated honey 458
samples was 19.58 %. The result showed that all samples honey had antioxidant activities and 459
Euphorbia honey possessed the highest antioxidant activitie with 38.98±0.4Eq T/100g for 460
Citrus x sinensis honey and Ziziphus lotus honey (38.82±0.6Eq T/100g). 461
6
7
8
9
10
11
12
13
14
15
16
17
18
19
20
21
22
23
24
25
26
27
28
29
30
31
32
33
34
35
36
37
38
39
40
41
42
43
44
45
46
47
48
49
50
51
52
53
The honey samples of Thymus spp again exhibited the highest DPPH radical-scavenging 462
activity (50.23%)which could be attributed to its higher phenolic acid and flavonoid content, 463
as it has been reported that the antioxidant potential of honey is directly proportional to the 464
amount of phenolic acids and flavonoids present (Beretta et al., 2005). The difference in the 465
antioxidant activity of various types of honey result from antioxidant activity compounds 466
especially phenolic content, carotenoids and flavonoids (FurkanYardibi M et al, 2010); 467
(Ferreira et al. 2009). The lower quantities of antioxidants value indicate a higher DPPH free 468
radical scavenging activity which was noted for the Thymus spp with 21.16±0.5 mg ET/100g 469
(Table 3). A significant difference (p<0.05) between all honey samples from different flowers 470
origins was found. But, higher correlations were observed between the DPPH radical 471
scavenging activity percentage and the total polyphenol and flavonoids respectively (r=0.987, 472
r=0.952). According to (Beretta etal, 2005), honey with dark color have a high antioxidant 473
activity such asthe result obtained for Thymus honey. This type of honey has the largest 474
amount of free radical accepting compounds and the greatest antioxidant potential. These 475
results are in perfect correlation and accordance with the works of (Alvarez-Suarez et al. 476
2010), (Sant’Ana et al. 2012) and (Ferreira et al. 2009) who found that there is a positive 477
correlation between total polyphenols, and total flavonoids. 478
Table 4 479
DPPH Freeradical-scavenging activitiesusing DPPH method (mg trolox equivalent/ 100g of exract) of 480
the different honey from different botanical origin 481
Type of honey Inhibition percentage % Quantities mg TroloxEq.ET/100g Carallumaeuropaea 29.02±0.01 31.09±2.2 Eucalyptusspp 16.78±1.19 33.07±0.9 Thymusspp 50.23±1.87 21.16±0.54 Citrus x sinensis 12.26±0.52 38.98±0.39 Ceratoniasiliqua 23.56±0.39 36.27±1.87 Ziziphus lotus 12.23±0.0615 38.82±0.57 Euphorbia 31.79±1.12 29.79±0.42 Multiflorals honey from
Morocco
25.86±0.90 32.56±0.32
Formatted: French (France)
6
7
8
9
10
11
12
13
14
15
16
17
18
19
20
21
22
23
24
25
26
27
28
29
30
31
32
33
34
35
36
37
38
39
40
41
42
43
44
45
46
47
48
49
50
51
52
53
Multiflorals honey from Ghana 17.36±0.07 36.54±0.36 Multiflorals honey France 18.,24 ± 3.,93 37.45±0.24
Honey of sugar syrups (SY)
18.,45 ± 3.,62 38.23±0.16
*Data are the mean of three replicationsAverage values ± standard errors of mean of three 482
replications 483
484
3.6. Volatile compounds characterization 485
HS-SPME method combined to GC-MS analysis allowed identification of about 30 486
compounds in honey samples which relative amounts are determinated based on percentage 487
area. Identified compounds include alcohols, aldehydes, ketones, acids, esters, terpenes and 488
nitrogen compounds are shown in Table 5. 489
490
3.6.Olfacto-gustatory profile and volatile compounds characterization 491
492
Around 30 major volatile compounds were identified and semi quantified in the volatile 493
fractions of honey samples, including alcohols, aldehydes, ketones, acids, esters, terpenes and 494
nitrogen compounds. The average values, standard deviation, and the ANOVA results of the 495
volatile compounds analysed in both types of honey are shown in Table 5. 496
Table 5 497
498
Main relative volatile composition (%) characteristics of each honey from different floral origin 499
Type of honey Compound CAS
number Percentage % Caralluma europaea Ethanol 64-17-5 39.2
lilac aldehyde A 53447-45-3 8.6 lilac aldehyde D 3447-48-6 6.6 nonanoic acid 112-05-0 8.7 benzoic acid, 65-85-0 2.0 Eucalyptus spp ethanol 64-17-5 18.5 lilac aldehyde C 78-59-1 14.5 benzeneacetaldehyde 122-78-1 6.3 benzeneethanol 60-12-8 5.7 nonanoic acid 112-05-0 11.0
Formatted: Font: Times New Roman, 12 pt Formatted: Indent: Left: 0", Line spacing: 1.5 lines Formatted: Indent: Left: 0", Line spacing: Double
6
7
8
9
10
11
12
13
14
15
16
17
18
19
20
21
22
23
24
25
26
27
28
29
30
31
32
33
34
35
36
37
38
39
40
41
42
43
44
45
46
47
48
49
50
51
52
53
ethanol 64-17-5 38.5 Thymus spp 8-hydroxylinalool 103619-06-3 3.9 ethyl nonanoate 123-29-5 10.4 lilac aldehyde C 53447-47-5 6.1 benzeneacetic acid 103-82-2 2.4 ethanol 64-17-5 20.4
Citrus x sinensis furfural 98-01-1 6.3
benzeneethanol 60-12-8 14.5
nonanoic acid 112-05-0 10.4
2,5-furandicarbaldehyde 823-82-5 2.2
ethanol 64-17-5 12.7
Ceratonia siliqua furfural 98-01-1 14.4
2,3-butanediol 513-85-9 4.5
nonanoic acid 112-05-0 10.5
octanoic acid 124-07-2 7.7
ethanol 64-17-5 13.3
Ziziphus lotus acetic acid 64-19-7 9.5
(z)-linalool oxide 5989-33-3 6.3 furfural 98-01-1 8.1 pentanoic acid 109-52-4 13.2 ethanol 64-17-5 11.1 Euphorbia furfural 98-01-1 8.9 Isoborneol 10385-78-1 9.4 2,5-furandicarbaldehyde 823-82-5 14.4 anisaldehyde 50984-52-6 7.5 beta myrcene 123-35-3 14.1 Multifloral honey Morocco dl-limonene 138-86-3 6.4 (z)-linalool oxide 5989-33-3 13.4 sorbic acid 22500-92-1 16.3 pentanoic acid 109-52-4 4.5 500 501
Type of honey Compound CAS number Percentage %
Carallumaeuropaea Ethanol 64-17-5 39.2 lilac aldehyde A 53447-45-3 8.6