Development of a Visual Method to Quantify the Gossypol Content in Cotton Seeds
H. Benbouza, G. Lognay, R. Palm, JP. Baudoin, and G. Mergeai*ABSTRACT the formation of a gossypol-aniline complex lead to
over-estimated results because of some interferences (Mar-Twelve Gossypium genotypes (species, fertile interspecific
allote-quie´ and Bourre´ly, 1991). Because of its sensitivity and traploid and allohexaploid hybrids, backcross progeny of interspecific
hybrids) characterized by drastic differences in their seed gossypol repeatability, HPLC is the method of choice for the content were used to design a visual quantification method of the gossy- measurements of low gossypol concentrations (Abou-pol concentration in cotton seeds. After developing an high perfor- Donia et al., 1981; Marquie´ and Boure´ly, 1991). It is, mance liquid chromatography (HPLC) method that allowed measure- however, tedious to apply chemical measurements on ment of gossypol content in single seed samples, the results of 123 a large number of seed samples. In this paper, we present HPLC analyses carried out seed-by-seed were compared with
differ-a new qudiffer-antificdiffer-ation method of seed gossypol content ent parameters characterizing the level of gossypol glands in the seed.
based on visual observations of seed characteristics. This A significant correlation was found between the gossypol content %G
new technique is rapid and accurate and is particularly determined on single seeds by HPLC and the number N of gossypol
valuable in breeding programs to screen the progeny of glands per seed section area (S, expressed in mm2), leading to the
cotton genotypes showing a high degree of segregation establishment of the following model: %G ⫽ bi (N/S ), where the
regression coefficient bidepends on the cotton genotype considered. in the gossypol content of their seeds. The estimation of %G directly from N/S is a rapid and accurate
method which can be used in breeding programs to screen the progeny
MATERIAL AND METHODS of cotton genotypes showing a high segregation for their seed
gossy-pol content. Plant Materials
The seeds used in our investigations were produced by self-ing 12 distinct genotypes (of different genetic backgrounds)
O
ne of the main traitsof Gossypium L. is the pres- maintained in the cotton collection of the Gembloux Agricul-ence of pigment glands throughout the plant (Alt- tural University: one cultivar of G. hirsutum L. 2(AhDh)1(cv.Stamf) originating from West Africa; one accession of G.
man et al., 1990). Gossypol, a triterpenoid aldehyde,
thurberiTod. (2D1); one accession of G. raimondii Ulbr. (2D5); and its derivatives are predominant secondary
metabo-one accession of G. sturtianum Will. (2C1); one synthetic allo-lites in cotton glands. These compounds have
insectici-hexaploid: G. hirsutum ⫻ G. sturtianum (2[AhDhC1]); three dal, antimicrobial, antifertility and toxic properties
(Sti-synthetic allotetraploids: G. arboreum L. ⫻ G. sturtianum
panovic et al., 1984, Fisher et al., 1988, Percy et al., 1996).
(2[A2C1]), G. thurberi ⫻ G. sturtianum (2[D1C1]), G. australe Gossypol is the main terpenoid aldehyde found in F. Muel. ⫻ G. davidsonii Kell. (2[G
1D3-2]); four plants obtained cotton seeds. Its concentration varies from zero in the by backcrossing the HRS (G. hirsutum ⫻ G. raimondii ⫻ seed kernel of some Australian wild diploid species G. sturtianum, [A
hDhD5C1]) trispecific hybrid to G. hirsutum: (Brubaker, 1996) to more than 9% in G. davidsonii Kell. HRS BC2S1/09, HRS BC2S1/14, HRS BC3/09, and HRS BC3/ (Carter et al., 1966). Upland cotton seeds usually contain 13. All these genotypes were characterized by very different levels of seed gland gossypol and the BC2S1and BC3plants from 0.6 to 2% gossypol (Lusas and Jividin, 1987). As
issued from the HRS hybrid were chosen for their ability
this triterpenoid is very toxic to humans and
monogas-to produce segregating progenies for this trait (Vroh Bi et
tric animals (Lusas and Jividin, 1987; Alford et al., 1996),
al., 1999).
its rate in all food and feed products produced with cotton flour must be very low and has to be
systemati-Seed Glands Counting Technique cally controlled. To reach this goal, the most frequently
and Surface Evaluation used analytical procedures include spectrophotometry
and HPLC (Abou-Donia et al., 1981; Stipanovic et al., Before being analyzed by HPLC, each seed was cut in two longitudinal sections after removal of the teguments to assess
1988; Hron et al., 1990; Tchatchueng et al., 1992). The
its total number of glands, N, per section, its section area, S
standardized spectrophotometric techniques requiring
in mm2, and the size of the glands. These operations were
carried out with a Nikon Eclipse E800 light and fluorescent H. Benbouza, JP. Baudoin, and G. Mergeai, Unite´ de Phytotechnie microscope (Nikon, Tokyo, Japan) using a JVC-3-CCD color tropicale et d’Horticulture, Faculte´ Universitaire des Sciences Agro- video camera (JVC, Tokyo, Japan) and the Archive Plus pro-nomiques, 2 Passage des De´porte´s, B-5030 Gembloux, Belgium; G. gram of Sony (Sony Electronics, Park Ridge, NJ) to capture Lognay, Unite´ de Chimie ge´ne´rale et organique, Faculte´ Universitaire and analyze the images. The gossypol glands were distributed des Sciences Agronomiques, 2 Passage des De´porte´s, B-5030 Gem- in three classes according to their size: small glands (N1: size bloux, Belgium; R. Palm, Unite´ de Statistique et Informatique, Faculte´ ⬍2700 m2), medium glands (N2: from 2700–7549 m2) and
Universitaire des Sciences Agronomiques, 2 Passage des De´porte´s,
large glands (N3: ⬎7549 m2). The total numbers of glands
B-5030 Gembloux, Belgium. Received 14 June 2001. *Corresponding author ([email protected]).
Abbreviations: G, gossypol; HPLC, high performance liquid
chroma-tography. Published in Crop Sci. 42:1937–1942 (2002).
at ⫺196⬚C with liquid nitrogen as such or in the presence of
N2 ⫻ 5125 ⫹ N3 ⫻ 10 000)/(N1 ⫹ N2 ⫹ N3), where 1350,
5125, and 10 000 are considered as the central points of the glacial acetic acid; (iii) hydrolysis duration: 5, 10, and 20 min. three gland classes.
RESULTS AND DISCUSSIONS
HPLC Determination of Gossypol
Development of a Seed-by-Seed Gossypol The HPLC procedure optimized by Marquie´ and Bourre´ly
HPLC Method (1991) was used to analyze the gossypol content in seed bulks.
After being peeled, cut, and weighed, the seeds were ground The retention times of the standard gossypol provided and sieved (30 mesh). Samples of ground seeds (100 mg each) by Sigma and of the gossypol extracted from cotton were hydrolyzed for 10 min in boiling water bath at 100⬚C
seeds of G. hirsutum cv. Stamf were in close agreement:
with 20 mL of glacial acetic acid. At the same time two samples
5.70 min and 5.71 min, respectively. However,
chroma-(1–2 mg) of standard gossypol (Sigma ref. G-8761, St. Louis,
tograms obtained from the Stamf seed extracts also
con-MO) were treated similarly. The solutions were filtered
tained additional unidentified peaks with much shorter
through silanized glass wool into 50-mL volumetric flasks. The
residues were rinsed three times with 2 to 3 mL of a water/ retention times (between 2 and 3 min), which did not
acetonitrile (50:50; v/v) mixture, the recovered solutions were interfere with the quantification of gossypol.
diluted up to 50 mL and homogenized carefully. The samples The first modification we brought to the method pro-were then left at room temperature for 3 h before being filtered posed by Marquie´ and Bourre´ly (1991) involved the through a 0.20-m nylon membrane (MSI). establishment of the standard curves. Indeed, as it was The samples were directly analyzed on a Merck Hitachi L impossible to obtain reproducible results by direct 6200 chromatograph (Hitachi Ltd., Tokyo, Japan) equipped
weighing of small gossypol quantities as suggested in
with a Merck Hitachi L 4000 UV. The chromatographic signals
the original method, we considered the solubilization
were integrated on a Hewlett Packard HP 1000 integrator
of the molecule in acetone as an alternative. This solvent
(Hewlett Packard, USA). Other analytical conditions were
was chosen on the basis of Nomeir and Abou-Dounia
fixed as follows: (i) column—Inertsil 5 m ODS-3 from
Chrompack (the Netherlands); (100 ⫻ 3 mm); (ii) mobile (1982) results which showed that, when the compound
phase—acetonitrile/water (acidified to pH ⫽ 2.6 with phos- was solubilized in organic solvents (acetone,
acetoni-phoric acid) 88: 12 (v/v) at flow rate of 0.5 mL min⫺1; (iii) UV
trile, chloroform, ethanol, and methanol), its
decompo-detection at 272 nm; and (iv) duplicates of 20-L injections sition rate was lowest in acetone. Under these condi-were made for all samples. Standard curve for gossypol was tions, the calibration was linear for a wide array of constructed from triplicate determinations each for gossypol
concentrations (0.02–200 g gossypol mL⫺1).
quantities of 0.5 mg, 1 mg, 1.5 mg, and 2 mg.
In spite of good repeatability when grinding the seed
To quantify the gossypol content on single seed samples,
one by one without special treatment, the values
ob-G. hirsutumcv. Stamf was used and the following parameters
tained for gossypol concentrations were systematically
were reinvestigated and optimized: (i) the preparation of the
gossypol standard solutions (direct weighing of the pure refer- lower than values recorded using bulk seed (0.49% ⫾ Table 1. Influence of the grinding method on the assessment of single cotton seed gossypol content by HPLC.
Cryo-grinding with Cryo-grinding with liquid nitrogen
Method Simple dry grinding liquid nitrogen and glacial acetic acid
Number of seeds evaluated 16 5 16
Max gossypol content (%) 0.57 0.66 1.40
Mean gossypol content (%) 0.49 0.61 0.97
Min gossypol content (%) 0.36 0.54 0.67
Standard deviation (%) 0.06 0.05 0.18
Coefficient of variation (%) 11.4 8.4 18.4
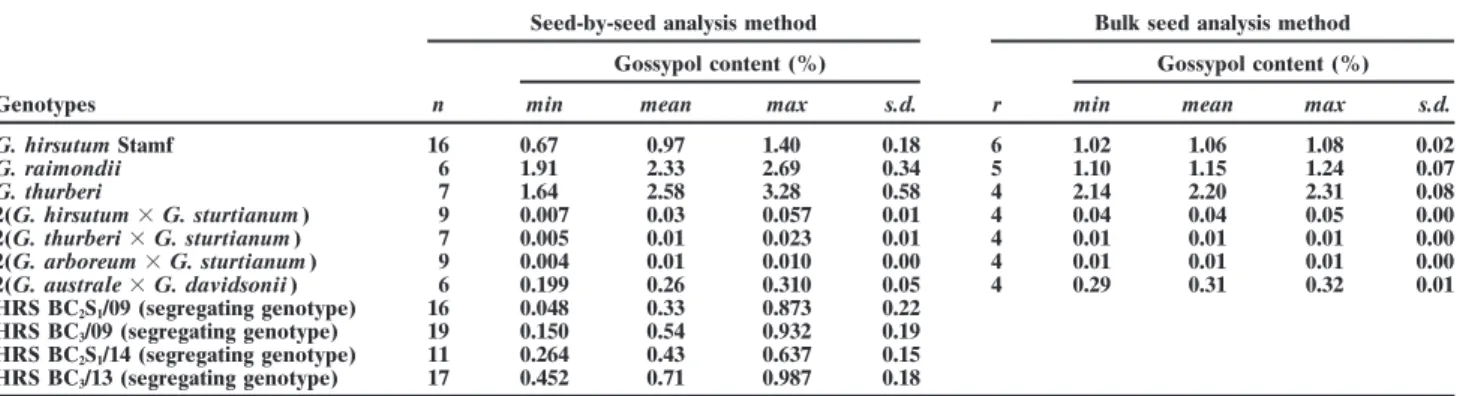
Table 2. Comparison of the gossypol contents (%) of different Gossypium genotypes assessed according to the seed-by-seed and to the
bulk seedHPLC analysis methods.
Seed-by-seed analysis method Bulk seed analysis method
Gossypol content (%) Gossypol content (%)
Genotypes n min mean max s.d. r min mean max s.d.
G. hirsutumStamf 16 0.67 0.97 1.40 0.18 6 1.02 1.06 1.08 0.02 G. raimondii 6 1.91 2.33 2.69 0.34 5 1.10 1.15 1.24 0.07 G. thurberi 7 1.64 2.58 3.28 0.58 4 2.14 2.20 2.31 0.08 2(G. hirsutum ⫻ G. sturtianum ) 9 0.007 0.03 0.057 0.01 4 0.04 0.04 0.05 0.00 2(G. thurberi ⫻ G. sturtianum ) 7 0.005 0.01 0.023 0.01 4 0.01 0.01 0.01 0.00 2(G. arboreum ⫻ G. sturtianum ) 9 0.004 0.01 0.010 0.00 4 0.01 0.01 0.01 0.00 2(G. australe ⫻ G. davidsonii ) 6 0.199 0.26 0.310 0.05 4 0.29 0.31 0.32 0.01 HRS BC2S1/09 (segregating genotype) 16 0.048 0.33 0.873 0.22 HRS BC3/09 (segregating genotype) 19 0.150 0.54 0.932 0.19 HRS BC2S1/14 (segregating genotype) 11 0.264 0.43 0.637 0.15 HRS BC3/13 (segregating genotype) 17 0.452 0.71 0.987 0.18 n: number of seeds, r: number of replicates, s.d.: standard deviation.
Fig. 1. Protocol of seed-by-seed gossypol analysis.
0.06, n ⫽ 16 instead of 1.06% ⫾ 0.02, n ⫽ 6) of the improvement was clear from the intense yellow color of the seed extracts. According to Yatsu et al. (1986), same cultivar (Stamf). We tested the effect of adding
liquid nitrogen alone (about 15 mL per seed) or in one can assume that this treatment burst the walls of cells protecting the gossypol glands. The gossypol con-combination with glacial acetic acid (0.5–1 mL per seed)
on the HPLC assessment of single seed gossypol con- tents measured after cryo-grinding with acetic acid were significantly higher (P ⬍ 0.001) than those obtained tent. The results obtained for these different treatments
are shown in Table 1. when no treatment was applied.
Among the three hydrolysis times tested (5, 10, and Compared with the two other treatments, the addition
of liquid nitrogen and glacial acetic acid released much 20 min), the best compromise was reached, as stated by Marquie´ and Bourre´ly (1991), with the 10-min hydroly-more of the gossypol contained in the seed glands. This
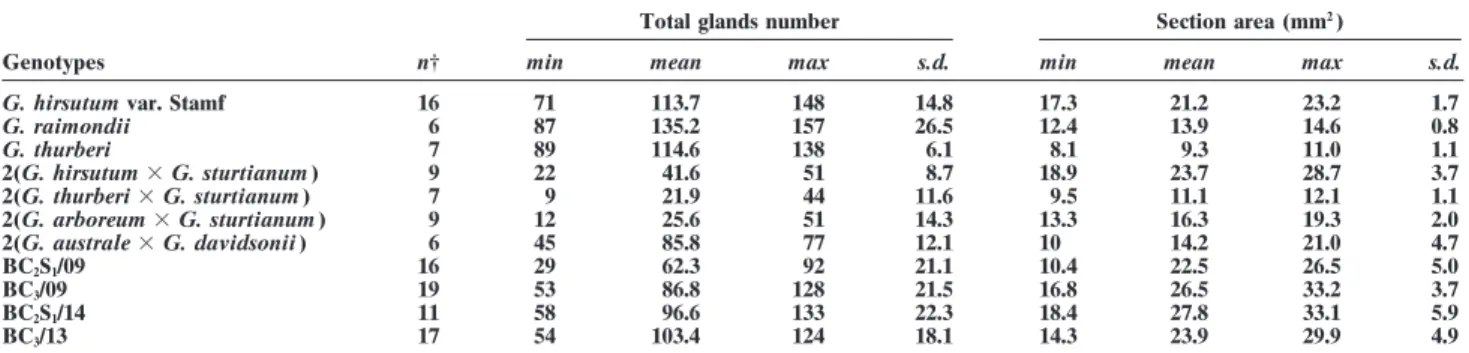
Table 3. Results of gossypol gland counting and seed section area evaluation.
Total glands number Section area (mm2)
Genotypes n† min mean max s.d. min mean max s.d.
G. hirsutumvar. Stamf 16 71 113.7 148 14.8 17.3 21.2 23.2 1.7
G. raimondii 6 87 135.2 157 26.5 12.4 13.9 14.6 0.8 G. thurberi 7 89 114.6 138 6.1 8.1 9.3 11.0 1.1 2(G. hirsutum ⫻ G. sturtianum ) 9 22 41.6 51 8.7 18.9 23.7 28.7 3.7 2(G. thurberi ⫻ G. sturtianum ) 7 9 21.9 44 11.6 9.5 11.1 12.1 1.1 2(G. arboreum ⫻ G. sturtianum ) 9 12 25.6 51 14.3 13.3 16.3 19.3 2.0 2(G. australe ⫻ G. davidsonii ) 6 45 85.8 77 12.1 10 14.2 21.0 4.7 BC2S1/09 16 29 62.3 92 21.1 10.4 22.5 26.5 5.0 BC3/09 19 53 86.8 128 21.5 16.8 26.5 33.2 3.7 BC2S1/14 11 58 96.6 133 22.3 18.4 27.8 33.1 5.9 BC3/13 17 54 103.4 124 18.1 14.3 23.9 29.9 4.9 † n: seed number.
Table 4. Values of the correlation coefficients calculated† between the total gossypol content, %G, and seven variables characterizing gossypol-glands distribution on the embryos.
N/S‡ N1/N3 N1/S N2/S N3/S MGS MGS*N/S 0.906*** 0.066 0.246** 0.892*** 0.287** 0.147 0.907*** * P ⬍ 0.05. ** P ⬍ 0.01. ***P ⬍ 0.001. † Number of observations: 123.
‡ N/S: number of glands divided by the section area in mm2, N1/N2: number of glands of class 1 divided by number of glands of class 3; N1/S, N2/S and N3/S: number of glands of class 1, 2, or 3 divided by the section area in mm2; MGS: mean surface (m2) of gossypol glands; MGS*N/S portion of gland surface.
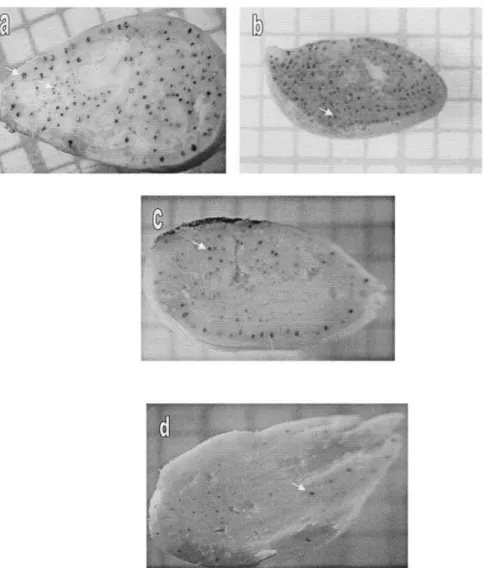
Fig. 2. Distribution of gossypol glands on the seed sections. (a) G. hirsutum, (b) G. raimondii, (c) seed BC3, and (d) seed BC2S1. The arrows indicate gossypol glands.
sis of the seed kernel meal with glacial acetic acid at 100⬚C in a boiling-water bath. After a 20-min. hydroly-sis, the chromatograms contained additional major un-identified peaks. This phenomenon is probably linked to a release of unidentified molecules in the reactive medium or to gossypol decomposition or polymeri-zation.
The centrifugation of the samples at 3300 g for 10 min followed by a double filtration on nylon filter mem-branes of 0.20 m (MSI) to eliminate micro suspended particles avoided excessive back-pressure in the analyti-cal columns. For each series of analyses, analytianalyti-cal drift was avoided during a working period by injecting exter-nal standards, at least three reference solutions with Table 5. Analysis of variance of the ratios %G/(N/S ).
Fig. 3. Variation of the mean estimated seed gossypol content of the Degree of Sum of
evaluated genotypes. Genotypes are as follows: 1 ⫽ G. hirsutum, Source freedom squares Mean squares F P 2 ⫽ G. thurberi, 3 ⫽ BC2S1/09, 4 ⫽ BC3/09, 5 ⫽ BC3/13, 6 ⫽ BC2S1/
Genotypes 10 0.6094 0.06094 26.9 0.000
14,7 ⫽ 2(G. australe ⫻ G. davidsonii ), 8 ⫽ 2(G. thurberi ⫻ G.
Errors 112 0.2541 0.00227
sturtianum), 9 ⫽ 2(G.arboreum ⫻ G. sturtianum ), 10 ⫽ 2(G.
Total 122 0.8636
Table 6. Values of the averages, the standard deviation, and the standard error of the %G/(N/S ) ratio per genotype.
Genotypes niseed number riratio mean ˆistandard deviation s.e.istandard error
G. hirsutumvar. Stam f 16 0.18312 0.03616 0.03727
G. thurberi 7 0.2105 0.05211 0.05571 G. raimondii 6 0.24451 0.04049 0.04373 2(G. hirsutum ⫻ G. sturtianum ) 9 0.01492 0.00823 0.00868 2(G. thurberi ⫻ G. sturtianum ) 7 0.00783 0.00283 0.00303 2(G. arboreum ⫻ G. sturtianum ) 9 0.00618 0.00345 0.00364 2(G. australe ⫻ G. davidsonii ) 6 0.06619 0.01938 0.02093 BC2S1/09 16 0.12175 0.06623 0.06827 BC3/09 19 0.17010 0.06129 0.06288 BC2S1/14 11 0.12701 0.04858 0.05074 BC3/13 17 0.16631 0.05616 0.05779
known gossypol contents close to those of the samples. only simple counting of the total number of glands, instead of measuring the gossypol glands area. The improved protocol presented schematically in Fig.
Considering two or several variables simultaneously 1 was finally adopted.
does not improve the relation between the gossypol Results on gossypol content quantification using the
content %G and the variables characterizing the distri-seed-by-seed and the bulk seed HPLC analysis methods
bution of gossypol glands. The relationship between are presented in Table 2. The results obtained by the
gossypol content %G and N/S is linear, but the condi-bulk seed analysis method are consistent with those
tional variance of %G is proportional to (N/S )2. This obtained by the seed-by-seed HPLC method, the latter,
justifies the use of weighted regression. For the straight however, being slightly lower. This is notable in the
line fitted by weighted least squares, the constant, al-case for the two wild American species (G. thurberi, G.
though significant, is of no importance and can therefore
raimondii). We hypothesize that the cryo-grinding in
be removed. The simplified model is %G ⫽ b ⫻ (N/S ), liquid nitrogen and acetic acid led to a more complete
which means that the %G/(N/S ) ratio does not depend recovery of gossypol.
on N/S.
Examination of the box-plots (Fig. 3) and a
one-crite-Quantification of the Internal Gossypol
rion variance analysis of the %G/(N/S ) ratios (Table 5)
Glands Density
shows that the differences between the studied geno-Table 3 presents the results obtained from the obser- types are very important. The results can be used to vations made on the section of the seeds used to assess quantify the contents of gossypol in single seeds belong-the gossypol content with belong-the seed-by-seed HPLC analy- ing to one of the 11 genotypes studied (Table 6). The sis method. For genotypes BC3S1/09 and BC2S2/09, we estimate of the seed gossypol content is given by G % ⫽ noted a reduction of the number of gossypol glands on r
i(N/S )and the standard error of this estimate is equal to
the external tissues of the whole seed kernel, compared
(N/S)√ˆ2
i(ni ⫹1)/ni⫽(N/S) sei
with the gossypol gland density observed in parental
species (G. hirsutum, G. raimondii ) of the HRS trispe- In these relations, riis the average and ˆiis the standard
cific hybrid. deviation of the ratio %G/(N/S ) for the genotype i; ni
The allotetraploids (G. thurberi ⫻ G. sturtianum ), is the number of seeds studied for this genotype i, and 2(G. arboreum ⫻ G. sturtianum ), 2(G. australe ⫻ G. seiis the standard error of the estimated %G/(N/S ) ratio
davidsonii), and the synthetic allohexaploid 2(G. hirsu- for a seed of genotype i.
tum ⫻ G. sturtianum ), which include all the chromo- For example, the gossypol content of a seed with a somes of the wild Australian species in their genome, N/S ratio of 5 will vary according to which genotype it also show a significant reduction in the number of gossy- belongs, from 0.00618 ⫻ 5 ⫽ 0.031% (standard error ⫽ pol glands. Figure 2 shows different gossypol glands dis- 0.00364 ⫻ 5 ⫽ 0.02%) for G. arboreum ⫻ G. sturtianum tribution observed on seed longitudinal sections. hybrid to 0.24451 ⫻ 5 ⫽ 1.22% (standard error ⫽
0.04373 ⫻ 5 ⫽ 0.22%) for G. raimondii.
Establishment of a Relation between the This new method is rapid and accurate and can be
Seed-by-Seed Evaluation of the Gossypol used in breeding programs to screen the progeny of
Content by HPLC, and the Parameters cotton genotypes showing a high degree of segregation
Observed on the Seed Section for their seed gossypol content.
To allow the estimation of the gossypol content from ACKNOWLEDGMENTS
visual observations made on seed sections starting from
The PhD scholarship of the first author was provided by
the 123 observations carried out, correlation coefficients
the Belgian General Direction of International Cooperation
were calculated between the gossypol content %G and
(DGCI). This work was supported by the Belgian “Fonds de
the following variables: N/S, N1/S, N2/S, N3/S, N1/N3, la Recherche Fondamentale et Collective”.
MGS, and MGS*N/S (Table 4). With a coefficient of
correlation higher than 0.9 (Table 4), N/S and MGS ⫻ REFERENCES
N/S are the two variables that best explain the variation Abou-Donia, S.A., S.A. Lasker, and M.B. Abou-Donia. 1981. High-of gossypol content %G. Among them, variable N/S is performance liquid chromatography analysis of gossypol. J.
Chro-matogr. 206:606–610.
Percy, R.G., M.C. Calhoun, and H.L. Kim. 1996. Seed gossypol within foliar pigment glands of A, D, and AD genome cottons:
Introgres-sion potential for pest resistance. J. Hered. 81:447–454. Gossypium barbadenseL. cotton. Crop Sci. 36:193–197. Stipanovic, R.D., J.C. Donovan, A.A. Bell, and F.W. Martin. 1984. Brubaker, C.L., C.G. Benson, C. Miller, and N.D. Leach. 1996.
Occur-rence of terpenoid aldehydes and lysigenous cavities in the “gland- Factors interfering in gossypol analysis of okra and glandless cot-tonseed using direct aniline extraction. J. Agric. Food Chem. 32: less” seeds of Australian Gossypium species. Aust. J. Bot. 44:601–
612. 809–810.
Stipanovic, R.D., D.W. Altman, D.L. Begin, G.A. Greenblatt, and J.H. Carter, F.L., A.E. Castillo, V.L. Frampton, and T. Ker. 1966. Chemical
composition studies of the seeds of Gossypium hirsutum. Phyto- Benedict. 1988. Terpenoid aldehydes in upland cottons: analysis by aniline and HPLC methods. J. Agric. Food. Chem. 36: 509–515. chemistry 5:1103–1112.
Fisher, G.S., A.W. Frank, and J.P. Cherry. 1988. Total gossypol content Tchatchueng, J.B., R. Kamga, G.J. Kayem, and R.A. Oderinde. 1992. Dosage spectrophotome´trique du gossypol par complexation avec of glandless cottonseed. J. Agric. Food. Chem. 36:42–44.
Hron R.J, M.S. Kuk, and G. Abraham. 1990. Determination of free les ions molybdiques en milieu acide. Cot. Fib. Trop. 47:121–129. Vroh Bi, I., J.P. Baudoin, B. Hau, and G. Mergeai. 1999. Development and total gossypol by high performance liquid chromatography. J.
Am. Oil. Chem. 67:182–187. of high-gossypol cotton plants with low-gossypol seeds using tris-pecies bridge crosses and in vitro culture of seed embryos. Euphy-Lusas, E.W., and G.M. Jividin. 1987. Glandless cottonseed: A review
of the first 25 years of processing and utilisation research. J. Am. tica 106:243–251.
Yatsu, L., T.J. Jacks, H.W. Kircher, and M.A. Godshall. 1986. Chemi-Oil. Chem. 64:839–854.
Marquie´, C., and J. Bourre´ly. 1991. Dosage du gossypol par chromato- cal and microscopic studies of the matrix substance in pigment glands of cotton (Gossypium hirsutum L.) seeds. J. Am. Oil. graphie en phase liquide a´ haute performance dans les de´rive´s des