HAL Id: tel-02107714
https://pastel.archives-ouvertes.fr/tel-02107714
Submitted on 23 Apr 2019HAL is a multi-disciplinary open access
archive for the deposit and dissemination of
sci-L’archive ouverte pluridisciplinaire HAL, est destinée au dépôt et à la diffusion de documents
3D segmentation of pelvic structures in pediatric MRI
for surgical planning applications
Alessio Virzì
To cite this version:
Alessio Virzì. 3D segmentation of pelvic structures in pediatric MRI for surgical planning applications. Medical Imaging. Université Paris-Saclay, 2019. English. �NNT : 2019SACLT002�. �tel-02107714�
Th
`ese
de
doctor
at
NNT
:
2019SA
CL
T002
3D segmentation of pelvic structures in
pediatric MRI for surgical planning
applications
Th `ese de doctorat de l’Universit ´e Paris-Saclay pr ´epar ´ee `a T ´el ´ecom ParisTech Ecole doctorale n◦580 Sciences et technologies de l’information et de la communication (STIC)
Sp ´ecialit ´e de doctorat : Automatique, Traitement du Signal, Traitement des Images, Robotique Th `ese pr ´esent ´ee et soutenue `a Paris, le 31/01/2019, par
A
LESSIOV
IRZ`
IComposition du Jury :
Erwan Kerrien
Chercheur, INRIA Nancy-Grand Est & LORIA, Nancy Rapporteur Laurence Rouet
Chercheur, Philips Research (Medisys), Paris Rapportrice
Catherine Adamsbaum
Professeur, APHP, CHU Kremlin-Bic ˆetre, Universit ´e Paris Sud, Le
Kremlin-Bic ˆetre Examinatrice
Thierry G ´eraud
Professeur, EPITA - Research and Development Laboratory
(LRDE), Paris Pr ´esident
Isabelle Bloch
Professeur, T ´el ´ecom ParisTech (LTCI), Paris Directrice de th `ese Sabine Sarnacki
Professeur, APHP, H ˆopital Necker Enfants-Malades, Paris
Abstract
Surgical planning relies on the patient’s anatomy, and it is often based on medical images acquired before the surgery. This is in particular the case for pelvic surgery on children, for various indications such as malformations or tumors. In this par-ticular anatomical region, due to its high vascularization and innervation, a good surgical planning is extremely important to avoid potential functional damages to the patient’s organs that could strongly affect their quality of life.
In clinical practice the standard procedure is still to visually analyze, slice by slice, the images of the pelvic region. This task, even if quite easily performed by the expert radiologists, is difficult and tedious for the surgeons due to the complexity and variability of the anatomical structures and hence their images. Moreover, due to specific anatomy depending on the age of the patient, all the difficulties of the surgical planning are emphasized in the case of children, and a clear anatomical understanding is even more important than for the adults. For these reasons it is very important and challenging to provide the surgeons with patient-specific 3D reconstructions, obtained from the segmentation of MRI images.
In this work we propose a set of segmentation tools for pelvic MRI images of pediatric patients. In particular, we focus on three important pelvic structures: the pelvic bones, the pelvic vessels and the urinary bladder.
For pelvic bones, we propose a semi-automatic approach based on template reg-istration and deformable models. The main contribution of the proposed method is the introduction of a set of bones templates for different age ranges, which allows us to take into account the bones variability during growth. For vessels segmen-tation, we propose a patch-based deep learning approach using transfer learning, thus requiring few training data. The main contribution of this work is the design of a semi-automatic strategy for patches extraction, which allows the user to focus only on the vessels of interest for surgical planning. For bladder segmentation, we propose to use a deformable model approach that is particularly robust to image inhomogeneities and partial volume effects, which are often present in pediatric MRI images.
form for medical imaging, delivering powerful tools and user-friendly GUIs to the surgeons. Furthermore, we set up a processing and portability workflow for visual-ization of the 3D patient specific models, allowing surgeons to generate, visualize and share within the hospital the patient specific 3D models.
Finally, the results obtained with the proposed methods are quantitatively and qualitatively evaluated by pediatric surgeons, which demonstrates their potentials for clinical use in surgical planning procedures.
Publications
This work has led to the following publications (in chronological order):
• A. Virzì, C. Muller, J.-B. Marret, E. Mille, L. Berteloot , D. Grévent, N. Boddaert, P. Gori, S. Sarnacki and I. Bloch, Comprehensive review of 3D segmentation software tools for pediatric MRI usable for pelvic and abdominal surgery planning, Submitted to Surgical Endoscopy.
• A. Virzì, P. Gori, C. Muller, E. Mille, Q. Peyrot, L. Berteloot, N. Bod-daert, S. Sarnacki and I. Bloch, Segmentation of pelvic vessels in pediatric MRI using a deep learning approach, Journées Francophones de Radiologique Diagnostique et Interventionnelle (JFR), Paris, France, October 2018. • A. Virzì, P. Gori, C. Muller, E. Mille, Q. Peyrot, L. Berteloot, N. Boddaert,
S. Sarnacki and I. Bloch, Segmentation of pelvic vessels in pediatric MRI us-ing a patch-based deep learnus-ing approach. Data Driven Treatment Response Assessment and Preterm, Perinatal, and Paediatric Image Analysis (2018), Springer International Publishing, pp. 97–106
• C. Muller, A. Virzì, J.-B. Marret, E. Mille, L. Berteloot, P. Gori, T. Blanc, D. Grevent, F. Bargy, N. Boddaert, I. Bloch and S. Sarnacki, 3D patient specific models from MRI segmentation and tractography to enhance surgery planning of pelvic tumors and malformations, 19th European Congress of Pediatric Surgery, Paris, France, June 2018.
• E. Mille, C. Muller, A. Virzì, P. Gori, J.-B. Marret, L. Berteloot, D. Grevent, T. Blanc, N. Boddaert, I. Bloch and S. Sarnacki, Appraisal of sacral nerve injury by pelvic neurotractography after robotic surgery for a sacral neurofibroma in a 12 years old girl, 19th European Congress of Pedi-atric Surgery, Paris, France, June 2018.
• C. Muller, A. Virzì, J.-B. Marret, E. Mille, C. Cretolle, P. Gori, L. Berteloot, D. Grevent, T. Blanc, N. Boddaert, I. Bloch and S. Sarnacki, Analysis of the
according to spinal dysraphism, sacral anomaly and type of anorectal malfor-mation, 19th European Congress of Pediatric Surgery, Paris, France, June 2018.
• C. Muller, A. Virzì, J.-B. Marret, E. Mille, L. Berteloot, D. Grevent, T. Blanc, N. Garcelon, I. Buffet, E. Hullier-Ammard, P. Gori, N. Boddaert, I. Bloch and S. Sarnacki, Towards building 3D individual models from MRI seg-mentation and tractography to enhance surgical planning for pediatric pelvic tumors and malformations, Surgetica 2017, Strasbourg, France, 2017, pp. 113-115
• A. Virzì, J.-B. Marret, C. Muller, L. Berteloot, N. Boddaert, S. Sarnacki and I. Bloch, A new method based on template registration and deformable models for pelvic bones semi-automatic segmentation in pediatric MRI, IEEE International Symposium on Biomedical Imaging, Melbourne, Australia, 2017, pp. 323-326.
Contents
1 Context and presentation 1
1.1 Pediatric pelvic surgery . . . 1
1.2 Surgical planning . . . 2
1.2.1 Patient specific 3D models . . . 3
1.2.2 Pediatric MRI . . . 3 1.3 Research problem . . . 4 1.4 Manuscript outline . . . 6 2 Image dataset 7 2.1 Patients population . . . 8 2.2 MRI acquisition . . . 8
2.3 Manual segmentations and evaluation measures . . . 11
3 Literature review: pediatric image segmentation 14 3.1 Introduction . . . 16
3.2 Pelvic bones segmentation . . . 16
3.2.1 Methods using only image information . . . 16
3.2.2 Methods using shape priors . . . 18
3.2.3 Discussion . . . 21 3.3 Vessels segmentation . . . 22 3.3.1 Segmentation methods . . . 22 3.3.2 Discussion . . . 23 3.4 Bladder segmentation . . . 24 3.4.1 Segmentation methods . . . 24 3.4.2 Discussion . . . 25
3.5 What about deep learning? . . . 25
3.6 Discussion . . . 26
4 3D segmentation and visualization platforms analysis 27 4.1 Introduction . . . 29
4.2.1 Software tools selected for evaluation . . . 29 4.2.2 Imaging dataset . . . 32 4.2.3 Evaluation criteria . . . 33 4.3 Results . . . 35 4.4 Discussion . . . 39 4.5 Conclusion . . . 44
5 Pelvic bones segmentation 45 5.1 Introduction . . . 47
5.1.1 Context . . . 47
5.1.2 Outline . . . 47
5.2 Segmentation method: a template-based approach . . . 47
5.2.1 Generation of anatomical templates . . . 48
5.2.2 Pre-segmentation from closest template registration . . . 48
5.2.3 Refined segmentation using deformable models . . . 50
Deformable model . . . 50
Constraints on the surface evolution . . . 51
5.3 Results . . . 52
5.3.1 Landmark selection . . . 52
5.3.2 Qualitative evaluation of the segmentation results . . . 53
5.3.3 Quantitative evaluation of the segmentation results . . . 53
5.4 Conclusion and discussion . . . 59
5.4.1 Contributions . . . 59
5.4.2 Perspectives . . . 60
6 Pelvic vessels segmentation 61 6.1 Introduction . . . 63
6.1.1 Context . . . 63
6.1.2 Outline . . . 63
6.2 Segmentation method: a patch-based deep learning approach . . . . 63
6.2.1 Patches extraction . . . 64
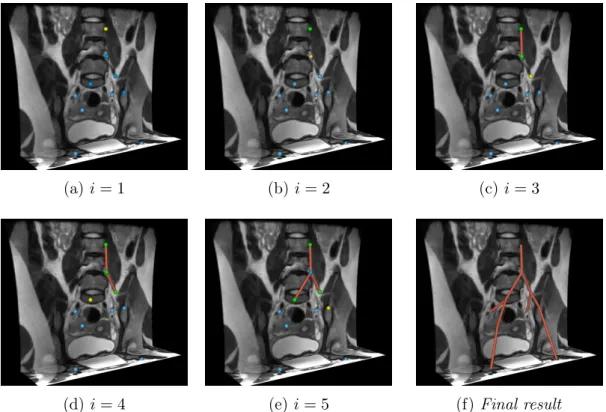
Vascular tree reconstruction . . . 64
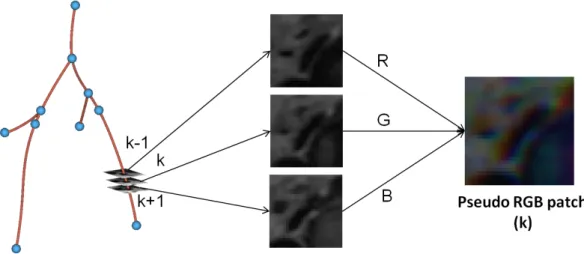
Pseudo-RGB patches extraction . . . 66
6.2.2 Deep CNN for patches segmentation . . . 67
6.3 Results . . . 68
6.3.1 Landmark selection . . . 69
6.3.2 Qualitative results . . . 69
6.3.3 Quantitative results . . . 69
6.4 Conclusion and discussion . . . 71
6.4.1 Contributions . . . 71
7 Bladder segmentation 75
7.1 Introduction . . . 77
7.1.1 Context . . . 77
7.1.2 Outline . . . 77
7.2 Segmentation method: a deformable model approach . . . 77
7.2.1 Pre-processing . . . 77
7.2.2 Pre-segmentation using level-sets . . . 78
7.2.3 Refined segmentation using parametric deformable models . 80 7.3 Results . . . 80
7.3.1 Qualitative results . . . 80
7.3.2 Quantitative results . . . 86
7.4 Conclusion . . . 88
7.4.1 Contributions . . . 88
7.4.2 Limits and perspectives . . . 89
8 3D modeling workflow and clinical applications 90 8.1 Introduction . . . 91
8.2 Graphical user interfaces . . . 91
8.3 3D patient specific modeling workflow . . . 97
8.4 Some clinical applications . . . 99
9 Conclusion and future work 103 9.1 Conclusion . . . 103
9.2 Perspectives . . . 106
A Pelvic tractography 109 A.1 Introduction . . . 110
A.1.1 Context . . . 110
A.1.2 Diffusion MRI and tractography . . . 110
A.2 Pelvic tractography segmentation . . . 113
A.2.1 Modeling the spatial relations . . . 113
A.2.2 Definition of the main pelvic nerves paths . . . 116
A.3 Preliminary results . . . 118
A.4 Conclusion . . . 120
Acronyms
1D one-dimensional. 2D two-dimensional. 3D three-dimensional. 4D four-dimensional.
ARM anorectal malformations.
ASSD Average Symmetric Surface Distance. CNN convolutional neural networks.
CT computed tomography.
CTA computed tomography angiography. DC DICE index.
DWI diffusion weighted images. FOV field of view.
GUI graphical user interface. GVF gradient vector flow. LS level-set.
MIS minimally invasive surgery.
MRI magnetic resonance imaging. ROI region of interest.
SNR signal-to-noise ratio. SSM statistical shape models. TPS thin-plate spline.
Chapter 1
Context and presentation
1.1
Pediatric pelvic surgery
The pelvis is an anatomical region that is highly complex, at the crossroad between digestive, genital and urological tracts and with high vascularization and innerva-tion. Its anatomical analysis is particularly difficult due to the complex 3D shapes of the pelvic structures and to their complex spatial relationships. Moreover, in the pelvis, the involved structures (except the bones) are soft and deformable, leading to a strong anatomical inter-patient variability.
Pelvic anatomy is even more complex for children, where organs vary during growth, both in terms of shapes and of relative spatial position. Moreover, all these difficulties are strongly emphasized in case of rare tumors and malforma-tions [3]. However, in the context of surgical planning, a clear understanding of the patient’s pelvic anatomy is essential, considering that any lesion of vascular and/or nervous structure may have a major impact on the quality of life.
Nowadays, in order to reduce as much as possible the surgical trauma while maintaining the security and efficiency of gold standard treatments, minimally invasive surgery (MIS) is widely used for pelvic and abdominal pediatric interven-tions. In fact, while classical (or “open”) surgery requires large skin and muscle incisions to allow for the access to the surgical field, MIS uses rigid, thin and long tubular cameras (3 to 10 mm of diameter) in association with surgical instruments inserted through tubular metallic or plastic ports (3 to 15 mm of diameter) trough the skin. Thanks to these small incisions, this surgical technique has several ad-vantages such as reduced post-operative pain, faster post-operative recovery and better aesthetic outcomes for the patient.
One of the latest developments of MIS is robotic surgery (see Figure 1.1). The main advantages of this technique are i) a magnified 3D visualization, which allows the surgeon to keep the depth information while looking at the console screen and
(a) (b) (c)
Figure 1.1: Example of MIS using a da Vinci Surgical System (Intuitive Surgical, Mountain View, Calif). The surgeon performs the operation looking at a screen (a), manipulating dedicated tools (b) that guide the movement of the robotic arms (c) in contact with the patient. Images drawn from the material in [112].
ii) the presence of 360°articulated instruments, which aims to make robotic surgi-cal experience as “smooth” as the open surgery one. However, this kind of surgery lacks, as classical MIS, of haptic (force) feedback. This produces the loss of the surgeon’s sense of touch, making the robotic interventions clearly more complex than the open ones.
Therefore, due to the extreme complexity of the pelvic anatomy and of the robotic interventions, surgical planning plays a crucial role on ensuring the best possible outcome for the patients.
1.2
Surgical planning
Surgical planning relies on the patient’s anatomy and is based on medical images acquired before the surgery. This is in particular the case for pelvic surgery on children, for various indications such as malformations or tumors. As previously mentioned, in this particular anatomical region, due to its high vascularization and innervation, a good surgical planning is extremely important to avoid potential functional damages to the patient’s organs that could strongly affect their quality of life.
In clinical practice the standard procedure is still to visually analyze, slice by slice, the images of the pelvic region. This task, even if quite easily performed by the expert radiologists, is difficult and tedious for the surgeons due to the complexity and variability of the anatomical structures and hence their images. Moreover, due to specific anatomy depending on the age of the patient, all the difficulties of the surgical planning are emphasized in the case of children, and a clear anatomical understanding is even more important than for the adults. For these reasons it is
dimensional (3D) models, obtained from the processing and analysis of anatomical images.
1.2.1
Patient specific 3D models
3D patient specific modeling has been developed and proved useful in very few spe-cific studies within the general surgical field, to reduce the time required for the surgery giving to the surgeon a major awareness of the patient specific anatomy and of the relationships between the target structures. As demonstrated by the surgeon experience, the more complex the anatomy of the surgical region of in-terest, the more complete a 3D reconstruction is useful. This gives the surgical staff a powerful planning tool to improve the approach to critical interventions during the pre-operative phase [39, 78, 96]. The advantages of the 3D models in daily practice are especially obvious for surgical planning in oncology, allowing the surgeon to better understand the spatial relationships between the tumor and the surrounding structures. For anorectal malformations (ARM), the 3D models of nerves and muscles may also be useful to better describe the anomalies of the spinal cord and/or muscles frequently associated with such malformations. This should be useful not only to refine the classification of these malformations, but also to evaluate the impact of the different types of surgical approaches and of potential rehabilitation techniques (neuromodulation, physiotherapy). More than just the surgical planning, patients specific 3D models can also be useful during the post operative follow-up (e.g. highlighting complications of the surgery, critical spontaneous evolution, effects of treatments such as chemotherapies or radiother-apies in tumors). Finally, 3D models could also be extremely important to better inform patients and their parents about the pathology and its evolution.
These models can be obtained through processing of medical images. In par-ticular magnetic resonance imaging (MRI), due to its good contrast between the soft tissues and its non-ionizing nature, is the reference imaging modality for the pelvis in pediatric patients [32, 108]. Moreover, with respect to other modalities, MRI also allows obtaining images that represent the water diffusion properties of the tissues. These images, called diffusion weighted images (DWI), are particularly interesting since they allow obtaining 3D representations of the nerve fibers. For a detailed description of the MRI principles, please refer to [49].
1.2.2
Pediatric MRI
MRI acquisitions in pediatrics raises several problems compared to the adults, which have direct impact on the image quality.
During the acquisition, in order to obtain good quality images, the patient has to stay as motionless as possible. This requirement, even if easily accomplished
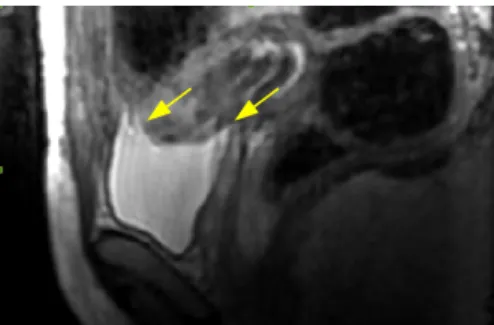
with adult patients, is more difficult to fulfill with the non-cooperative child. In fact, due to the narrow tube of the MRI machine and to the strong noise that the machine produces during the acquisition, the child tends to move, compromising the whole exam. In order to avoid multiple MRI acquisitions, a mild sedation of the children could be performed (see Chapter 2). However, children’s motion can not be totally avoided, which can produce images corrupted by motion artifacts, as shown in Figure 1.2.
Figure 1.2: Example of motion artifact on a sagittal slice of a T2-w MRI, which produces blurred and repeated structures borders (yellow arrows).
Another strong difference between the adult and the pediatric MR images is given by the different sizes of the target structures. This produces higher par-tial volume effects for children than for adults (using the same MRI acquisition parameters), as shown in Figure 1.3. The partial volume effects are due to the contribution of multiple tissues to the image intensity inside a single voxel. In particular, the bigger the size of the voxel, in relation to the dimensional scale of the structures of interest, the bigger will be the blur close to the structures boundaries. This effect could be partially solved by using higher resolution images for children than for adults. However, due to harder acquisition time constraints in pediatrics than for adults, this is not usually done in clinical practice.
1.3
Research problem
Patients specific 3D modeling is an extremely powerful tool for a better under-standing of the patient’s anatomy, hence improving the surgical planning pro-cedure, especially for the pelvis in pediatric patients. These 3D models can be obtained by processing the patient’s MRI, which is the reference image modality for the pelvis. The reference procedure to obtain the 3D models is manual segmen-tation. However, this procedure is extremely tedious and time consuming, which clearly limits the routine use of 3D models in clinical practice. For this reason,
(a) (b)
Figure 1.3: Coronal T2-w MRI slices of (a) an adult patient and (b) a pediatric patient, corresponding to the same anatomical pelvic region. The pediatric image has stronger blur on structures boundaries than the adult image.
faster segmentation results. However, in the literature, there is a strong lack of segmentation methods for pelvic structures applicable to pediatric populations. This is mostly due to the strong complexity of the involved structures and to the image acquisition constraints in pediatrics.
For this reason, in order to bridge the gap between adults and children treat-ments, there is a strong need for novel segmentation tools for pediatric pelvic MRI. Moreover, the developed methods should be user friendly, robust and should re-spect the time constraints of the daily clinical practice. In this work we will focus on three pelvic structures: i) the pelvic bones, which constitutes a core structure of the pelvis and that serve as spatial reference for surgical planning, ii) the vessels, whose preservation is essential in order to avoid potential functional damages to the patient’s organ, and iii) the bladder, which has a central position in the pelvic region. For each structure of interest, the proposed approach strongly relies on prior knowledge on anatomy, including its variability.
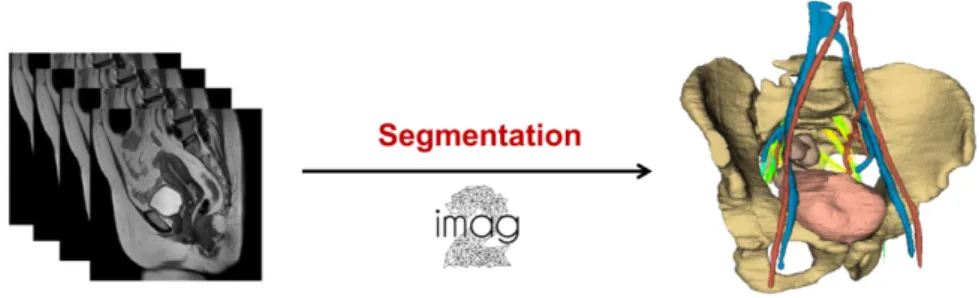
Figure 1.4: Aim of this work: obtaining patient specific 3D models from MRI images.
1.4
Manuscript outline
This manuscript is structured around the design of a set of segmentation tools, specific for pelvic structures in pediatric MRI, integrated in a complete framework for surgical planning.
In Chapter 2, we describe the image dataset (patients population and imaging sequences) used in this work.
In Chapter 3, we review the state of the art on pelvic segmentation, with a par-ticular focus on the complexity of pediatrics.
In Chapter 4, we analyze and evaluate a set of 3D segmentation and visualiza-tion platforms, which can be used for pelvic MRI images. This review is a major contribution of this work, and it is, to the best of our knowledge, the first study that takes also into account the segmentation performances on the software tools evaluation.
In Chapter 5, we present a new method for pelvic bones segmentation, which is the first study for their segmentation in pediatric MRI. The proposed method is based on template registration and deformable models, and takes into account the bones variability during growth.
In Chapter 6, we present a novel approach for the segmentation of the pelvic vessels in pediatric MRI. The proposed method consists on a semi-automatic extraction of a set of axial patches containing the vascular structures of interest, followed by an automatic segmentation procedure based on CNN and transfer learning. In Chapter 7, we present a method for bladder segmentation based on a modified version of the Chan-Vese level set model, aiming to obtain a robust presegmenta-tion, and on a parametric deformable model for segmentation refinement.
In Chapter 8, we present the developed GUIs, the novel workflow for surgical planning based on the developed tools, and some interesting clinical applications of patient specific 3D modeling.
In Chapter 9 we present our conclusions and an overview of potential future works. Lastly, in Appendix A we present our preliminary work on the 3D modeling of the pelvic nervous system, based on tractography.
Chapter 2
Image dataset
Abstract
In this chapter we present the image dataset used in this study, describing the patients population and the MRI acquisition protocol. Finally, we describe the dataset of the manually annotated images and we present the evaluation measures that will be used to validate the proposed segmentation methods.
Contents
2.1 Patients population . . . 8 2.2 MRI acquisition . . . 8 2.3 Manual segmentations and evaluation measures . . . . 11
2.1
Patients population
From December 2015 onward, each pediatric patient hosted in Necker Enfants Malades Hospital for a pelvic tumor or malformation was considered eligible for a perspective clinical study called “Anatomie computationnelle dans la chirurgie des tumeurs et malformations de l’enfant” (Computational anatomy for surgery of tumors and malformations in pediatric patients).
The exclusion criteria for the study were:
• patient being younger than 3 months or older than 18 years;
• contra-indication to MRI exam (e.g. intraocular metallic foreign body, pace-makers, mechanic cardiac valve, vascular clips for brain aneurysm);
• participation to a clinical trial demanding dosing of a new molecule in the 30 days before the MRI exam;
• MRI exam requiring general anesthesia.
All the socio-demographic, clinical and para-clinical data were collected in an interactive anonymous database hosted at the Imagine Institute. All patients or patient’s parents gave their informed consent according to ethical board committee requirements (N°IMIS2015-04).
From December 2015 until October 2018, 88 patients were included in the study:
• 38 patients affected by pelvic tumor;
• 47 patients affected by pelvic malformation; • 3 control patients.
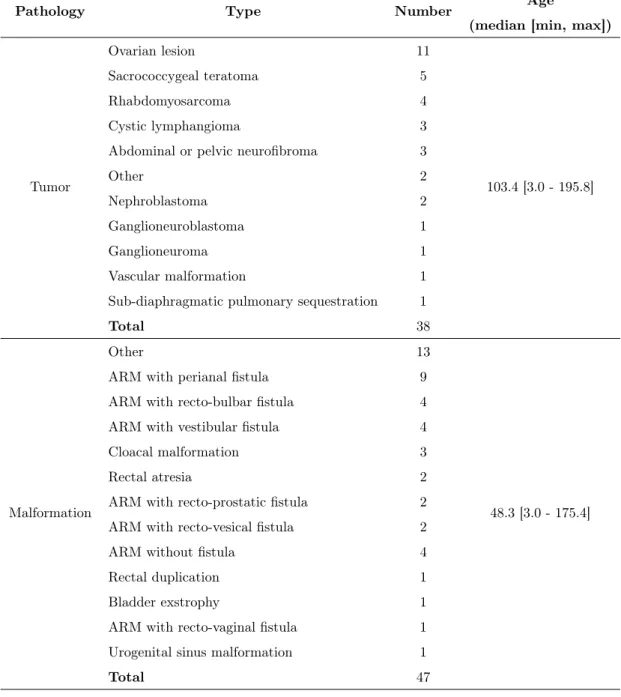
More details on the patients population are provided in Table 2.1.
2.2
MRI acquisition
The images acquisitions were performed with a 3T MRI scanner (GE Health-care ®) hosted in the radiology service of the Necker-Enfants Malades hospital
(Pr. Nathalie Boddaert, Dr. Laureline Berteloot). In order to optimize the im-ages signal-to-noise ratio (SNR), a cardiac coil (32 channels) was used for the patients younger than 10 years old. An abdominal coil (16 channels) was used for
Pathology Type Number Age
(median [min, max])
Tumor Ovarian lesion 11 103.4 [3.0 - 195.8] Sacrococcygeal teratoma 5 Rhabdomyosarcoma 4 Cystic lymphangioma 3
Abdominal or pelvic neurofibroma 3
Other 2
Nephroblastoma 2
Ganglioneuroblastoma 1
Ganglioneuroma 1
Vascular malformation 1
Sub-diaphragmatic pulmonary sequestration 1
Total 38
Malformation
Other 13
48.3 [3.0 - 175.4]
ARM with perianal fistula 9
ARM with recto-bulbar fistula 4
ARM with vestibular fistula 4
Cloacal malformation 3
Rectal atresia 2
ARM with recto-prostatic fistula 2
ARM with recto-vesical fistula 2
ARM without fistula 4
Rectal duplication 1
Bladder exstrophy 1
ARM with recto-vaginal fistula 1
Urogenital sinus malformation 1
Total 47
Table 2.1: Patients population and corresponding pathologies. Patients’ ages are expressed in months.
A respiratory trigger, made possible by measuring the breathing frequency with a dedicated belt, was sometimes used, in order to reduce the breathing movement artifacts. However, this procedure increases the acquisition time, especially in case of high breathing frequencies. For this reason, no respiratory trigger was normally
used for the youngest patients.
A glucagon injection, based on an already established acquisition protocol, was performed in order to reduce the digestive peristalsis. The MRI exam is then followed by an oral sugar administration to the patient. As already mentioned, general anesthesia was never performed. However, a mild sedation with Pheno-barbital (5mg/kg dose) was sometimes required. Asthma, pathological amygdale and adenoids hypertrophy constitutes contra-indication to this sedation procedure. The total duration of the exam is 30-45 minutes.
MRI sequences
The full MRI acquisition is composed by: i) a set of MRI sequences needed for the clinical analysis of the patients (a well-established acquisition protocol of the radiology department of the Necker Hospital), and ii) two research sequences, added in the context of the 3D patient modeling. In particular, the two research sequences are:
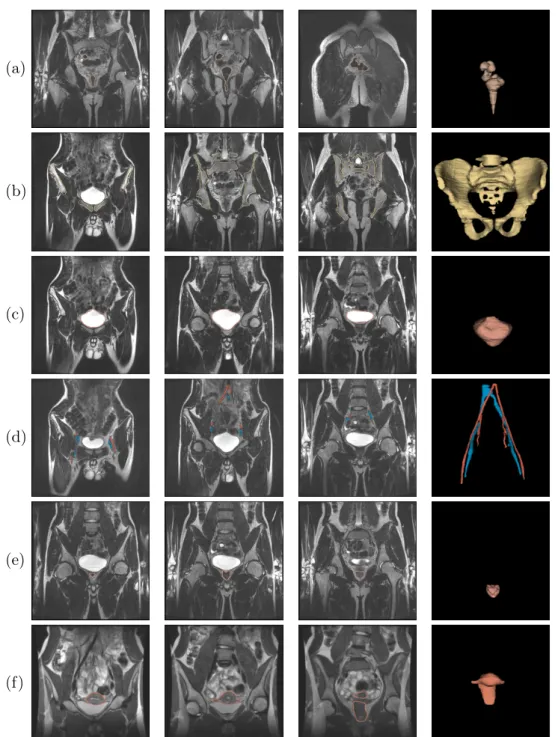
• CoroT2cube: the volumic images resulting from this sequence were chosen as anatomical reference for the developed segmentation methods. This sequence was chosen due to its overall good intensity contrast for the anatomical struc-tures of interest (i.e. bones, bladder, vessels, rectum). Moreover, the spatial resolution being quasi-isotropic, this image is particularly well suited for 3D segmentation methods. Some acquisition examples are shown in Figure 2.1. • DWI : the images resulting from this sequence, containing the tissues diffu-sion information in several spatial directions, are essential in order to obtain nerve fibers reconstruction through tractography algorithms [55]. More de-tails on DWI, tractography and on how nerves reconstructions were included into the patient 3D models are given in Appendix A.
The acquisition parameters of these two sequences were progressively optimized since December 2015, in order to obtain a good compromise between the image quality and the acquisition time. For this reason, the images of the patient dataset have different acquisition parameters, which produces, for example, images differ-ent spatial resolutions. Some details on the most up-to-date sequences parameters are given in Table 2.2.
(a)
(b)
(c)
(d)
(e)
Figure 2.1: Examples of CoroT2cube MRI images of patients of (a) 1 year old, (b) 2 years old, (c) 5 years old, (d) 8 years old and (e) 12 years old. Coronal, sagittal and axial slices are depicted from left to right. Red, yellow and green lines represent the slices interesections.
2.3
Manual segmentations and evaluation
measures
In order to validate the performances of the proposed segmentation methods (see Chapters 5, 6 and 7), manual reference segmentations of the T2-w images need
Sequence Acq. Plan TR[ms] [ms]TE FA[°] N b Voxel Size[mm3] Acq. time[min]
CoroT2cube coronal 2000 68.36 90 - - 1x1x1 5-10
DWI axial 5893 57.4 90 25 600 1.25x1.25x3.5 5-10
Table 2.2: MRI sequences used in this work and most up-to-date acquisition pa-rameters. TR, FA and TE stand for repetition time, flip angle and time echo, respectively. N and b stand for the number of diffusion directions and the diffu-sion b-value, respectively.
to be performed. However, this procedure is very time consuming (see Chap-ter 4). Moreover, in order to evaluate the inChap-ter-user variability for each annotated structure, each image was manually segmented by two different users. For these reasons, a subset of the whole patients’ population was manually segmented. In particular, manual segmentations of the bones and the bladder were performed on 25 patients (12 tumors, 13 malformations) and manual segmentations of the pelvis vessels were performed for 35 patients (22 tumors, 13 malformations). More details on the two manually annotated subsets are given in Table 2.3.
Subset N_tot N_tum N_malf Average voxel size[mm3] Average Image Size[voxels] Bones/Bladder 25 12 13 0.94x0.94x0.71 348x348x198
Vessels 35 22 13 0.92x0.92x0.73 346x346x197
Table 2.3: Description of the two T2-w MRI subsets used for the validation of the proposed methods.
In order to quantitatively compare the reference manual segmentations with the results obtained with the proposed methods, we use the DICE index (DC) [31] and the Average Symmetric Surface Distance (ASSD) [52], defined as:
DC(A, B) = 2|A ∩ B| |A|+|B| , ASSD(A, B) = 1 |S(A)|+|S(B)| X sA∈S(A) min sB∈S(B) ||sA−sB||2+ X sB∈S(B) min sA∈S(A) ||sA−sB||2 ! ,
where S(A) and S(B) are the sets of surface voxels of A and B, sA and sB are
points on S(A) and S(B) respectively, |.| denotes the cardinality and ||.||2 the
Chapter 3
Literature review: pediatric image
segmentation
Abstract
This chapter reviews the main existing segmentation methods, focusing on the anatomical structures of interest of this work: the pelvic bones, the vessels and the bladder. Due to the lack of studies directly applied to pediatric images, we also discuss methods applied to adults and we analyze the reasons that make them difficult to be applied to the pediatric population.
Contents
3.1 Introduction . . . 16 3.2 Pelvic bones segmentation . . . 16 3.2.1 Methods using only image information . . . 16 3.2.2 Methods using shape priors . . . 18 3.2.3 Discussion . . . 21 3.3 Vessels segmentation . . . 22 3.3.1 Segmentation methods . . . 22 3.3.2 Discussion . . . 23 3.4 Bladder segmentation . . . 24 3.4.1 Segmentation methods . . . 24 3.4.2 Discussion . . . 25
3.1
Introduction
Image segmentation is one of the most widely explored topics by the medical image processing community. However, there is a huge gap in terms of research effort between the adult and the pediatric field. Almost all the studies on pediatrics are focused on specific anatomical structures, such as the brain in MRI [30, 58, 132] (which is the most studied structure), the heart in ultrasound images [4,86,87] and the kidneys in computed tomography (CT) [13] and ultrasound images [17, 82]. Other isolated studies on pediatric image segmentation are, for example, dedicated to adipose tissue segmentation in MRI [41, 64].
As described in Chapter 1, the main structures of interest for pelvic surgical planning are the pelvic bones, the vessels, the bladder and the rectum. To the best of our knowledge, the only studies that address the problem of segmentation of one of these structures, in pediatrics, are focused on the bone structures on CT images [6, 7].
Considering the strong lack of studies on pelvic structure in pediatric images, we will now investigate the methods that were successfully applied to adults (and the few that were applied to pediatrics). Moreover, we will analyze the reasons that make them difficult to be used for our pediatric application.
3.2
Pelvic bones segmentation
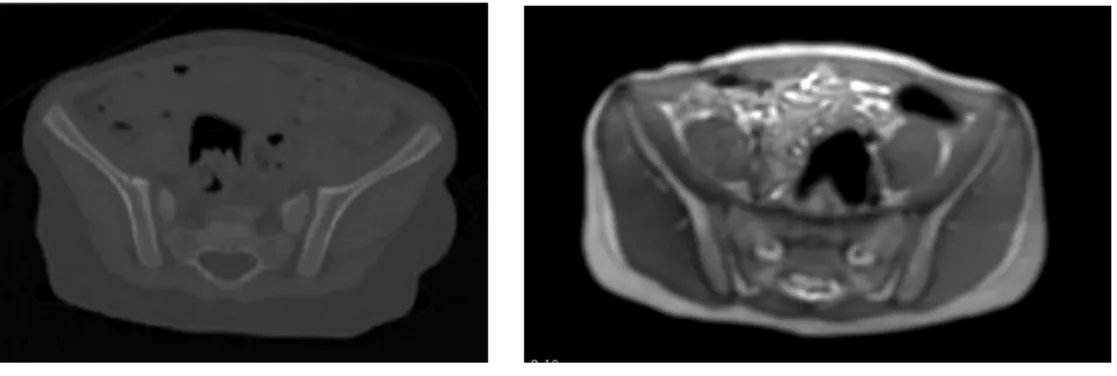
The most widely used imaging modality for the analysis of the bone structures is CT. This is mostly due to the high density of the bones compared to the other tissues, which produces images with high contrasted and hyperintense bones struc-tures (see Figure 3.1). For this reason, many successful CT bones segmentation methods were developed, especially for adult patients. However, some studies also addressed the problem of bones segmentation in MRI images of adults patients.
Both for CT and MRI, it is possible to group the existing methods into two macro categories: i) the methods that do not require shape priors on the bones structure and ii) the ones that require shape priors in term of anatomical atlases or statistical shape models (SSM). These methods are discussed in the following sections.
3.2.1
Methods using only image information
Gray-levels thresholding is surely one of the most easy ways to segment an image, when the structures to be segmented can be clearly identified and distinguished from the others based on their intensity values. This condition, which cannot be
(a) Axial CT slice (b) Axial MRI slice
Figure 3.1: Comparison between pelvic CT and MRI images.
even if global thresholding generally leads to a raw but coherent approximation of the bones, this may not be sufficient to obtain accurate segmentations for clinical applications. For this reason several studies on CT, even if still based on a strong assumption on the bones gray-level intensities, proposed more complex method-ologies. For instance, some methods have strongly focused on the pre-processing of the CT images, in order to ease the following intensity-based segmentation proce-dure. In particular, in [127] the authors propose to use a combination of high and low pass filters, specifically designed for non isotropic images, in order to enhance the bones regions while smoothing the other isolated hyperintense components of the image. Global thresholding and morphological operations are then used for final segmentation and separation between the femur and the pelvis. A similar ap-proach was used in [118], in which the author propose to enhance the pelvic bones using wavelets filtering and morphological operations and to use region growing for segmentation.
Some other methods relied also on the image boundaries information. In [43], the authors propose a level-set for the segmentation of the bones in 3D CT data, with a particular focus on the femurs and the vertebral bodies. In particular, they propose to use an energy formulation that incorporates both intensity and boundaries features, and to use a mechanical-based model for automatic detection of small spurious bridges between separated bones. A similar approach, focused on the interface problem between the femurs and the acetabulum, was proposed in [63]. In this case, a bone boundary enhancement filtering is followed by a graph-cuts approach using intensity and boundary based terms. A final post-processing, based on morphological erosion, is then used to identify and separate the femurs and the pelvis.
While the previous studies were applied to adult patients, in [6] and [7] the authors focused on pediatric patients. In particular, in [6] the authors propose to segment the pelvic bones in pediatric CT using opening-by-reconstruction,
thresh-olding and a final refinement using deformable models. The selection of the land-marks needed for the reconstruction procedure requires the prior segmentation of other anatomical structures, such as the peripheral fat, the peripheral muscles and the spinal canal. A similar approach, based on multiple thresholdings and math-ematical morphology operations, was proposed by the same authors in [7] for the segmentation of the spinal canal, the ribs and the vertebrae.
If gray-level intensity information is extremely relevant in CT, this is not the case in MRI. For this reason, some studies on MRI rely on texture information. For instance, in [12] the authors propose to segment the knee bones in MRI using an approach based on the extraction of bones features from the phase of the MRI signal. The multiscale texture features are then combined together and classified in a pixel-wise fashion using a support vector machines (SVM) classifier [117], in order to obtain the final segmentation. Another example is given in [74], using a texture-based geodesic active contour, the texture being represented as the local intensity variance of the image, for the knee bones (femur and tibia) segmentation in 2D MRI. For the same application, in [1] the authors propose a method based on graph-cuts. In particular, a graph-cuts approach, opportunely initialized inside the target bones, is used to obtain a pre-segmentation mask of the target structures. This mask is then refined using mathematical morphology and priors on the bone texture, in order to extract the final tibia and femur 2D masks. Graph-cuts were also used in [16] for the segmentation of vertebral bodies on MRI. In this study, the authors propose to pre-process the image using an anisotropic diffusion filtering and an image intensity correction. Then, a graph-cuts approach is proposed to segment the central sagittal 2D slice of the image.
3.2.2
Methods using shape priors
Atlas-based methodsAn anatomical atlas is defined as a labeled image representing the standard anato-my of a certain population. Each label can be either represented as binary mask or a vector indicating the positions of each structure boundary. The basic idea of atlas-based segmentation methods is to register the atlas volume to the target vol-ume and, consequently, to transfer the atlas labels on the target volvol-ume, obtaining the final segmentation. An example of the atlas-based methodology is depicted in Figure 3.2.
Due to the shape complexity of the pelvic bones, the use of the prior anatomical knowledge, expressed as anatomical atlases, was shown to be very effective. For instance, in [94] the authors propose to segment the pelvic bones in 3D CT images using the multiscale morphon algorithm [62] for the registration phase and to
Figure 3.2: Illustration of the atlas-based method principle for an abdominal CT image. Image drawn from [45].
pelvic bones segmentation in 3D CT images was used in [36]. In particular, the authors propose to initialize the registration fitting rigidly the atlas segmentation to a rough segmentation of the target image, obtained by gray-level thresholding. Then, the two images are non-rigidly registered, obtaining the final segmentation by label propagation.
One of the main issues of these methodologies is that the segmentation results are obviously highly dependent on the chosen atlas. Moreover, as the inter-subject variability is not generally taken into account, such methods may give wrong re-sults for structures with high variability or for patients with pathologies [45]. In order to partially solve these problems, some authors propose to use multi-atlas approaches [21,128]. In [128], the authors propose to use several atlases, obtained by different reference images, for the segmentation of pelvic bones in MRI images. Each atlas of the dataset is first registered to the target image. Then, atlases that generate the most accurate registrations (normalized mutual information is used as similarity measure) are selected and the corresponding labels are propagated to the target image. Finally, the labels are combined together in order to obtain the final segmentation. A very similar approach was proposed in [21] for segmentation of pelvic bones and femurs in CT images. In particular, the authors propose to initialize the registration thanks to a set of automatically extracted landmarks and to refine the final segmentation thanks to a graph-cuts method.
However, image registration, especially in 3D, could be very time consuming. For this reason some authors proposed to substitute this procedure with deformable models approaches. For instance, in [48] the authors propose to segment jointly the pelvic bones, the femurs and the leg muscles in MRI starting from a mus-coloskeletal template. In particular, the anatomical template is registered to the image thanks to some user-selected landmarks, obtaining a 3D mesh which serves as initialization for a deformable model approach which includes non-intersection
constraints between the different structures. A very similar approach was proposed in [5] for the femur segmentation in MRI images.
SSM-based methods
A statistical representation of an object is formed by identifying a set of landmark points, or eventually a mesh, on an object boundary and by analyzing the variation of each landmark across a set of training images. Constructing a statistical shape model (SSM) basically consists in extracting, through principal component analysis (PCA), the mean shape and a number of modes of variation from a collection of training samples (see Figure 3.3). For further details, an extensive review on statistical shape models can be found in [51].
Figure 3.3: Hip bone shape models built from the 3D models of 28 adult patients. The color map illustrates the normalized variation of the primary mode: (a) the bilateral hip SSM; (b) the unilateral hip SSM; (c) pelvic bone SSM; (d) femur SSM. Image drawn from [128].
The ability of the SSMs to incorporate the anatomical shape variations is a strong advantage with respect to the anatomical atlases, which often represent only the mean shape of a given structure, and several application were developed for pelvic bones segmentation.
The most usual segmentation strategy consists of a first registration of the mean shape of SSM to the target image and on a deformable model, whose evolution is constrained on the image space defined by the SSM. For instance, this kind of approach was used in [65] for pelvic bones segmentation in 3D CT images. The authors propose to manually register the SSM to the target image thanks to a set of user selected landmarks. The final segmentation is obtained through a deformable model, whose evolution is guided by a set of edge points obtained by thresholding the CT image. A similar registration approach was proposed in [102] for pelvic bones and femurs segmentation in 3D MRI images. However, in this study, the
that guide the deformable model evolution are modified by decreasing the SSM contribution and increasing the image-based one. This kind of strategy, aiming to reduce the shape constraints on the final segmentation step in order to have better local results, was also employed in [104] for pelvic segmentation in CT and, by the same authors, in [105] for knee bones segmentation in MRI.
While the previous studies were mostly focused on the final step of the segmen-tation procedure (the deformable model evolution), some studies focused on more complex ways of building the SSMs. For instance, in [136] the authors propose to use a multi-object hierarchical SSM to jointly segment the pelvis and the femurs in CT images, ensuring non overlapping constraints between the structures while ensuring good local results. In [133], the authors propose to generate a SSM of the pelvic bones that incorporate both shape and gray-level intensity variations in CT images, in order to ease the registration with the target image. Finally, in [19] the authors propose a modified version of a standard SSM which allows focusing on the shape variations of predefined anatomical regions, by manually assigning different weights to the SSM points.
3.2.3
Discussion
CT is the most widely used imaging modality for bones segmentation. Many successful studies were developed for adults and, more rarely, for pediatric pa-tients. Due to the hyperintense nature of the bones in CT, most of the studies use intensity-based approaches and are very difficult to extend to MRI. For this reason, studies on MRI generally rely on the texture information of the bones. However, these approaches were applied to 2D images and to bones with easy shapes, such as the knee and the vertebral bodies. Moreover, since these methods are dedicated to adult patients, they do not take into account the bones texture variability during growth.
Several methods based on anatomical shape priors, in terms of atlases of SSM, were successfully applied to pelvic bones segmentation, both in CT and MRI. In particular SSM-based methods, able to model shape variation within a given population, were shown to be extremely efficient. However, in order to build a proper SSM, a large number of manually annotated data is needed, which is not easy to obtain in pediatrics. Moreover, due to the strong differences in shape and connectivity of pelvic bones during growth, creating a single SSM could not be trivial (a point to point correspondence between the annotated data have to be ensured [65]) and it could not, eventually, well represent the different growing phase of the children.
3.3
Vessels segmentation
3.3.1
Segmentation methods
Most of the studies on vessels segmentation are applied to angiographic images, such as CTA and MRA (an extensive review can be found in [61] and [69]). These image modalities often rely on the injection of a contrast agent and specific ac-quisition protocols, producing vessels enhanced images (see Figure 3.4a). In case of MRA and CTA, acquisitions are often calibrated such that vessels gray-level intensities correspond to predefined intensity ranges. This property was effectively incorporated in various intensity-based methods. In [11], the author propose to segment vessels in angiographic images through a region-growing technique based on a fixed intensity threshold. Nevertheless, angiographic images often suffer from non-uniformly distributed contrast agent inside the vessels, especially in small ves-sels. Therefore, in badly conditioned images, the application of a global threshold is not a sufficient approach for the segmentation of the vessels. In this context, in [134] the authors propose a competitive region-growing method, which takes into account both vessels and background intensity information and uses locally adaptive thresholds for segmentation.
Many methods for vessels lumen segmentation also rely on active contour for-mulations, both parametric [81,84,113,135] and non-parametric [28,75,98,119]. When using parametric active contours, the contour evolution is often constrained by previously detected vascular centerlines, which are normally detected starting from a set of user-selected seeds (e.g. using minimal paths techniques [72]). For instance, in [84] the authors propose a 3D parametric active surface method, where the surface evolution is axially constrained with respect to the vessels centerline curve. A similar method is proposed in [135], introducing a deformable tubular model, where a surface mesh is optimized with respect to the centerline curve. Another example is given in [53], in which the authors propose to segment vessels lumen in 3D images using 2D snakes evolving in perpendicular cross-sections of the vessels centerlines.
A big amount of research work is also dedicated to the design of vessels en-hancement filters for angiography images, mainly based on the anisotropic and hyperintense nature of the vessels, which can be used to ease the segmentation procedure. For instance, in [42] and [101], the authors propose to analyze the im-age Hessian matrix, which incorporate the multi scale second order local structure of the image. A measure of vessel likeliness is then extracted as a function of the Hessian eigenvalues. Other popular vessels enhancement filters are based, for in-stance, on the spatial covariance of image gradients vectors [66] and on anisotropic
ment filters images on the segmentation accuracy of an intensity based algorithm can be found in [95].
(a) MRA (b) Filtered MRA
Figure 3.4: Example of vesselness filtering [42] on a MRA volume (maximum intensity projection). Images are based on material from [42].
The tubularity feature of the vessels was also used in many studies to post-process the segmentation results. For instance, in [37], the authors propose to generate, from a collection of 2D cross-sectional vessels segmentations, 3D sur-faces as generalized cylinders. It is important to remark that this cylindrical representation of the vessels could not be valid for big vessels, eventually highly collapsed due to their non rigid musculature, such as the vena cava. Other kinds of post-processing approaches rely, for example, on skeletonization techniques and subsequent pruning strategies to remove spurious vessels branches.
3.3.2
Discussion
A large number of studies addresses the problem of vascular segmentation in an-giography images. These image modalities often rely on the injection of a contrast agent and on specific acquisition protocols, producing vessels-enhanced images. However, the use of contrast agents is not always recommended in clinical practice, especially for pediatric patients [111]. For this reason, standard MRI acquisitions (see Chapter 2 for further details) are usually chosen for pediatric pelvis exams. The use of standard MRI makes it difficult to apply the methods developed for angiography images, since these images are specifically designed for strong ves-sels enhanced images. Moreover, for pediatric patients, there are harder clinical constraints on the scan acquisition time than for adults, which do not allow the physicians to considerably increase the images resolution. This, coupled with a smaller size of the vessels walls for pediatric patients, produces images with higher partial volume effects compared to adults. Finally, most of the existing studies
do not address the problem of labeling the vessels into vein and arteries, which is essential for surgical planning applications.
(a) (b) (c) (d)
Figure 3.5: Examples of pediatric T2-w MRI slices, focused on the vessels regions. White arrows indicate missing boundaries between the vessels and the surrounding tissues (a, b) and between the veins and the arteries (c, d).
3.4
Bladder segmentation
3.4.1
Segmentation methods
Different successful methods for the segmentation of the bladder on CT images have been reported in the literature. On the other side, only few studies on MRI images were carried out. As an example, in [14] the authors propose an approach based on watersheds with automatic marker extraction for the segmentation of CT images. The watershed markers are based on the image intensity histogram. In [109], the authors propose a method incorporating both shape and appearance information in a 3D graph cuts framework for the simultaneous segmentation of prostate and bladder. Another interesting approach for CT images is proposed in [25]. In this study, the authors propose to identify first a region of interest (ROI) that contains the bladder, starting from a model of the already segmented pelvic bones. Secondly, a pre-segmentation mask is obtained using a modified version of seeded region-growing that also incorporates mathematical morphology operations. Finally a parametric deformable model, using the pre-segmentation as initialization, is used to obtain the final segmentation result. The idea of region growing for bladder segmentation was also proposed in [79] for CT images and in [92] for MRI images. In [44] the authors propose to segment the bladder on T1-w MRI images using deformable models and also relying, in their formulation, on prior knowledge about the bladder intensity. In all the previous methods, the bladder has been segmented considering only the border corresponding to the inner
this assumption is only if the bladder is completely full of urine. Therefore, some methods have been proposed to segment both the inner and outer walls of the bladder, using active contours methods. In [35] a coupled level-sets framework for segmentation of the bladder wall on T1-we MR images is proposed. Starting from the inner bladder segmentation, the authors propose to segment the outer bladder wall using a level-set, whose energy formulation is based on a regional adaptive clustering algorithm. However, even if particularly interesting, this methodology seems computationally expensive [44]. A similar segmentation strategy for 2D T2-w was proposed in [76]. In particular, in this study some prior information on the bladder wall thickness is incorporated, in order to segment the outer bladder border.
3.4.2
Discussion
Several methods for bladder segmentation were developed, especially for CT im-ages. However, even if these techniques led to promising results, they are not easy to extend to MRI images, due to the different intensity representations of the two modalities. For this reason, specific methods were developed for MRI. However, intensity based methods, such as the ones that rely on region-growing techniques, could be very sensitive to intensity inhomogeneities, such as the ones generated by MR bias fields. Active contours, especially level sets methods, appears to be the best solution for bladder segmentation in MRI. However, none of the existing methods was tested on pediatric patients, which present higher intensity inhomo-geneities and higher partial volume effects. Finally, segmentation methods for the outer wall of the bladder were reported as computationally expensive or applied to high resolution 2D images.
3.5
What about deep learning?
In the last years, deep learning methods and in particular convolutional neural networks (CNN) have shown excellent performances in various medical imaging tasks [23, 33, 60, 73, 83]. However, deep learning methods usually require a huge number of manually annotated data, which is really difficult to obtain in the med-ical field, and especially in pediatrics. To partially bypass this constraint, recent studies [8, 77, 106, 131] have relied on transfer learning [90] from pre-trained net-works on large datasets of natural images (e.g. ImageNet [27]). However, these studies cannot be directly applied to volumic data, due to the nature of the training dataset (e.g two-dimensional (2D) color images for ImageNet). Moreover, discard-ing the 3D nature of medical images would result in a loss of useful information for the segmentation task. For this reason, some studies [106, 131] successfully
pro-posed to generate 2D pseudo-color images from volumeic gray-level images, aiming to incorporate 3D information. This is the line adopted in Chapter 6 for vessels segmentation.
3.6
Discussion
As reported in this chapter, very few segmentation methods were developed for pelvic structures in pediatric images. In fact, the segmentation task is more diffi-cult in pediatric images than in adult images because of the nature of the target structures (e.g. shape variability during growth, high partial volume effect) and harder constraints on the imaging acquisitions (e.g. no CT or angiography acqui-sitions, low image resolution).
However, despite the strong lack in organ-specific segmentation methods for pe-diatrics, several generic medical image processing platforms are freely distributed as open-source software. These platforms, thanks to different segmentation tools (e.g. region growing, active contours, graph-cuts), aim to speed up the segmenta-tion procedure compared to the fully manual annotasegmenta-tion of the images. In order to understand whether these generic segmentation tools could fit to the time con-straints required by the clinical practice (less than 2 hours for a full 3D segmen-tation), a comprehensive review of these open source software is essential. This will be the aim of Chapter 4, which will lead us to the choice of a specific software and its associated programming environment, namely 3D Slicer. The new segmen-tation methods proposed next, in Chapters 5-7, will be then implemented in this environment.
Chapter 4
3D segmentation and visualization
platforms analysis
Abstract
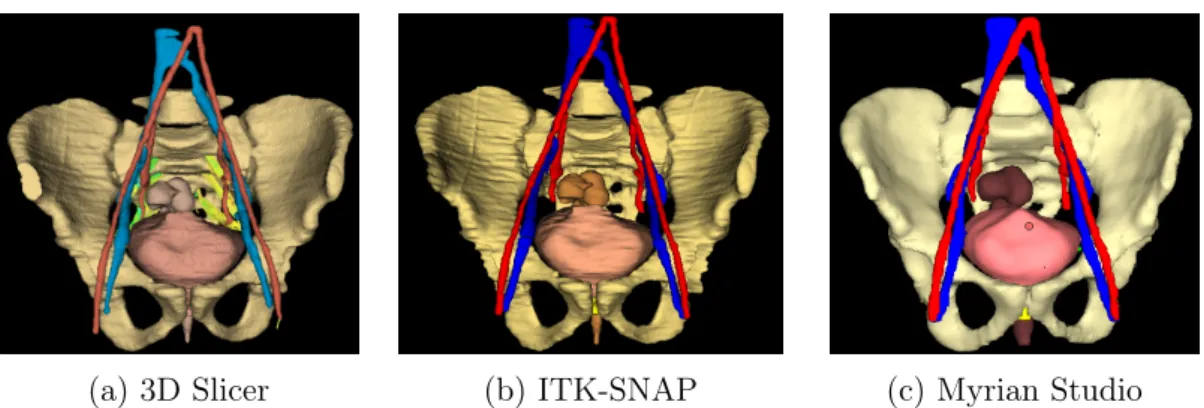
The medical imaging community was very active, in the last decades, on develop-ing and on freely distributdevelop-ing software platforms for image processdevelop-ing and visual-ization. In particular, generic segmentation tools, aiming the users to speed up the segmentation tasks were implemented in these platforms. For this reason, a comprehensive review of the these software tools, in order to evaluate their perfor-mances on pelvic MRI segmentation, is essential. In this chapter, twelve software tools, freely available on the Internet, were evaluated using T2-w volumic MRI and diffusion-weighted MRI images. The software tools were rated accordingly to eight criteria, evaluated by three different users: automatization degree, segmentation time, usability, 3D visualization, presence of image registration tools, tractography tools, supported OS, and potential extension (i.e. plugins). A ranking of software tools for 3D modeling of MRI medical images, according to the set of predefined criteria, is given. This ranking allowed us to elaborate guidelines for the choice of software tools for pelvic surgical planning in pediatric patients. The best-ranked software tools were Myrian Studio, ITK-SNAP and 3D Slicer, the latter being es-pecially appropriate if nerve fibers should be included in the 3D patient model. Finally, 3D Slicer was also chosen as core software platform for developing the organ-specific segmentation methods for pediatric patients (Chapters 5, 6 and 7).
Contents
4.1 Introduction . . . 29 4.2 Software tools evaluation . . . 29
4.2.1 Software tools selected for evaluation . . . 29 4.2.2 Imaging dataset . . . 32 4.2.3 Evaluation criteria . . . 33 4.3 Results . . . 35 4.4 Discussion . . . 39 4.5 Conclusion . . . 44
4.1
Introduction
Our aim in this chapter is to evaluate existing segmentation software tools for pediatric pelvic MRI segmentation. The evaluation is performed according to our requirements in terms of daily surgical use of 3D modeling of children with abdomino-pelvic tumors and malformations, e.g. with a limited number of image processing steps. We present here the selected software tools (Section 4.2.1), we propose a set of criteria (Section 4.2.3) for comparative analysis (Section 4.3), and we provide surgeons and researchers with guidelines for choosing software (Section 4.4).
4.2
Software tools evaluation
4.2.1
Software tools selected for evaluation
This survey focuses on the most generally used software tools in the medical im-age community, in particular by radiologists. We only include the software tools equipped with segmentation tools, 3D rendering tools and that are usable by a non expert in image processing. All the analyzed software tools are freely available on the Internet, except for two commercial software tools currently used at the Imag-ing Department of the pediatric Hospital Necker-Enfants Malades of Paris. All free software tools were tested on a Windows OS (CPU at 3.10 GHz, 16 GB RAM, 64 bit OS), except for the OsiriX DICOM Viewer that was tested on a Macintosh OS (CPU at 2.7 GHz, 16 GB RAM, 64 bit OS). The possibility of running the software tools on different operating systems, in particular Linux, was also analyzed. The selected software tools and the corresponding releases are listed in Table 4.1. 3D Slicer 3D Slicer [38] is a free, multi-platform and open source software for im-age analysis and visualization written in C++, Python and Qt1. The origin of this
software was a project between different laboratories of the Brigham and Women’s Hospital and the MIT in 1998. In the following years, several improvements of the software capabilities were achieved through the support of the National Institute of Health (NIH). The main interface of 3D Slicer appears as a typical radiology workstation, allowing for a large number of different visualization configurations to analyze 2D, 3D and four-dimensional (4D) images. The platform also offers a large set of processing tools for different imaging modalities and applications (including segmentation, registration, quantification).
Software Release Cost URL
3D Slicer 4.5.0-1 free http://www.slicer.org/
Anatomist 4.0.0 free http://brainvisa.info/web/anatomist.html
AW-Server 3.2 $ http://www3.gehealthcare.com/en/products/categories/advanced_visualization/platforms/aw_server
Freesurfer 5.3.0 free http://surfer.nmr.mgh.harvard.edu/
FSL 4.0.1 free http://www.fmrib.ox.ac.uk/fsl
ImageJ 1.50b free http://imagej.net/
ITK-SNAP 3.4.0-beta free http://www.itksnap.org
Mango 4.0.1 free http://ric.uthscsa.edu/mango/
MedInria 2.2.3 free http://med.inria.fr/
MIPAV 7.2.0 free http://mipav.cit.nih.gov/
Myrian Studio 2.2.1 free http://studio.myrian.fr/
Olea Sphere 3-0 $ http://www.olea-medical.com/en/olea-sphere-3-0/
OsiriX 5.8 free http://www.osirix-viewer.com/
Seg3D 2.2.1 free http://www.sci.utah.edu/software/seg3d.html
Table 4.1: Selected softwares. Commercial tools are indicated with a $ in the cost column.
Anatomist Anatomist [97] is the visualization software generally associated with the software platform BrainVISA[46]. BrainVISA is an open-source software writ-ten in Python, offering different tools dedicated to the neuroimaging research and mainly developed by the French Alternative Energies and Atomic Energy Com-mission (CEA). Although BrainVISA is devoted to brain MRI, Anatomist can be used to visualize and segment other types of image volumes.
AW-Server AW-Server is the commercial visualization software developed by GE Healthcare. The workstation, more than just allowing for the visualization and annotation of the images, offers a large number of advanced post-processing applications for different imaging modalities and clinical applications.
Freesurfer Freesurfer [40] is an open source software platform, written in C++, developed by the Martinos Center for Biomedical Imaging of Boston. The soft-ware is particularly devoted to the analysis and visualization of structural and functional neuroimaging data, offering several tools for the automated segmenta-tion of anatomical MRI images and the analysis of diffusion MRI data. Despite the strong focus on brain MRI, Freesurfer can be used to visualize and analyze through generic tools various types of multi-dimensional medical images.
FSL FSL (the FMRIB Software Library) [59] is an open source software library, written in C++, mainly developed by the FMRIB Analysis Group of the University of Oxford. The software is strongly devoted to the analysis of functional, structural and diffusion MRI brain imaging data. Similarly to Freesurfer, although FSL is strongly devoted to the brain MRI data, it offers a generic viewer (FSLView) that allows visualizing and manually segmenting 3D images.
ImageJ ImageJ [103] is a Java-based, open source platform for image processing, developed by the NIH and constantly updated since 1997. Thanks to the collabo-rative efforts of its developer community, ImageJ offers several functionalities for performing a wide variety of image processing tasks. However, even if ImageJ supports multidimensional data, it appears more focused on the processing of 2D images.
ITK-SNAP ITK-SNAP [138] is an open source software application based on ITK2 and VTK3 C++ libraries. It was developed by the University of
Pennsylva-nia and the University of Utah, first released in 2004 but under a constant updating process. The platform allows for navigation within the images similarly to a ra-diology workstation, and it was specifically developed for segmentation tasks, not focusing on other kinds of processing (e.g. filtering, registration).
Mango Mango (Multi-image Analysis GUI) is a free Java-based viewer for medi-cal images developed by the Research Imaging Institute of the University of Texas Health Science Center at San Antonio. The software includes a graphical user interface (GUI) for the visualization of 3D images as well as functionalities for different tasks such as registration, filtering and segmentation. It can be extended through dedicated plugins.
MedInria MedInria [114] is an open source platform for medical image process-ing developed by Inria, the French National Institute for computer science and applied mathematics. This platform manages the visualization of multidimen-sional data, and it includes processing and analysis of diffusion MRI images (e.g. to provide tractography). MedInria also offers basic segmentation, registration and filtering tools based on the ITK library.
MIPAV MIPAV [80], acronym for Medical Image Processing Analysis and Visu-alization, is a Java-based open source software supported by the NIH. It manages
2https://itk.org/ 3http://www.vtk.org/
multimodal and 3D images, even if its main interface appears better suited for the processing and visualization of 2D images. MIPAV offers several functionalities for different tasks such as filtering, registration and segmentation on both 2D and 3D images.
Myrian® Myrian® is a commercial software for medical image processing and
visualization developed by Intrasense. It supports multimodal images and offers different functionalities for tasks such as segmentation, quantification and registra-tion. A non-commercial version, Myrian® Studio, is freely available for research
purposes and can be extended through dedicated plugins.
Olea Sphere® Olea Sphere® is a commercial processing platform for CT and
MRI, developed by the company Olea Medical. The workstation includes a generic DICOM viewer and offers different packages developed for specific medical appli-cations (e.g. breast, head and neck, prostate).
OsiriX OsiriX [100] is one of the most widely used DICOM viewers in the med-ical community. The OsiriX project started in 2003 at UCLA, Los Angeles, and in 2010 the first commercial version of the software (OsiriX MD) was released. OsiriX Lite is the free version of the commercial software OsiriX MD, intended for research purposes and offering reduced computational performances, but it still in-cludes the functionalities needed in our application domain. The platform appears as a typical radiology workstation, supporting multimodal images and strongly devoted to the visualization tasks, even if it includes also post-processing tools such as registration and segmentation.
Seg3D Seg3D [22] is an open source software platform for image visualization and segmentation of 3D images developed by the NIH Center for Integrative Biomedical Computing at the University of Utah. The platform focuses on seg-mentation tasks, even if some other functionalities such as filtering using several methods from the ITK library are present.
4.2.2
Imaging dataset
Softwares were evaluated on imaging data issued from the complete patient’s co-hort except for the segmentation time criteria, which is highly dependent on the patients’ age and pathology. We have thus chosen two adolescent patients with a normal pelvis anatomy, one female and one male of the same age (to take into account gender variation) to evaluate this criterion. Segmentation was performed
the segmentation time results, images having both the same acquisition parame-ters were chosen for these two patients: echo time T E = 59 ms, repetition time T R = 5716 ms, flip angle F A = 90°, image size 512 × 512 × 208 voxels, and voxel size = 0.74 × 0.74 × 0.70 mm3.
Diffusion-weighted (DW) MRI scans, acquired immediately after the T2-w ac-quisitions were used to test the tractography algorithms, in order to minimize the potential patient’s displacement between the two scans. The DW MRI was ac-quired in the axial plan with a sequence of 25 directions, a b-value of 1000 and a voxel size of 1.4 × 1.4 × 4 mm3.
4.2.3
Evaluation criteria
In order to evaluate the performances of the software tools on the segmentation of the abdominal and pelvic structures in pediatric MRI, we established a list of eight criteria: automatization degree, usability, 3D visualization, segmentation time, image registration functionalities, tractography functionalities, supported system and potential addition of plugins. They are defined in this section.
Automatization degree This criterion was analyzed according to a score de-fined by the amount of manual interaction required by the user. Score 1 was assigned to a totally manual segmentation of the regions of interest, performed slice by slice; score 2 to the presence of generic semi-automatic tools for the seg-mentation of the 2D slices; score 3 to the presence of generic semi-automatic tools for the segmentation of a 3D region; score 4 to the presence of semi-automatic tools optimized for a specific anatomical structure. Note that thresholding-based segmentation tools were present in all the analyzed software tools. In this study, we did not consider them as segmentation tools due to the fact that they do not provide suitable results for any structure of interest in the abdomen and the pelvis, especially in MRI, where no equivalent of the CT Hounsfield units exists.
Segmentation time The time required for the segmentation of the pelvic struc-tures of interest in T2 MRI of two test patients (one male and one female) was evaluated for each analyzed software. The two images had the same features in terms of contrast, size, resolution, and the patients had the same age and the same anatomical complexity (see Section 4.2.2 for further details). Consequently, we can assume that the only factor that could generate a relevant difference on the total segmentation time is given by the different anatomy of the genital system. For this reason the total segmentation time was evaluated for the male patient (bones, bladder, vessels, rectum, prostate, seminal vesicles). For the female patient, only the uterus was segmented and the segmentation time was compared to the one