HAL Id: hal-00462464
https://hal.archives-ouvertes.fr/hal-00462464
Submitted on 24 Nov 2011
HAL is a multi-disciplinary open access
archive for the deposit and dissemination of
sci-entific research documents, whether they are
pub-lished or not. The documents may come from
teaching and research institutions in France or
abroad, or from public or private research centers.
L’archive ouverte pluridisciplinaire HAL, est
destinée au dépôt et à la diffusion de documents
scientifiques de niveau recherche, publiés ou non,
émanant des établissements d’enseignement et de
recherche français ou étrangers, des laboratoires
publics ou privés.
Slimming down a high-dimensional binary datatable:
relevant eigen-subspace and substantial content
Alain Lelu
To cite this version:
Alain Lelu. Slimming down a high-dimensional binary datatable: relevant eigen-subspace and
sub-stantial content. 19th International Conference on Computational Statistics - COMPSTAT 2010, Aug
2010, Paris, France. pp.1271-1278. �hal-00462464�
datatable: relevant eigen-subspace and
substantial content
Alain Lelu
Universit´e de Franche-Comt´e, LASELDI & LORIA
30 rue M´egevand, 25030 Besan¸con cedex, France, [email protected]
Abstract. Determining the number of relevant dimensions in the eigen-space of a data matrix is a central issue in many data-mining applications. We tackle here the sub-problem of finding the “right” dimensionality of a type of data matrices often encountered in the domains of text or usage mining: large, sparse, high-dimensional binary datatables. We present here the application of a randomization test to this problem. We validate our approach first on artificial datasets, then on a real docu-mentary data collection, i.e. 1900 documents described in a 3600 keywords datas-pace, where the actual, intrinsic dimension appears to be 28 times less than the number of keywords - an important information when preparing to cluster or dis-criminate such data. We also present preliminary results on the problem of clearing the datatable from non-essential information bits.
Keywords: randomization test, dimensionality reduction, data reconstitu-tion, power-law distribution
1
Introduction
Determining the number of relevant dimensions in the eigen-space of a data matrix is a central issue in many data-mining applications. We tackle here the sub-problem of finding the “right” dimensionality of a type of data matrices often encountered in the domains of text or usage mining, or in a number of biological applications, generally displaying “Zipfian” power-law distribu-tions (Newman (2005)): large, sparse, high-dimensional binary datatables, for which the assumptions underlying the state-of-the-art techniques such as the Catell’s scree-break heuristics (Cattell (1966)) or more recent model-based parametric tests (Bouveyron et al. (2009)) do not hold. Resampling tests, such as bootstrap (Efron (1981)) are akin to delineate the variability of a feature of interest, e.g. the positions of projected datapoints in a cho-sen factor plane (Lebart (2007)). Our problem is different, in that we try to determine which eigen-subspace of a binary data matrix bears the relevant information, and which extra eigen-dimension does not, due to the sole effect of noise, or distributions of the marginal sums. In this prospect, the general non-parametric solution we are interested in has to rest on comparing the
2 Lelu, A.
successive major eigenvalues of the original matrix to their counterpart in (at best) all the possible binary matrices endowed with the same row and column marginal sums (i.e. generalizing the exact test of Fisher (1936)), or, as it proves generally unfeasible, in a sample of these matrices (randomiza-tion test, Manly (1997)). Cadot (2005, 2006) has set up such a solution for any measure issued from a binary datatable, in her Tournebool randomiza-tion test, e.g. extracting significant graph edges between variables or between individuals (Lelu & Cadot (2010)).
In section 2 we will briefly recall the TourneBool process for generating randomized versions of the original datatable, and apply it to test its suc-cessive dominant eigenvalues against the null hypothesis - not being greater than expected from randomness. In section 3 we will describe how to generate artificial binary data endowed with two major characteristics of real-world bi-nary data: Zipfian distribution of the variables, and intermingled clusters. We will successfully apply our test to an instance of such datatables. In section 4 we will describe a set of real-life bibliographic data, and will test it, result-ing in 125 significant eigenvalues in this 1920 documents and 3600 keywords dataset, at the 99% significance threshold. In section 5 we will present an early empirical insight into the problem of the optimal binary reconstruction of a binary datatable, starting from its sole significant eigen-elements, which suggests a filtering process for “denoising”, “slimming down” such table, or strongly filtering the variables, while keeping the meaningful substance of the table unaltered.
2
Randomization process and test
The comparison with full-scale random simulations is now feasible, and is an alternative to the traditional comparisons with asymptotic theoretical statis-tic distributions. Noise may be added to the original datatable (bootstrap and Jacknife methods), or purely random tables may be generated, submit-ted to the same structural constraints as the original one. In this way, one may generate the random versions starting from the original database itself, by a sequence of elementary transformations keeping the row and column margins constant. This is the direction taken by the TourneBool method and test: a method for generating random versions of a binary datatable with prescribed margins, and the ensuing test for any measurement operated on the original matrix against the null hypothesis.
Generating the Randomized Matrices. Cadot (2005) presented a permutation algorithm based on rectangular flip-flops, incorporating a monitored conver-gence of the algorithm. Its theoretical legitimation can be found in Cadot (2006), based on the original notion of cascading flip-flops: the author has shown that any Boolean matrix can be converted into any other one with the same margins in a finite number of such cascades. These cascading flip-flops are themselves compositions of elementary rectangular exchanges, or
flip-flops. These flip-flops preserve the irreducible background structure of the datatable, but break up the meaningful links specific to a real-life data table. Getting rid of the background structure enables the method to process any type of binary data, both (1) taking into account the marginal distri-butions, (2) doing this without any need to specify the statistical models of these distributions. The number of rectangular flip-flops is controlled by two Hamming distance measures between matrices (i.e. number of cells with op-posite values): 1) between the current random matrix and the one generated at the previous step, 2) between the current random matrix and the original one. The initial number of flip-flops is increased as long as these distances are growing. The value of this parameter is deemed optimal when they stabilize - in practice, about several times the number of ones in the original matrix. No bias, i.e. residual remnant of the original matrix, can be attributed then to the randomization process.
Establishing the sequence of significant eigenvalues. A nested test is needed, the principles of which are the following:
• Generate a sufficient sample (X1, X2, ... Xp) of randomized versions of the original matrix X0 (e.g. 200 matrices).
• Extract the full sequence of singular values of X0, in decreasing order. • For each k-order eigen-space, starting from k = 1, compare the k − th
singular value of X0 to the set of corresponding k-th singular values in the sample: if the current singular value λk(0) is greater than or equal to
the randomized one located at the significance threshold (e.g. than the third one at the 99% threshold), it is deemed significantly diverging from randomness, and the algorithm goes on with k = k + 1.
When the algorithm stops, the value k is the dimension of the relevant eigenspace.
3
Validating on artificial data
Generating artificial datasets being a somehow unsubstantial and arbitrary task, we will focus on trying to reproduce two characteristics that stand out from our experience: 1) large-scale sparse datatables with binary fea-tures tend to exhibit a power-law distribution of their feature counts, as has been observed in many application domains, such as text mining ; 2) cluster structures are by no way all-or-none phenomena: they rather amount to pro-gressive, fuzzy memberships around dense data-cores. In other words, clusters are generally intricated, entangled, and by no way orthogonal.
Data generation: We will first build such intermingled clusters in the sim-plest case of two clusters, by generating a one-cluster table, e.g. appending
4 Lelu, A.
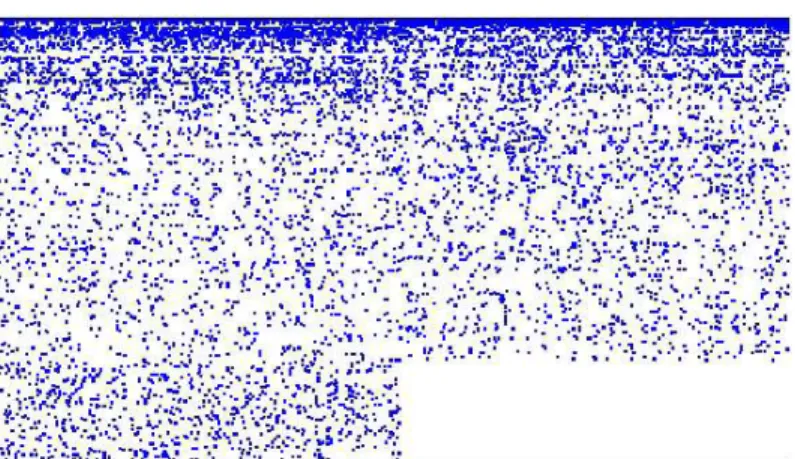
Fig. 1. A plot of the 2-cluster artificial data. Horizontally: the 1500 “documents” split into two clusters. Vertically: the 836 “keywords”.
Fig. 2. Characterizing the records in the 2-cluster artificial data. Vertically: the frequency count of each “keyword”. Horizontally: their ranks. The coordinates are log-log.
a full (750, 800) “ones” matrix and a full (750, 660) “zeros” one, then cre-ating another (750, 1460) matrix by randomly permuting the columns, and eventually stacking the two matrices into a (1500, 1466) one. The second step consists in “morphing” this matrix so as to fit into prescribed relative column and row sum profiles (e.g. a power-law distribution for the column sums, and a binomial one for the row sums): the process of alterning a global stretching or expanding for each column vector so as to fit to the corresponding pre-scribed sum profile, with the same for the row vectors, lets the transformed datatable converge to a real positive matrix embedding a (distorted) memory of the initial structure.
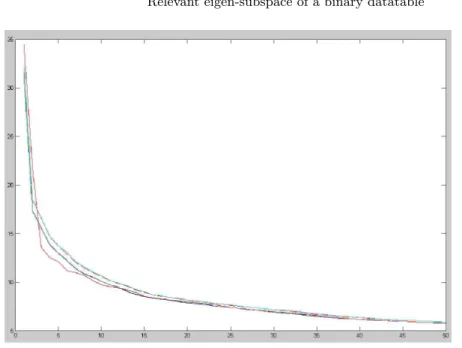
Fig. 3.Scree-plot of the singular values for the 2-cluster artificial data (in red). The dashed lines delimit the confidence interval, the solid lines delimit the minimum to maximum variation interval.
The last step consists in turning this table binary, first by normalizing it (i.e. dividing by its maximum value), then by considering each value as a probability for drawing a value “one”; the resulting (1500, 1460) table comprises many empty columns, or columns summing to 1 or 2; in a final cleansing process, we remove these columns for the sake of preventing side effects, and we now yield a (1500, 836) binary matrix X0 (see figure 1) with
a visually convincing power-law distribution of the column sums (see figure 2).
Eigenspace test: Figure 3 shows the “scree-plot” of the 50 first eigenvalues of X0, compared to the plot of the 99% confidence interval of its 200
random-ized clones. As jumps out from the figure, the only two first singular values dominate their confidence intervals, emphasizing the 2-cluster intertwined structure.
4
Relevant eigen-subspace of a real-world binary
datatable
Origin and characteristics of the data: An excerpt of the Pascal bibliographic database, edited by CNRS/INIST, and spanning one year of research activity in the french Lorraine region, has been set up for diverse methodological
6 Lelu, A.
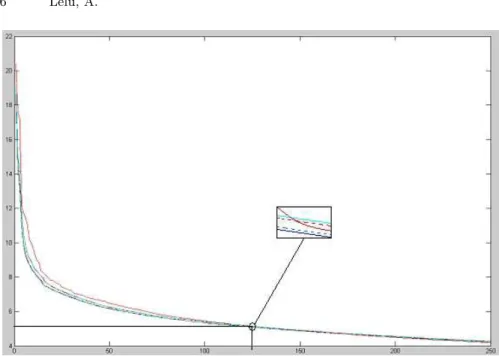
Fig. 4.Scree-plot of the singular values for the Lorraine data (in red). The dashed lines delimit the 99% confidence interval, the solid lines delimit the minimum to maximum observed variation interval.
evaluation tasks (Ghribi et al. (2010)), and will soon be publicly available1
. We have chosen these data as a “not too large, but sufficient” sample of the very common documentary or text type of data. It consists of 1920 records manually indexed with 3557 keywords of frequency greater than one, resulting in a mean value of 5.6 keywords per document. As could be expected, the keywords’ occurrences follow a typical power-law distribution.
Intrinsic dimension of the datatable: Having generated 200 randomized ver-sions of the original matrix with the Tournebool algorithm, we have applied the above-described test for assessing the 250 first singular values. As can be noticed in the scree-plot of Figure 4, it appears that, at the 99% threshold, the 125 first singular values significantly depart from the confidence interval due to randomness - thus establishing to 125 the dimension of the significant eigen-subspace, and suggesting further operations in this reduced dataspace without any loss of relevant information: e.g. similarity measures, as those implied in Latent Semantic Analysis (Deerwester et al. (1990)), or cluster axo¨ıds seeking2
(Lelu(1994)), As a subsidiary observation, one may also
no-1 We are indebted to INIST and Pascal Cuxac for having put these data at our
disposal.
2 In this case, as no cluster axo¨ıds can be colinear to another one by definition,
the number of clusters cannot be lesser than the intrinsic dimension of the data matrix.
tice in figure 4 that the visual “scree-break” criterion of Cattell (1966) seems inoperative in such high-dimensional data, though effective in the case of our artificial example in section 3.
On the computational side, the two most time-demanding phases, i.e. the creation of the randomized matrices and the extraction of a significant proportion of their singular values (250 chosen here), are not far from pro-portional to their number and to the number of ones in each one. This is no problem for our 200 matrices filled with 10,700 ones, as the total running time of these modules has not exceeded ten minutes on a 2.7 GHz CPU, 4 Gb RAM, desktop computer.
5
Substantial content of a binary datatable: an
empirical approach
The SVD reconstitution of the data writes: X0= U DV′
where U and V are the matrices gathering respectively the row and column singular vectors, and D is the diagonal matrix of the singular values.
The rank-k reconstitution of the data writes: X0k = UkDkVk′
We have computed the X125
0 reconstitution of the data in the relevant eigenspace.
The distribution of the values in the cells is very assymetric, with more than 3 million values in the ]0; .1] interval, 2600 values in the ]0.9; 1] interval, and a clear minimum in the ].5; .9] range; hence, the empirical idea of threshold-ing these values for reconstructthreshold-ing a binary matrix. And for each value of the threshold, a coefficient of fit between the real data and the reconstructed ones can be computed. We have chosen the well-known f-score coefficient, i.e. the harmonic mean between the precision and recall of the reconstitution: the maximum value 0.803 corresponds to the .3 threshold. The resulting binary table has lost 10, 754 − 10, 138 = 616 one values, compared to the original matrix. We may conclude that these 616 values are pure noise and might be discarded from any further analysis. The same thresholding process might be applied for discarding more and more values, depending on the desired sharpness of this analysis. A progressive filtering of the binary features may also ensue.
6
Conclusions, perspectives
The use of the Tournebool randomization test appears to offer a satisfactory, if not rigorous, solution for establishing the intrinsic dimension of a large,
8 Lelu, A.
sparse, binary matrix, useful e.g. for fixing the relevant number of compo-nents in a Latent Semantic Analysis, or a lower bound to the “real” number of clusters to be pulled out. More has to be worked out on the subject of reconstructing the “core bits” of the data matrix, on which subject we hope to have brought a first contribution.
References
BAVAUD, F. (1998): Mod`eles et donn´ees : une introduction `a la Statistique uni-, bi- et trivari´ee. L’Harmattan.
BOUVEYRON C., CELEUX G. and GIRARD S. (2009): Intrinsic Dimension Es-timation by Maximum Likelihood in Probabilistic PCA. In: PREPRINT -
De-cember 10, 2009 1 (HAL 00440372)
CADOT, M. (2005): A Simulation Technique for Extracting Robust Association Rules. CSDA 2005.
CADOT, M. (2006): Extraire et valider les relations complexes en sciences
hu-maines : statistiques, motifs et r`egles d’association. Ph.D. thesis, Universit´e de
Franche-Comt´e.
CATTELL, R. B. (1966). ”The Scree Test for the Number of Factors.” Multivariate
Behavioral Research 1(2), 245-276.
DEERWESTER S., DUMAIS S., FURNAS G. W., LANDAUER T. K., HARSH-MAN R. (1990): Indexing by Latent Semantic Analysis. In: Journal of the
American Society for Information Science 41 (6) 391-407.
EFRON, B. (1981): Nonparametric estimates of standard error: The jackknife, the bootstrap and other methods. Biometrika 68, 589-599.
FISHER, R. (1936): The Use of Multiple Measurements in Taxonomic Problems.
Annals of Eugenics, 179-188.
JENSEN, D. and COHEN, P. (2000): Multiple Comparisons in Induction Algo-rithms. Machine Learning, 309-338.
LEBART, L. (2007): Which bootstrap for principal axes methods ? In: P. Brito et al. (eds): Selected Contributions in Data Analysis and Classification., Springer, 581-588.
LELU, A. (1994): Clusters and factors: neural algorithms for a novel representation of huge and highly multidimensional data sets. In: DIDAY E., LECHEVAL-LIER Y. & al. (eds): New Approaches in Classification and Data Analysis,
241-248 Springer-Verlag , Berlin.
LELU A., CADOT M. (2010): Statistically valid links and anti-links between words and between documents: applying TourneBool randomization test to a Reuters collection. In: Ritschard G. & Studer M. (eds). Advances in Knowledge
Dis-covery and Management (AKDM), 327-344 Springer-Verlag , Berlin, in press.
MANLY, B. (1997): Randomization, Bootstrap and Monte Carlo methods in
Biol-ogy. Chapman and Hall & CRC.
NEWMAN, M. (2005): Power laws, Pareto distributions and Zipf’s law.
Contem-porary Physics, 323-351.
PRESS, J. (2004): The role of Bayesian and frequentist multivariate modeling in statistical Data Mining. Statistical Data Mining and Knowledge Discovery,