HAL Id: halshs-01075444
https://halshs.archives-ouvertes.fr/halshs-01075444
Submitted on 1 Apr 2016
HAL is a multi-disciplinary open access
archive for the deposit and dissemination of
sci-entific research documents, whether they are
pub-lished or not. The documents may come from
teaching and research institutions in France or
abroad, or from public or private research centers.
L’archive ouverte pluridisciplinaire HAL, est
destinée au dépôt et à la diffusion de documents
scientifiques de niveau recherche, publiés ou non,
émanant des établissements d’enseignement et de
recherche français ou étrangers, des laboratoires
publics ou privés.
Interactions in Cultural Fields
Antoine Courtin, Brigitte Juanals, Jean-Luc Minel, Mathilde de Saint Léger
To cite this version:
Antoine Courtin, Brigitte Juanals, Jean-Luc Minel, Mathilde de Saint Léger. The “MuseumWeek”
Event : Analyzing Social Network Interactions in Cultural Fields. The 10th International Conference
on Signal Image Technology & Internet based Systems Workshop on Visions on Internet of Cultural
Things and Applications, Nov 2014, Marrakech, Morocco. IEEE Computer Society, pp.462-468, 2014,
Proceedings of the 10th International Conference on Signal Image Technology & Internet Systems
(SITIS). Workshop Victa. �halshs-01075444�
The “MuseumWeek” Event : Analyzing Social
Network Interactions in Cultural Fields
Antoine Courtin
∗, Brigitte Juanals
†, Jean-Luc Minel
†, Mathilde de Saint Léger
†∗
Labex Les Passés dans le présent
Nanterre, France
[email protected]
†
MoDyCo, University Paris Ouest Nanterre La Défense
[email protected]
Abstract—The goal of this paper is to analyze messages sent on the Twitter socialnetwork during the MuseumWeek event. This analysis relies on quantitative and qualitative studies, which were benchmarked with the “MuseumWeek” event.
Keywords: Cultural mediation, Twitter, Machine Learning Categorization
I. THECIRCULATION OFCULTURALCONTENT ONSOCIAL
NETWORKS:ANINDUSTRIAL ANDCULTURALISSUE FOR
MUSEUMS
In order to apprehend the entanglement between communi-cation industries and museums on social networks, we set up a two-year interdisciplinary study[1] which combines fieldwork and interviews of community managers in charge of communi-cation in several French social network museums. The corpora harvested in these fields were analyzed with textual and statis-tical analysis tools. In the international context of multimedia convergence, stakeholders coming from the Internet market, computing and communications industry have penetrated the cultural sector of museums, relying on their platforms of goods and services. This new configuration gives rise to the renego-tiation of the control of information dissemination channels between the two categories of stakeholders, namely cultural organizations and industrial companies [2]. In this respect, museums are in the same position as cultural industries. An increasing number of museums have generalized the use of social networks, among other digital media and electronic artefacts [3]. Two American companies, Facebook and Twitter, have captured the lion’s share of this competitive international market. Their business model is based on the attendance and the participation of audiences and organizations.
Social networks[4] have now become editorial spaces for cultural organizations but they are difficult to comprehend because they are both places to attract audiences and places to produce and share cultural content [2].
The overall goal of this paper is to analyze messages sent on the Twitter socialnetwork during the European communication event “MuseumWeek”, which was launched in March 2014 by the American company Twitter in the museum field, as this operation can be considered emblematic of development strategies of Internet companies in the cultural field[2]. After
briefly presenting the scope of the international event, we will focus on the French coverage of this event.
The outline of the paper is the following. First in Section 2, we briefly describe related work. In section 3, we remind principles of our tool-based methodology. In Section 4, we present the “MuseumWeek” event directives. In section 5, results from quantitative and qualitative analyses are discussed. Finally, we conclude in Section 6.
II. BACKGROUND ANDRELATED WORK
Analysis of tweets has led to a great deal of research [5], on topics such as election forecasts [6], the stock market [7], dramatic events [8], and especially sentiment analysis [9], [10], [11], [12], but we are not aware of research in the cultural field combining analyses of messages from professionals such as community managers and the general public. Many studies using machine-learning approach have been published [11], [13], [14], [15], [16], but the majority of them focus on the polarity of messages whereas we needed to categorize the content of a message more precisely.
III. METHODOLOGY
First, we would like to summarize our tool-based methodology [17] to analyze social network interaction. In the first step, based on a Tuser taxonomy built by experts in the studied field, all the tweet accounts are categorized. As the size of the dataset precluded human analysis, we propose to used NLP tools (regular expressions and more sophisticated scripts if necessary) to automatically categorize accounts.
In the second step, a quantitative analysis of the attendance stream is carried out in order to compute temporal trends and user practices.
In the third step, we propose to categorize the content of tweets. First of all, it is necessary to build another taxonomy Tcontent, based on linguistic analysis and on lexicometric tools (lexical frequency or tf*idf score). Here again, as the size of the dataset precluded human analysis, we propose to use machine learning tools, especially multi-label classification. The last step is the classical step of interpreting findings given
the assumptions and theoretical framework of the study. For this step, in order to facilitate the understanding of study results in cultural field, we developed heuristic visualizations tools based on JavaScript libraries (d3js, sigmajs, etc.).
IV. THECASE OF THE“MUSEUMWEEK” COMMUNICATIONEVENT
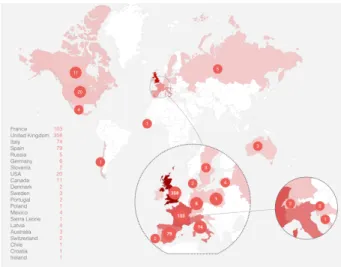
Figure 1. International locations
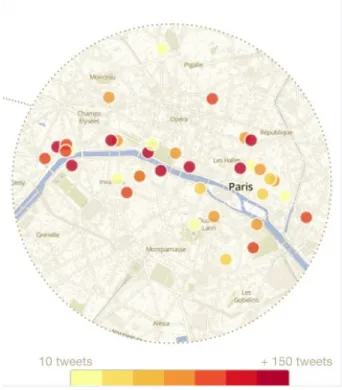
Figure 2. French geographical locations
During 2013, several museums supported by the French Ministry of Culture engaged in dialogue with Twitter in order obtain a certified account1 or the creation of a new category
to improve their visibility on this media. In February 2014, Twitter invited a group of twelve French museums (hereinafter referred to as GM 12) to a meeting in Paris to propose the framework of the “MuseumWeek” communication event. Twitter likewise organized a meeting with seventy museums in the United Kingdom for the same purpose as well as in 1For more on certified accounts on Twitter :
https://support.twitter.com/articles/269158-faq-sur-les-comptes-certifies.
other countries. Figure 1 shows participating countries at the event and figure 2 focuses on French institutions.
At the end of February, an International event, called “MuseumWeek” (with the generic hashtag #MuseumWeek) was designed and planned to take place during one week (from the 24th to 30th March 2014). The organizational principle of this event was simple: each day was dedicated to a theme, with a specific hashtag but this specific hasthag was different in each country. All users were encouraged to use the hashtag of the day as well as the generic one in their tweets. Despite the fact that this instruction was disadvantageous to communicate within the format of 140 characters per message, 69% of French users kept to this obligation. Figure 3 shows day-themes and their associated French hashtags and figure 4 and 5 illustrates differences between French and British flows of tweets.
Figure 3. Themes and French hashtags of the MuseumWeek event
Figure 4. French Hashtags attendances
V. ANALYSIS OFINTERACTIONS
31 592 French tweets were automatically harvested by using the API provided by Twitter (twitter.com/search-advanced). Each record contains the identification of the sender, the text of the tweet and the day-of-issue. By analyzing the profile of
Figure 5. English hashtags attendances in UK
Figure 6. Categories of senders
the tweet account with a combination of Natural Language Processing techniques (regular expressions and Python scripts if need be) and institutional knowledge, senders were cate-gorized as shown in figure 6. Two kinds of analysis were conducted on this corpus: a quantitative one, which focused on the attendance, and a qualitative one, which focused on the content of tweets.
A. Quantitative Analysis on attendance Global analysis
Quantitative analysis provides several important results. First, the quartile distribution (figure 7), second the attendance curve (figure 8) which declines regularly (36%) from the beginning, with two rebounds, one on the theme “Sharing our coup de coeur”, which is also the peak of attendance, and the other on the architecture of museum buildings. It should be noted that these themes are those which concern the individual accounts most. This fact is confirmed by the categorized curve (figures 8) which shows a flat curve for the CI and PM accounts and a two-peak curve for PIC and CdP
accounts. These results are in line with several analyses of the commitment of users on social networks [18].
Figure 7. Quartile distribution of two populations of users, CI and OA
Figure 8. Attendance and categorized curves
The second result concerns the distribution of the number of tweets sent by users. Figure 9 shows a marked difference in the practices of CI and OA accounts. CI accounts (103) sent 6188 tweets and OA (7746) sent 25404 tweets. Most importantly, the kind of tweets are very different. CI accounts are what we call “authors”, that is to say they wrote their tweets, while OA accounts are what we call “relay runners”, which means that they retweeted an original tweet. It must be pointed out that “Re-tweet” is a functionality of the Twitter interface software. The third finding concerns the number of tweets sent by account. 64 % of OA accounts sent one tweet, while the same proportion of CI accounts sent 55 tweets.
In order to analyze more thoroughly the behavior of each account, we computed three indicators as follows (where NTW is the number of original tweets sent by a user; NRT is the number of retweets sent by a user; NTWINIT is the total number of original tweets; NTRT is the total number of original retweets).
IPG = (NTW+NRT) / (NTWINIT+NTRT), Indicator of
global participation;
IPL = NTW / NTWINIT, Indicator of “author”;
IPR = NRT / NTRT, Indicator of “relay runner”. The ranking of all the accounts for the IPG indicator shows that the first three are OA accounts, followed by almost all the CI accounts. The first ten IPL are CI accounts, and among the first ten IPR, seven are OA and three are PM. In a nutshell, while the participation of individual users in the event was high, their commitment was relatively weak. As figure 4 shows, the OA population is complex but specific categories help to identify trends. Hence, figure 10 shows two major categories: loyalty towards the event (those who tweeted with whole hashtags) but also the twenty most active senders. Although often decried [19], one can note the presence of two robots (1590 tweets, 100% of retweets, 1617 followers) which played an intermediary role between the various countries involved in the event.
Figure 9. Distribution of number of tweets sent
Figure 10. Zoom on characteristics of OA accounts
Specific analysis of museums’ participation
Among the 103 institutional accounts, twelve museums, called GM12 here (see section 3), were the co-founding members of the “MuseumWeek” event. Consequently, we decided to study their communicational practices during this event more thoroughly. We ranked the members of GM12 with three indicators, IPG, IPL and IPR (figure 11 and 12). As regards the IPG and IPL indicators, the RIPG (ranking of all IPG) ranking shows three partitions: a top partition composed of 8 members of the GM12 characterized by strong participation; a small partition of two members located at the end of the first quartile; and a third partition, also composed of two members, located at the bottom of the ranking. As it was difficult to explain this result by intrinsic characteristics of the museums themselves (historical, fine arts, modern art, etc.), we hypothesized that the profile of the community manager (CM) could be an explanation, and the interviews with CMs
confirmed this hypothesis. As regards the IPR indicator, the RIPR ranking (ranking of all IPR) shows no real pattern and no correlation with the previous RIPG ranking. Four members of GM12 are at the top of the RIPR ranking, but the Centre Pompidou which is a leader in RIPG is no longer present. The “Grand Palais” museum which is at the bottom of the RIPG ranking is in the first third of the RIPR ranking.
Figure 11. Boxplot of initial tweets and retweets sent by institutional organizations
Two conceptions of the communication policy conducted by museums emerge. On the one hand, a selective policy of control of the contents of the tweets sent by the museum, which is reluctant to relay content of which it is not the author. And, on the other hand, a policy of display or more exactly of presence, whatever the kind of messages sent. This division reflects different conceptions of authorship.
Figure 12. Practices of GM12 members
B. Content analysis of tweets
The goal of this analysis is to go beyond the quantification of the stream of tweets (see section V.A) and to analyze their contents. As the size of the dataset precluded human analysis,
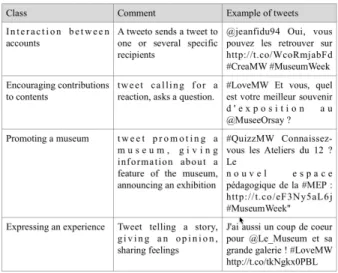
a machine learning approach was chosen. A linguistic analysis [20] carried out on 553 tweets of the initial corpus provided a set of classes (cf. figure 13), a set of features and a training test for the classifier.
Finally, the 30 features used for classification are linguistic (mainly lexis), semiotic (smileys), positional and tweet-specific (interaction between accounts). For example, clitic pronouns (vous, nous, je, moi, etc.) are used to identify "expressing an experience", as well as lexical markers such as (aimer, beau, plaisir, trésor, amour, etc). Some specific data were also used: first, metadata about accounts such as CI or OA; second, specific marks [13] such as URL links, the modified tweet (MT) mark and the number of hashtags in the tweet. Note however that the annotation assigned to the tweet by the classifier is the result of a probability calculation. The classifier [20] combines Naive Bayes and Vector Support Machine algorithms and performs a multi-label classification [21]. This kind of classification was necessary because the linguistic analysis showed that a tweet could belong to two classes. For example a tweet such as "@ioster #QuestionMW On va étudier la question ! En attendant n’hésitez pas à profiter des magnifiques collections : @PBALille @MHNLille..." could be classified as both "Interaction between accounts" and "Promoting a museum". These two algorithms, Naive Bayes and Vector Support Machine, were applied on the corpus and their results were then compared. If the same class was assigned by both, it was kept, otherwise none of the classes were assigned. Figure 14 shows that this phenomenon occured very rarely.Several bench-marks showed that this method gives the best F0.5 measure, which puts more emphasis on precision than recall [22].
Our classifier gave an F0.5 measure which varied between 0.67 and 0.53, depending on the partition of the corpus being analyzed. These scores are slightly lower than those of the state of the art (approximately 0.70) but it should be pointed out that our set of classes is larger. The Kappa indicator, with three jurors, was between 0.76 and 0.41, depending on the classes compared, which can be considered rather good. Note that several classes can be assigned to the same tweet (they are not mutually exclusive), but rarely more than two, which explains why the sum of percentages may be greater than 100%.
Figure 14 shows the results obtained on the corpus without retweets (9 511 tweets). The largest class (41%) is “Interaction between accounts”. This result shows that the social network Twitter was largely used by the users as a way to interact with professionals and with each other, which was one of the goals of the founders of the “MuseumWeek” event.The score of the second class “Promoting a museum” (39%), very close to the first one, confirms the marketing trend evolution of some museums. By contrast, the cultural mediation objective, which is partially measured by the class “Encouraging contributions to contents” (17%) was poorly represented.
In order to analyze the communication practices of the community managers, the classifier was applied on three specific partitions of the corpus (figure 14): one composed
Figure 13. Set of annotations for automatic classification.
Figure 14. Percentage of classes in several corpora.
of tweets sent by the Musée du Quai Branly, the second by the Centre Pompidou and the third by the Cité des Sciences. These three museums were chosen because they are the top three leaders (see section V.A and figure 15) of the event. The contrast with the global corpus is striking. First of all, none of three community managers of these museums sent a tweet to promote his/her museum. Second, a mean of 62% (from 59% to 64%) of their tweets aimed at “Expressing an experience”. Third, there was a slight difference (from 23% to 32%) in communication practices between them concerning the “Interaction between accounts”, but far behind the score for the whole corpus (41%). Finally, three community managers sent few tweets, in line with all users, for “Encouraging contributions to contents”, which showed that they privileged exchanges and community animation rather than cultural me-diation.
VI. CONCLUSION
This paper has presented a framework for the analysis of a social network event in the cultural heritage field illustrated with an experiment on the “MuseumWeek“ event co-organized by Twitter and a group of museums supported by the French Ministry of Culture. A multi-label classifier was built in order
Figure 15. Zoom on participation from leader Institutions
to partially analyze the content of a large corpus of tweets. It is interesting to compare our results with different opinions expressed during a debriefing meeting organized by the French Ministry of Culture and Twitter in May 2014 which was attended by around 60 community managers who participated in the “MuseumWeek” event. Both representatives from the French Ministry and Twitter expressed their satisfaction with the successful performance and announced a second edition for 2015 with some adjustments, whereas community managers were more cautious.
REFERENCES
[1] B. Juanals and J.-L. Minel, “The evolution of forms of cultural mediation in the digital age in museums, between tradition and change,” in Seven International Conference on the Inclusive Museum. Los Angeles, USA: Ihe Inclusive Museum, 2014.
[2] B. Juanals, “Museums as Reterritorialization Spaces in the Digital Age: between Knowledge Publishing and Institutional Communication,” Journal of Inclusive Museum, p. 8, Accepted 2014.
[3] L. Johnson and al., The NMC Horizon Report: 2012, 2013, Museum Edition. Austin, Texas: The New Media Consortium, 2012. [4] N. Ellison and D. Boyd, The Oxford Handbook of Internet Studies,
W. Dutton, Ed. Oxford University Press, 2007.
[5] M. Zimmer and J. Proferes, “A topology of Twitter research: disciplines, methods, and ethics,” Journal of the American Society for Information Science and Technology, vol. 66-3, pp. 250–261, 2014.
[6] A. Tumasjan, O. Sprenger, r. P. Sandne, and M. Welpe, “Election Fore-casts with Twitter: How 140 Characters Reflect the Political Landscape,” Social Science Computer Review, vol. 29-4, pp. 402–418, 2011. [7] J. Bollen, H. Mao, and X. Zeng, “Election Forecasts with Twitter: How
140 Characters Reflect the Political Landscape,” Journal of Computa-tional Science, vol. 2-1, pp. 1–8, 2011.
[8] T. Sakaki, M. Okazaki, and Y. Matsuo, “Earthquake Shakes Twitter Users : Real-time Event Detection by Social Sensors,” in 19th Inter-national Conference on World Wide Web, 2010, pp. 851–860. [9] B. O’Connory, R. Balasubramanyan, B. Routledge, and A. Smithy,
“From Tweets to Polls : Linking Text Sentiment to Puvlic Opinion Time Series,” in 48th International AAI Conference on Weblogs and Social Media, 2010.
[10] T. Welfare, V. Lampos, and N. Cristiani, “Effects of the Recession on Public Mood in the UK,” in 21st International Conference Companion on World Wide Web, 2012, pp. 1221–1226.
[11] M. Thelwall, K. Buckley, C. D. Paltoglou, and A. Kappas, “Sentiment Strength Detection for the Social Web,” Journal of the American Society for Information Science and Technology, vol. 63-1, pp. 163–176, 2010. [12] F. Colace, M. De Santo, and L. Greco, “A Probabilistic Approach to Tweets’ Sentiment Classification,” in ACII 2013. Barcelona, Spain: Springer Verlag, 2013, pp. 37–42.
[13] B. Pang, L. Lee, and V. S., “Thumbs up? Sentiment Classification Using machine Learning Techniques,” in ACL-02 Conference on Empirical Methods in Natural language Processing, 2002, pp. 79–86.
[14] A. Pak and P. Paroubek, “Twitter as a corpus for sentiment analysis and opinion mining,” in LREC 2010, 2010, pp. 1320–1326.
[15] A. Agarwal, B. Xie, I. Vovsha, O. Rambow, and R. Passonneau, “Sentiment analysis of twitter data,” in ACL, Workshop on Language in Social Media, 2011, pp. 30–38.
[16] E. Kouloumpis, T. Wilson, and J. Moore, “Twitter sentiment analysis: The good the bad and the OMG!” in fifth international conference on weblogs and social media, 2011.
[17] A. Courtin, B. Juanals, J.-L. Minel, and M. deSaint Léger, “A Tool-based Methodology to Analyze Social Network Interactions in Cultural Fields: the Use Case “MuseumWeek,” in The 6th International Conference on Social Informatics. DYAD Workshop. Barcelona, Spain: Springer Verlag, 2014.
[18] B. Gonçalves, N. Perra, and A. Vespignani, “Modeling users’ activity on Twitter networks : validation of Dunbar’s number,” PLOS One, vol. 6-8, 2011.
[19] E. Ferrara, O. Varol, C. Davis, F. Menczer, and A. Flammini, “The Rise of social Bots,” arXiv, Tech. Rep. 1407.5225, 2014.
[20] O. Seminck, “Prototype d’un Classifieur de Tweets à Buts Communi-catifs,” University Paris Ouest Nanterre La Défense, Tech. Rep., 2014. [21] A. McCallum, “Multi-label text classification with a mixture model
trained by EM,” in AAAI’ 99 Workshop on Text Learning, 1999. [22] J. Makhoul, R. Scwartz, and R. Weischdel, “Performance Measures for
Information Extraction,” in DARPA Broadcast News Workshop, 1999, pp. 249–252.