HAL Id: pastel-01057801
https://pastel.archives-ouvertes.fr/pastel-01057801
Submitted on 25 Aug 2014
HAL is a multi-disciplinary open access archive for the deposit and dissemination of sci-entific research documents, whether they are pub-lished or not. The documents may come from teaching and research institutions in France or abroad, or from public or private research centers.
L’archive ouverte pluridisciplinaire HAL, est destinée au dépôt et à la diffusion de documents scientifiques de niveau recherche, publiés ou non, émanant des établissements d’enseignement et de recherche français ou étrangers, des laboratoires publics ou privés.
Components of transpiration efficiency in poplars :
genetic diversity, stability with age and scaling from leaf
to whole plant level
Fahad Rasheed
To cite this version:
Fahad Rasheed. Components of transpiration efficiency in poplars : genetic diversity, stability with age and scaling from leaf to whole plant level. Silviculture, forestry. AgroParisTech, 2012. English. �NNT : 2012AGPT0055�. �pastel-01057801�
AgroParisTech
UMR INRA 1137 (EEF) Forest Ecology & Ecophysiology F- 54280 Champenoux
Presented and defended in public by
Fahad RASHEED
28 August 2012
Components of transpiration efficiency in poplars:
genetic diversity, stability with age and scaling from
leaf to whole plant level
Doctorat ParisTech
T H E S E
Presented to get the doctorate degree in
L’Institut des Sciences et Industries
du Vivant et de l’Environnement
(AgroParisTech)
Spécialité: Biologie Végétale et Forestière
Thesis Director
Dr. Erwin DREYER, Research director, INRA of Nancy
Dr. Didier LE THIEC, Research fellow, INRA of Nancy
Dr. Franck BRIGNOLAS, Professor, University of Orleans
Jury members:
Dr. Rolf SIEGWOLF, Research director, Paul Scherrer Institut, Swiss. Reporter
Dr. Reinhart CEULEMANS, Professor, University of Antwerp, Belgium. Reporter
Dr. Erwin DREYER, Research director, INRA of Nancy, France. Member
Dr. Franck BRIGNOLAS, Professor, University of Orleans, France. Member
Dr. Yves JOLIVET, Professor, University of Lorraine, France. Member
Acknowledgements
I would like to present my high, respectful gratitude to my Supervisor Dr. Erwin DREYER for his guidance, supervision and help throughout my thesis. The time when I joined this laboratory I know nothing about the stable isotopes and never knew even about their existence. Under his guidance, I put my first steps in this field of research completely new for me. I can remember my first day when walked into this lab and had a meeting with Erwin, he tried to explain some basic principals concerning the stable isotopes and I was sitting and saying “yes” every now and then like I knew those things. I can remember the moments that I passed in his office, He use to say “you are doing an excellent job” but “we need to modify it altogether” and “I need the values up to three significant figures”. Nevertheless, his knowledge in this field allowed me to learn a lot that I would never forget.
I would present my heartiest regards and respect to Dr. Didier LE THIEC, being there for me when ever I needed. I can safely say that he was the MR CONSTANT through out my thesis. He was there helping me during the experiments, organizing the protocol for gas exchange measurements and for wood and leaf anatomy measurements. We shared diverse moment together. We also had some interesting discussion where he used to say “Non, non, non je suis pas d’accord” and some time “mais fahad ……..!”. His help, his concern and his presence was vital and I am sincerely thankful to him.
I am thankful to Beatrice RICHARD for helping me in the extraction of cellulose and leaf soluble sugars. I am thankful to Pierre MONTPIED for helping me in statistics. We shared some enthusiastic discussions on bird and a famous hiking trip during which I sweated like never before. Thanks to the dependable Claude and Christian for isotope analysis. They passed some long series of samples and provided the results in time. Special thanks to Franck BRIGNOLAS, Eric Paillassa & Cécile VINCENT-BARBAROUX for their contribution in providing plant materials and especially organizing the age effect experiments.
Can not forget Pascal COURTOIS (Pascaldo) with whom I shared the office for four years. What an office it was “jam-packed”. He use to say “tout est utile”. We smoked and joked together during this time. Two thing which we shared together I would never forget “his protocols” and post lab trip to Besançon for Kebab “450km just to eat Kebab!” Big thanks to Cyril BURE for organising the field visits for the last experiment during which we spent a quality time together (dangerous but quality time!). Thanks to Frank RADNAI for providing physical support during my experiments and Bernard CLERC for reserving vehicles for field visits. At the end I would like to thanks my parents and my sister for their support and prayers without which I would not had completed this big task. They always encouraged me especially at the beginning where I found myself as complete stranger in France. They were there till the end and whenever I needed them the most! Last but not the least I am thankful to my supportive wife Claire for staying by my side in all situations.
TABLE OF CONTENTS
1. INTRODUCTION ... 5
1.1. Genus Populus: ... 5
1.2. Poplar hybrids ... 9
1.3. Poplar cultivation ... 11
1.4. Problematic and thesis objectives ... 13
2. STATE OF THE ART ... 19
2.1. Water use efficiency at different integration scales ... 19
2.1.1 At leaf level: ... 19
2.1.2 At whole plant level: ... 21
2.2. 13C discrimination as an estimator of intrinsic transpiration efficiency ... 23
2.3. Other sources of variation in 13C signals: isotopic signature of different organic compounds ... 27
2.4. Use of oxygen isotopes as estimator of stomatal conductance ... 31
2.5. 18O enrichment in the leaf ... 31
2.5.1. 18O enrichment of leaf water at the sites of evaporation ... 33
2.5.2. 18O enrichment of leaf organic matter ... 37
2.6. Dual isotopic approach (13C and 18O) ... 39
2.7. Age effect and potential causes ... 41
2.8. Sampling strategies to study age effect ... 43
2.9. Common problems in tree ring isotopic study ... 45
2.9.1. Choice of a wood component for isotopic analysis ... 45
2.9.2. Correcting chronology for trends in atmospheric 13C ... 47
Transition………..51
CHAPTER 1: Genotype differences in 13C discrimination between atmosphere and leaf matter match differences in transpiration efficiency at leaf and whole-plant levels in hybrid Populus deltoides ! nigra...53
Transition……….111
CHAPTER 2: Vapour pressure deficit during growth does not affect the ranking of Populus nigra genotypes for transpiration efficiency at leaf as well as at whole tree level……….…113
Transition………..………...167
CHAPTER 3: Time course of !13C in poplar wood: genotype ranking remains stable over the life cycle in plantations despite differences between cellulose and bulk-wood……...169
Transition……….183
CHAPTER 4: Age related trend in !13C does affect the genotypic ranking in 3 Populus ! euramericana genotypes: A synchronic approach. ...185
GENERAL DISCUSSION AND CONCLUSION...213
PRESPECTIVES………..………..224
Fahad Rasheed PhD Dissertation 2012
Fahad Rasheed PhD Dissertation 2012
3
List of abbreviations
Variables Description
! Discrimination against 13CO2 during diffusion through stomata
A, Asat Net CO2 assimilation rate under ambient/saturating condition (µmol m-2 s-1)
(A/gs) Intrinsic transpiration efficiency over a diurnal cycle (µmol mol-1)
Asat/gsat Intrinsic transpiration efficiency under saturating condition (µmol mol-1) " Discrimination against 13CO2 during carboxylation
BM Total plant biomass accumulated during the experiment (g)
Ci/Ca Ratio of CO2 concentration in the atmosphere and in the substomatal spaces
Clb % carbon in bulk leaf tissues
Css % carbon % in the leaf soluble sugars
D Diameter at stem base (mm)
gm Mesophyll conductance to CO2
gs, gsat Stomatal conductance to water vapour under ambient/saturating condition (mol m -2
s-1)
H Stem height (cm)
LT Leaf thickness (µm)
Nlb % nitrogen in bulk leaf tissues
Nss % nitrogen in the leaf soluble sugars
PPFD Photosynthetic photon flux density (µmol photons m-2 s-1) SD Stomatal density (mm-2)
TE Whole plant transpiration efficiency = BM/WU (g l-1)
Tl Leaf temperature (°C)
TLA Whole plant leaf area (m2) LMA Leaf mass to area ratio (g m-2) VPD Vapour pressure deficit (kPa)
WU Cumulated water use (l)
#13Cair Carbon isotope composition of the air (‰)
#13C ss Carbon isotope composition of leaf soluble sugars (‰) #13Clb Carbon isotope composition of bulk leaf matter (‰)
$13Css Carbon isotope discrimination between atmosphere and leaf soluble sugars (‰) $13Clb Carbon isotope discrimination between atmosphere and bulk leaf matter (‰)
!13C offset Difference between "13Css and "13Clb (‰)
!13CM Carbon isotope discrimination predicted by the simple discrimination model (‰) !13Cdif Carbon isotope discrimination difference between predicted and observed (‰) #18Osw Oxygen isotope composition of source water (‰)
#18Olb Oxygen isotope composition of bulk leaf matter (‰) #18Olw Oxygen isotope composition of leaf water (‰)
$18Olb Oxygen isotope enrichment between source water and bulk leaf matter (‰)
"18Olw Oxygen isotope enrichment between source water and leaf water (‰) %c Proportion of carbon lost through respiration not used during photosynthesis %w Proportion of water lost during the day and night not used during photosynthesis
Fahad Rasheed PhD Dissertation 2012
4
Figure 1. Leaf of Populus wilmattae (a.k.a. Populus cinnamomoides) in a fossil record (58
million years B.P.) Photo by D. Dickmann.
Figure 2. Natural range of Populus nigra in Eurasia and Africa. Redrawn from Vanden Broeck
(2003).
Figure 3. Natural range of Populus deltoides. Redrawn from U.S. Geological Survey Earth
Fahad Rasheed PhD Dissertation 2012
5
INTRODUCTION
Poplars have a long cultural history. They are a part of agro-forestry systems and are managed to supply timber, fuel wood, forage, and serve as windbreaks. During the period between 1830 and 1848, poplar has been planted in France as a symbol of liberty and ambassador of the people (Populus). Fossil traces of poplar leaves date from Paleocene (55-60 million years BP) for the section Tacamahaca and Miocene (10-15 million years BP) for the section Aigeiros (Fig. 1). Populus nigra and Populus deltoides seem to descend from Populus
latior and Populus glandulifera respectively. Although Populus nigra cv. Italica has been
present for a long time in the Mediterranean regions of Europe, it has spread in France from 1749 on the banks of the Briare canal via Italy. Populus deltoides was introduced to Europe from North America in the late 17th and 18th century as cuttings.
1.1. The genus Populus:
Poplars are deciduous or rarely semi-evergreen trees with a wide natural distribution in the Northern Hemisphere, from the equatorial tropics to the limits of tree distribution area. Taxonomically, poplars are divided into six sections (Table 1). Populus deltoides and Populus
nigra belong to the section Aigeiros and are also known as eastern cottonwood and black
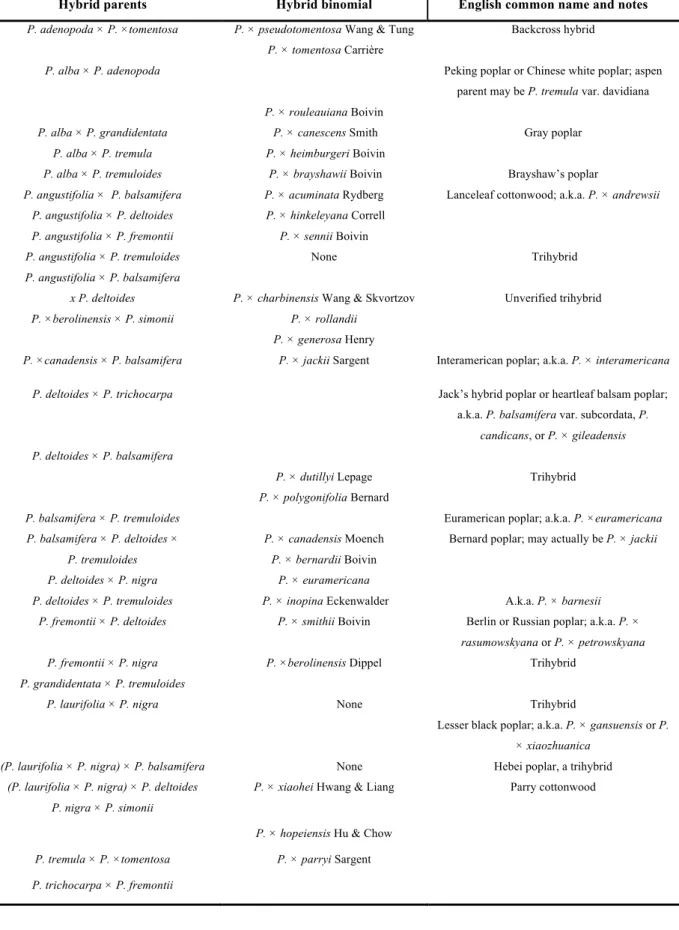
poplar, respectively. Barriers to gene flow among Populus species in natural populations are frequently ineffective, so spontaneous hybrids are common. Interspecific hybridization is common within most Populus sections. Table. 2 illustrates some specific and inter-sectional hybrids in the genus Populus, but inter-inter-sectional hybrids between Aigeiros and
Tacamahaca also occur in nature. Successful mating occurs with difficulty or not at all across
sectional lines in Abaso, Turanga, Leucoides, and Populus (Zsuffa 1973; Stettler et al. 1980). The dominant poplar in southern France is Populus nigra (for the natural range see Figure 1).
Populus deltoides, native to North America, has been introduced in Europe. These two poplars
are parents to many cultivated clones (for the natural range see Figure 2).
The vegetative propagation of poplars uses 20 to 30 cm long sections of dormant, one-year-old woody shoots as planting stock. If these “cuttings” are planted in the spring, they quickly produce roots from existing primordia in the inner bark and new shoots from lateral buds. Due to their fast growth, planted cuttings grow from 1 to 4 meters tall during the first growing season, depending on genotype, local environment and site conditions. The ability to produce adventitious roots also allows the use of entire young, several meter long shoots (sets) to be used as planting stock.
Fahad Rasheed PhD Dissertation 2012
6
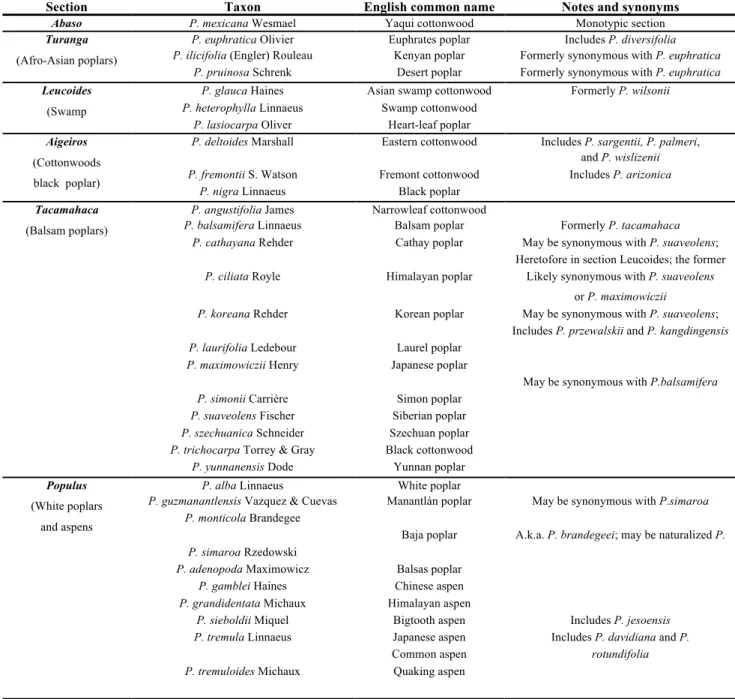
Table 1. Taxonomic classification of the genus Populus (FAO/IPC Poplars and willow in the world 2008)
Section Taxon English common name Notes and synonyms
Abaso P. mexicana Wesmael Yaqui cottonwood Monotypic section
Turanga
(Afro-Asian poplars)
P. euphratica Olivier Euphrates poplar Includes P. diversifolia
P. ilicifolia (Engler) Rouleau Kenyan poplar Formerly synonymous with P. euphratica
P. pruinosa Schrenk Desert poplar Formerly synonymous with P. euphratica
Leucoides
(Swamp
poplars)
P. glauca Haines Asian swamp cottonwood Formerly P. wilsonii
P. heterophylla Linnaeus Swamp cottonwood
P. lasiocarpa Oliver Heart-leaf poplar
Aigeiros
(Cottonwoods black poplar)
P. deltoides Marshall Eastern cottonwood Includes P. sargentii, P. palmeri,
and P. wislizenii
P. fremontii S. Watson Fremont cottonwood Includes P. arizonica
P. nigra Linnaeus Black poplar
Tacamahaca
(Balsam poplars)
P. angustifolia James Narrowleaf cottonwood
P. balsamifera Linnaeus Balsam poplar Formerly P. tacamahaca
P. cathayana Rehder Cathay poplar May be synonymous with P. suaveolens;
includes P. purdomii
Heretofore in section Leucoides; the former
P. tristis may be a hybrid with this species
P. ciliata Royle Himalayan poplar Likely synonymous with P. suaveolens
or P. maximowiczii
P. koreana Rehder Korean poplar May be synonymous with P. suaveolens;
includes P. ussuriensis
Includes P. przewalskii and P. kangdingensis
P. laurifolia Ledebour Laurel poplar
P. maximowiczii Henry Japanese poplar
May be synonymous with P.balsamifera
P. simonii Carrière Simon poplar
P. suaveolens Fischer Siberian poplar
P. szechuanica Schneider Szechuan poplar
P. trichocarpa Torrey & Gray Black cottonwood
P. yunnanensis Dode Yunnan poplar
Populus
(White poplars and aspens
P. alba Linnaeus White poplar
P. guzmanantlensis Vazquez & Cuevas Manantlán poplar May be synonymous with P.simaroa
P. monticola Brandegee
Baja poplar A.k.a. P. brandegeei; may be naturalized P.
alba var. subintegerrima
P. simaroa Rzedowski
P. adenopoda Maximowicz Balsas poplar
P. gamblei Haines Chinese aspen
P. grandidentata Michaux Himalayan aspen
P. sieboldii Miquel Bigtooth aspen Includes P. jesoensis
P. tremula Linnaeus Japanese aspen Includes P. davidiana and P.
Common aspen rotundifolia
P. tremuloides Michaux Quaking aspen
Fahad Rasheed PhD Dissertation 2012
7
Table 2. Some naturally occurring hybrids among taxa in the genus Populus (Eckenwalder 1996)
Hybrid parents Hybrid binomial English common name and notes
P. adenopoda # P. #tomentosa P. # pseudotomentosa Wang & Tung Backcross hybrid
P. # tomentosa Carrière
P. alba # P. adenopoda Peking poplar or Chinese white poplar; aspen
parent may be P. tremula var. davidiana
P. # rouleauiana Boivin
P. alba # P. grandidentata P. # canescens Smith Gray poplar
P. alba # P. tremula P. # heimburgeri Boivin
P. alba # P. tremuloides P. # brayshawii Boivin Brayshaw’s poplar
P. angustifolia # P. balsamifera P. # acuminata Rydberg Lanceleaf cottonwood; a.k.a. P. # andrewsii
P. angustifolia # P. deltoides P. # hinkeleyana Correll
P. angustifolia # P. fremontii P. # sennii Boivin
P. angustifolia # P. tremuloides None Trihybrid
P. angustifolia # P. balsamifera
x P. deltoides P. # charbinensis Wang & Skvortzov Unverified trihybrid
P. #berolinensis # P. simonii P. # rollandii
P. # generosa Henry
P. #canadensis # P. balsamifera P. # jackii Sargent Interamerican poplar; a.k.a. P. # interamericana
P. deltoides # P. trichocarpa Jack’s hybrid poplar or heartleaf balsam poplar;
a.k.a. P. balsamifera var. subcordata, P.
candicans, or P. # gileadensis P. deltoides # P. balsamifera
P. # dutillyi Lepage Trihybrid
P. # polygonifolia Bernard
P. balsamifera # P. tremuloides Euramerican poplar; a.k.a. P. #euramericana
P. balsamifera # P. deltoides # P. # canadensis Moench Bernard poplar; may actually be P. # jackii
P. tremuloides P. # bernardii Boivin
P. deltoides # P. nigra P. # euramericana
P. deltoides # P. tremuloides P. # inopina Eckenwalder A.k.a. P. # barnesii
P. fremontii # P. deltoides P. # smithii Boivin Berlin or Russian poplar; a.k.a. P. #
rasumowskyana or P. # petrowskyana
P. fremontii # P. nigra P. #berolinensis Dippel Trihybrid
P. grandidentata # P. tremuloides
P. laurifolia # P. nigra None Trihybrid
Lesser black poplar; a.k.a. P. # gansuensis or P.
# xiaozhuanica
(P. laurifolia # P. nigra) # P. balsamifera None Hebei poplar, a trihybrid
(P. laurifolia # P. nigra) # P. deltoides P. # xiaohei Hwang & Liang Parry cottonwood
P. nigra # P. simonii
P. # hopeiensis Hu & Chow
P. tremula # P. #tomentosa P. # parryi Sargent
Fahad Rasheed PhD Dissertation 2012
8
Table 3. Area (in ha) planted with wood producing poplars in 2003 and 2006 in France according to regions (http://www.peupliersdefrance.org).
Regions 2003 2006 Alsace 2000 2176 Aquitaine 17200 24974 Auvergne 1400 3329 Basse Normandie 4700 4586 Bourgogne 11900 14442 Bretagne 6100 8235 Centre 22600 22814 Champagne-Ardenne 21100 26864 Franche-Comté 2900 4134 Haute Normandie 1600 1890 Ile de France 2400 9576 Languedoc-Roussillon 900 1143 Limousin 900 329 Lorraine 3600 3540 Midi-Pyrénées 12500 14824
Nord Pas de Calais 9000 12863
Pays de la Loire 18900 22147
Picardie 23900 32108
Poitou-Charentes 13000 12177
Provence Alpes Côte d'azur 900 418
Rhône-Alpes 7700 10836
Fahad Rasheed PhD Dissertation 2012
9
Easy vegetative propagation from hardwood cuttings is a remarkable trait that has allowed the widespread and successful planting of selected pure species and hybrid clones, sspecially in the sections Aigeiros and Tacamahaca. On the other hand, Aspens (Populus tremula) cannot be propagated from hardwood cuttings, although they can from root cuttings, or leafy softwood cuttings. Thus, plantations of poplars outside these two sections (Aigeiros and Tacamahaca) are less common worldwide. During 2008, 52 million ha of poplars were growing all over the globe. Poplar cultivation is well developed in most countries of the northern hemisphere as compared to the southern hemisphere
1.2. Poplar hybrids
Spontaneous hybrids have been used in commercial culture for several decades. In addition to that, geneticists bred hybrids that were deployed in poplar cultivation throughout the world. The most common of these commercial hybrids belong to Populus # euramericana, which is the cross Populus deltoides (#) ! Populus nigra ($). To date, tree breeders continue producing new hybrid cultivars using microculture and biotechnology techniques to cross mating barriers.
In France, apart from a few genotypes of Populus deltoides, Populus trichocarpa and
Populus alba, poplar cultivation is dominated by (i) euramericana hybrids (Populus deltoides # nigra (ii) interamericana hybrids, stemming from the cross Populus deltoides # trichocarpa. Interamericana hybrids have been present in the French national catalogue since 1982. Over the
past 20 years, the resistance of these genotypes to fungal attacks drove the relative share of these two types of hybrids in french plantations. Interamericana hybrids showed remarkable hybrid vigour. Thus, between 1987 and 1997, interamericana hybrids, represented mainly by
'Beaupré' left very little room for euramericana cultivars. Nevertheless, these cultivars grown in
dense plantations suffered severe rust attacks (Melampsora larici-populina Kleb.) after 1997 due to their low quantitative resistance (Dowkiw & Bastien 2007). They were less and less used thereafter. Until 1998, sales of interamericana hybrids increased meagerly but thereafter decreased sharply in favour of the euramericana hybrids (Breton 2000; Paillassa 2001; Balzinger & Ginisty 2002). For almost 20 years, a strong increase in the relative proportion of
Euramericana cultivars growing in France, especially for the clone 'I214' since 2000 was
detected by FCBA (Forêt, Cellulose, Bois-construction, Ameublement; Thivolle-Cazat 2002). This shows that after a fall in interest for Euramericana cultivars between 1987 and 1997, farmers are showing a renewed interest in these hybrid poplars (see Figure 4 for its distribution in 2003).
Fahad Rasheed PhD Dissertation 2012
10
Figure 4. Distribution pattern of poplar cultivation in France (ha) in 2003 (Ministère de l’ Agriculture et de la Pêche 2004).
Fahad Rasheed PhD Dissertation 2012
11
1.3. Poplar cultivation
Traditionally, poplar has been cultivated in France since the 18th century. Due to import ban against trembling aspen for matches and okoume for plywood, poplar cultivation has regained farmer’s interest. Poplar cultivation was once again boosted after the creation of "The French Poplar Commission" in 1942, which became the "International Poplar Commission IPC" in 1947. It was a substantial initiative of France to promote poplar cultivation in collaboration with FAO (Food and Agriculture Organization of the United Nations). Since then, additional 28 countries have joined in and have enlarged the list of 8 pioneer members who responded to the call of attending the poplar week in April 1947. The tasks of IPC are multiple: to study the scientific, technical, socio-economical aspects of poplar culture; to promote the exchange of ideas and materials among researchers, producers and users; to create joint research programs and stimulate organization of meetings (Viart & Fugalli 1997; Viart 1999). In France, due to the long efforts of IPC and other forestry related organizations, the area under poplar cultivation increased from 100000 ha in 1939 to almost 185100 ha in 2003 (Table 3), which increased to 235000 ha in 2008.
Region wise, Picardie (32000 ha), Champagne-Ardenne (27000 ha), Aquitaine (25000 ha) and Centre along with Pays de la Loire (44000 ha) share most of the area under poplar cultivation (Table 3 & Figure 4). Such a large area makes poplar the third highest wood producing species in France after oaks and beech in 2003 and the second one in 2008 after oaks (1.5 million m3 of wood per year, FAO 2008).
Poplar wood is very versatile and widely used. It is light in weight (specific gravity 0.3 to 0.4) because of its porous anatomy. The wood is soft, creamy white in colour (except for a dark, pale brown heartwood or wood core), straight-grained and uniform in texture. Some species readily produce tension wood characterized by a low cell wall lignification which results in a woolly aspect of the wood. Wood of many poplar species displays a low strength, stiffness, shock resistance, decay resistance and bending properties. However, the wood can be worked easily with hand or machine tools. In addition, poplar wood can be easily glued, screwed and nailed. Staining can be patchy but paints and varnish are easily applied. Poplar wood is widely used to manufacture pulp and paper, peeled and sliced veneer, composition boards (including oriented-strand board), sawn lumber, crates, boxes, matches, chopsticks, poles, furniture, cabin logs, and excelsior. In 2008 in France, 32% of the harvested poplar wood volume was used for light peeling, 7.9% for veneer plywood, 24.4% for export veneer, 24.7% for sewing palettes and 11% for sawing crates and bedding.
Fahad Rasheed PhD Dissertation 2012
12
Figure 5. Boxplots for the values of the discrimination against 13C (!13C) recorded in the bulk leaf matter of a range of Populus # euramericana genotypes grown in a factorial experiment in
the field at Orléans, during 2003 and 2004. During 2004, a moderate drought treatment was applied to half the individuals and induced a decline of !13C. Values recorded during 2003 were
influenced by the heat and drought stress that happened during that year. Based on Spearman’s rank correlation (rs), the genotypic ranking remained same as found in 2003. Modified from
Monclus et al. 2006. Well irrigated
Well irrigated
Fahad Rasheed PhD Dissertation 2012
13
1.4. Research questions and thesis objectives
Poplars occupy an important place in the timber industry. To meet the currently increasing industrial demand, growers are bringing new areas under poplar cultivation such as in the Pays de la Loire and Garonne regions. As a result of this extension in addition to predicted climate change, an enhanced risk of drought events might have a negative influence on the productivity of poplar genotypes. In this scenario, the question of the effect of water supply on productivity is becoming more and more important. In this context, the concept of transpiration efficiency (total biomass accumulated with respect to water transpired) gains interest. More transpiration efficient poplar genotypes, selected on the basis of reduced water consumption (or stomatal conductance) could ensure efficient water use and a sustained production by enhancing conservation of soil water and allowing plants to remain physiologically active.
In this respect, the work done during this thesis fits the long chain of studies done on poplar genotypes during a collaboration between two laboratories, Forest Ecology and Ecophysiology (EEF, UMR 1137 INRA/Université de Lorraine) and Laboratoire de Biologie des Ligneux et des Grandes Cultures (LBLGC, UPRES-EA 1207, University of Orléans). The aim of these two labs is to identify the ecophysiological and molecular bases controlling the genetic and phenotypic variation of complex traits in trees. Traits of interest include water use efficiency (WUE) and drought tolerance. In this regard, their main focus is on the commercialized poplar cultivars like Populus # euramericana and wild type Populus nigra. The aim is to detect genetic material that is both water-use efficient and adapted to the different cultivation regions. In this context, the detection of genotypes, noticeably of Populus #
euramericana, were the centre of interest (thesis dissertation of N. Marron 2000-2003, R.
Monclus 2002-2006 and L. Bonhomme 2005-2009).
Poplar hybrids are known for their potential to produce high volumes of wood in short periods of time (Marron et al. 2005; Marron & Ceulemans 2006; Marron et al. 2007) but are generally sensitive to drought. Their productivity is very closely linked to water availability that can limit growth, wood quality and eventually favour the installation of pathogens (Marçais et
al. 1993; Barigah et al. 1994; Pinon & Valadon 1997; Loustau et al. 2005). Therefore, it
becomes a very important issue to detect genotypes that combine productivity, high wood quality and tolerance to biotic and abiotic stresses. In Populus # euramericana genotypes, previous studies have highlighted a wide range of genotypic variation for growth potential, transpiration efficiency at leaf level (estimated through 13C discrimination; see Figure 5 b;
Fahad Rasheed PhD Dissertation 2012
14
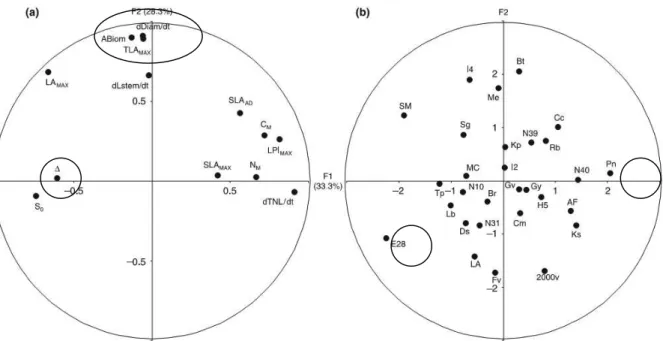
Figure 6. PCA from Monclus et al. (2005) showing (a) lack of correlation between istopic discrimination against 13C (!) and productivity traits like above ground biomass (ABiom), stem
diameter (dDiam) and maximum leaf area (TLAmax) as they are present on the opposite axis on the PCA (b) and large genotypic variability for productivity traits and ! between tested 29
genotypes (Populus deltoides # nigra). ! varied between 18.73‰ for Pannonia (Pn) and 21.51‰ for Eco-28 (E28). Reprinted from Monclus et al. 2005.
Fahad Rasheed PhD Dissertation 2012
15
Marron et al. 2005; Dillen et al. 2008) and tolerance to moderate drought (Monclus et al. 2005; Monclus et al. 2006; Bonhomme et al. 2008). A large genotypic variability has also been found in the amplitude of the drop of productivity in response to water shortage among poplar cultivars (Gebre et al. 1994, 1998; Liu & Dickmann 1996; Chen et al. 1997; Harvey & van den Driessche 1997; Robison & Raffa 1998; Tschaplinski et al. 1998; Marron et al. 2003; Monclus
et al. 2006).
These initial studies were based on the measurement of instant transpiration efficiency (TE) through leaf gas exchange measurements and of time-integrated TE using the natural abundance of stable carbon isotopes (#13C) in leaf tissues (Marron et al. 2005; Monclus et al.
2005, 2006; Bonhomme et al. 2008; Dillen et al. 2008, 2009). Along with the variability detected among genotypes in the discrimination against 13C from the atmosphere to the leaf matter ($13C), morphological indicators for productivity were identified such as the maximum
area of single leaves and total leaf area. Furthermore, no relation was evidenced between productivity and $13C (Fig. 6 a, b) both in open field experiments and under controlled
environment. Under moderate drought, $13C decreased but the genotypic ranking remained
intact, evidenced through Spearman’s rank correlations (see Figure 5; Monclus et al. 2006). Along with this large genotypic variability for productivity and the stability of genotype ranking for $13C, stomatal conductance was found to be responsible for genetic variation in $13C
(Monclus et al. 2006). More recently, Dillen et al. (2008) also evidenced the lack of direct relationship between stomatal traits and plant growth or $13C in Populus # euramericana
genotypes. Such results in various poplar genotypes (i.e., the absence or weak relationship between $13C and growth) open the possibility of selecting genotypes combining high
productivity and high transpiration efficiency.
In these studies, the genetic variability of TE was exclusively measured through $13C (as
an estimator of TE). Furthermore, experiments included very young individuals (up to 2 years) grown in a greenhouse or in open-field experiments. Extrapolating the conclusions obtained at leaf scale and concluding about stability of genotypic variability for whole plant TE can be tricky. Factors like %c and %w (carbon lost during respiration and water lost during night
respectively) may vary between genotypes, thus the observed genotype variability in $13C may
not perfectly match the genotype variability in whole plant TE. Previous studies have found that variability in $13C does not necessarily reflect the variability in whole plant TE (Sun et al. 1996;
Picon et al. 1996a; Turner et al. 2007; Matzner et al. 2001). Thus, to select genotypes for lower !13C, we need to be sure that observed genotype differences in $13C
Fahad Rasheed PhD Dissertation 2012
Fahad Rasheed PhD Dissertation 2012
17
really reflect differences in whole plant TE. Another important question is the temporal stability of genotype ranking for $13C. $13C decreases in many species with increasing age and
the intensity of the decrease varies among species (Francey & Farquhar 1982; Bert et al. 1997; Duquesnay et al. 1998; McCarroll & Pawellek 2001). A 2.8‰ range of genotype values of $13C
has been detected across 29 Populus # euramericana genotypes. This range and the genotype ranking is susceptible to change with age. Thus, it becomes important to verify if the genotype ranking for $13C remain stable till the end of a rotation. Around these two main objectives, four
experiments were designed along two general objectives:
1) To check whether genotypic differences in $13C reflect genotypic differences in whole plant TE (upscaling from leaf to whole plant).
• under optimum growth conditions: the upscaling approach was tested in six Populus
deltoides # nigra genotypes showing contrasting $13C (Monclus et al. 2006). Plants
were grown under a controlled and stable humid environment where optimum light, temperature and soil moisture were provided. Water transpired, biomass produced, $13C
(leaf soluble sugars and bulk leaf matter), diurnal variations in net CO2 assimilation (A) and stomatal conductance to water vapour (gs) and $18O (bulk leaf matter and leaf
water) were measured (Chapter 1);
• under different evaporative demands: the upscaling approach was tested in six
Populus nigra genotypes originating from natural populations along the Loire river with
contrasting $13C (Chamaillard et al. 2011). Plants were grown in two growth chambers
under 75% and 45% relative humidity. Optimum light, temperature and soil moisture were provided. Water transpired, biomass produced, $13C (leaf soluble sugars and bulk
leaf matter), diurnal variations in A and gs and $18O (bulk leaf matter and leaf water)
were measured (Chapter 2).
2) To check for the stability of genotype ranking for $13C with age with:
• a diachronic approach: $13C was recorded in annual rings along tree cores. Different
genotypes of similar age and growing under a similar environment (common garden) were used. This approach was repeated on three different sites (Chapter 3);
• a synchronic approach: $13C was recorded in the last annual ring (2009). Three Populus deltoides # nigra genotypes were tested and samples were taken from trees of
different ages growing under different environments. Using this approach, the effects of long term environmental changes were minimized and tree age effect was maximized
Fahad Rasheed PhD Dissertation 2012
18
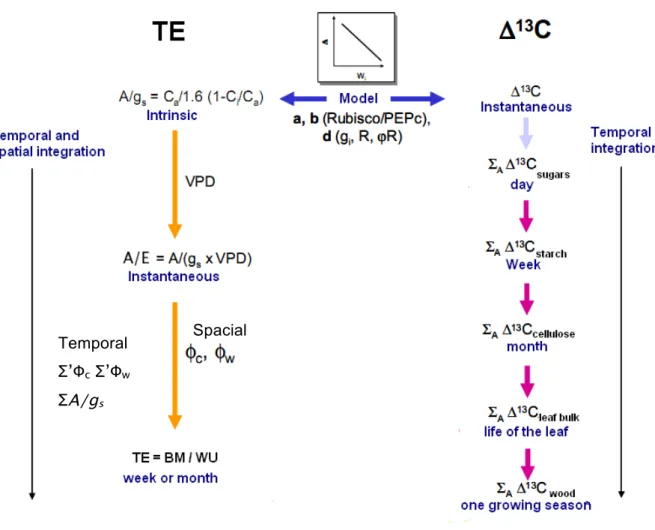
Figure 7. Theoretical relationship between transpiration efficiency measured at different integration levels. At leaf level through gas exchange, at whole plant level by estimating biomass accumulated and water transpired and through isotopic discrimination of 13C in the
organic matter with respect to source (Modified from Konate thesis dissertation 2010). Temporal
Σ’Φc Σ’Φw ΣA/gs
Fahad Rasheed PhD Dissertation 2012
19
2. STATE OF THE ART
2.1. Water use efficiency at different integration scales
Water use efficiency has become a trait of interest in various fields: agronomy, forestry or ecology. In agronomy, improving water use efficiency in crop plants means to increase production under a given water supply (Richards et al. 2002). This can be done: (i) by reducing runoff and drainage, (ii) by reducing evapotranspiration, (iii) by improving transpiration efficiency TE, (iv) by improving the harvest index. Evapotranspiration in a crop can be reduced simply by increasing crop density. This will reduce the water loss directly from the soil surface and will increase the fraction water used by the plants. TE can be increased by acquiring more carbon in exchange of water transpired by the plants, and harvest index can be increased by increasing of the ratio harvestable product vs. the achieved biomass.
In forestry, TE is often studied at plant scale as well as at ecosystem scale (i.e. the gain of ecosystem carbon vs. actual evapotranspiration; Law et al. 2002). At plant scale, several definitions of TE coexist, allowing access to different spatial and temporal integration levels. At whole plant scale, TE is measured as the ratio between biomass accumulated and the amount of water transpired by the plant for a certain period of time.
2.1.1 At leaf level
At leaf level, TE can be defined as “intrinsic" or "instant” TE (Figure 7; A/gs and A/E
respectively). Intrinsic TE or A/gs (µmol CO2 mol-1 H2O) is the ratio of net CO2 assimilation (A,
µmol CO2 m-2 s-1) and stomatal conductance to water vapour (gs, mol H2O m-2 s-1). The influx of CO2 (A) from atmosphere to the leaf interior is described as product of the mole fraction difference of CO2 between the atmosphere and the intercellular spaces respectively (Ca & Ci, in
µmol CO2 mol-1
air) and stomatal conductance to CO2 (gc, mol CO2 m-2 s-1), which is the
inverse of resistance, hence A = gc (Ca - Ci). As water vapour diffuses 1.6 times faster than CO2,
then: gs =1.6 gc thus, A gs = Ca! Ci 1.6 = Ca(1! Ci/ Ca) 1.6 (1)
Instant TE, i.e., A/E, depends on instrinsic TE and another environmental component, namely % (the difference in water vapour mole fraction between the leaf and the atmosphere), which can be highly variable with time.
Fahad Rasheed PhD Dissertation 2012
Fahad Rasheed PhD Dissertation 2012
21
A/E (µmol CO2 mol-1 H2O) represents the ratio of influx of CO2 entering the leaf and the flux of water vapour out of the leaf (or transpiration, denoted by E in mol H2O m-2 s-1) during photosynthesis. Transpiration is calculated using the product between gs and the mole fraction
gradient of water vapour (%, mmol H2O mol air-1) between the leaf (wi, mmol H2O mol air-1) and
atmosphere (wa, mmol H2O mol air-1) (% = wi - wa), hence E = gs %.
! 6 . 1 ) / 1 ( i a a C C C E A " = (2)
2.1.2 At whole plant level
Whole plant TE is the integrated value of instant TE over time across the entire plant. Whole plant TE is usually recorded over several weeks or months and is based on gravitational measurements of accumulated dry biomass (BM) and water loss through transpiration accumulated over the entire period of the experiment (WU; Figure 7). Thus, whole plant TE is expressed in g BM g-1H2O.
The estimation of whole plant TE is laborious because it includes weighing potted plants at leastevery day to assess the total water transpired over a given period. On the other hand, measuring whole plant TE on a mature tree is very difficult. Olbrich et al. (1993) measured TE at whole tree level, which was measured from total biomass gain (including roots), which is not easy to determine. Intrinsic TE being much simpler to measure could be used to deduce whole plant TE based on the theoretical relationship between the two terms (Farquhar & Richards 1984):
TE=Ca(1+!c)(1! Ci/ Ca) 1.6" (1+ !w)
(3)
where %c is the fraction of carbon lost during respiration in non photosynthesising
tissues and during night, and %w is the fraction water lost during night and in
non-photosynthesising tissues. This relationship between intrinsic TE and whole plant TE has been experimentally detected in different species, under varying environmental conditions, such as different water supply (Osorio & Pereira 1994; Matzner et al. 2001) or under different doses of nitrogen fertilization (Ripullone et al. 2004). Only a few studies have found correlations between these traits at intra-specific level, under non-limiting conditions like in Eucalyptus populations (Li 2000). At times, relating intrinsic and whole plant TE can be very tricky as both traits are very plastic under natural environment. Since intrinsic TE is measured at leaf scale, while whole plant TE is integrated to whole plant and over long periods of time, different environmental factors affecting both traits can interfere during this upscaling.
Fahad Rasheed PhD Dissertation 2012
22
Figure 8. Diagram showing the main environmental factors in&uencing $13C (reproduced from
Fahad Rasheed PhD Dissertation 2012
23
This question becomes even more important when the objective is to use the upscaling approach among closely related poplar genotypes for testing if differences in intrinsic TE actually reflect the differences in whole plant TE. While scaling up from intrinsic to whole plant TE, the proportion of carbon fixed during photosynthesis and lost through respiration of roots and stems during the day and the roots, stems and leaves at night ($c), and the proportion of water lost by
the plant independently of photosynthetic processes ($w) play an important role. On the other
hand, intrinsic TE is highly reactive to the diurnal variation in irradiance, temperature, VPD, CO2 concentration. Other influencing factors are summarized in Figure 8. Sometimes these factors become so important that we are unable to evidence any correlation between intrinsic and whole plant TE (e.g. Sun et al. 1996 for white spruce). Thus, such relationships must be verified. A first step was taken in this study by testing this upscaling approach under controlled environmental conditions and under different evaporative demands, i.e., different vapour pressure deficits (VPD).
2.2.
13C discrimination as an estimator of intrinsic TE
In nature, there are two isotopes of carbon, the lighter isotope 12C (98.9%) and the heavier isotope 13C (1.1%). The composition in 13C (#13C) is expressed with respect to a tandard,
namely Pee Dee Belemnite.
#13C = (Rsample /Rstandard -1)1000 (4)
where Rsample and Rstandard are the 13C/12C ratio in a sample and in the standard (Pee Dee
Belemnite), respectively. #13C values are negative as organic matter always contains less 13C than the standard (Farquhar & Richards 1984). Isotopic discrimination ($13C) is defined as the
isotopic composition of the plant material with respect to th of the air on which the plant has fed: 13 C = ! 13 Cair !13 Cplant 1000+!13C plant ' (()1000 (5) where #13Cair and "13Cplant are the isotopic composition of air and sample, respectively. The two traits (#13C and $13C) are negatively related to each other. In C3 plants, this discrimination is partly caused by the diffusion of CO2 from the atmosphere into the intercellular spaces (a) and
Fahad Rasheed PhD Dissertation 2012
24
Figure 9. Diagram showing the main fractionation factors that contribute to the carbon isotope discrimination during photosynthesis (a and b); modified from McCarroll &Loader 2004).
Figure 10. Carbon isotope discrimination (') displays a positive correlation with the ratio of internal to ambient CO2 concentration (Ci/Ca) and a negative one with intrinsic TE (WUEi) in
western red cedar. Changes in both traits were induced by changes in VPD. Reproduced from Grossnickle et al. 2005
Fahad Rasheed PhD Dissertation 2012
25
the initial reaction of carboxylation (mainly ribulose-1,5-bisphosphate carboxylase (Rubisco, b). Other fractionation processes are also involved like the dissolution and the diffusion of CO2 in the liquid phase, photorespiration and respiration during the day (Farquhar et al. 1988; Farquhar
et al. 1989). Initially, the effect of these fractionation factors on $13C values was considered to
be small; but there is now a consensus that they are significant (Brugnoli & Farquhar 2000; Ghashghaie et al. 2003). Farquhar et al. (1982) established a discrimination model linking 13C discrimination of CO2 during photosynthesis and the Ci/Ca ratio (the mole fractions of CO2 in the intercellular spaces and in the atmosphere), which is inversely related to A/gs.
!13C
= a + (b " a)Ci
Ca (6)
where a is the discrimination against 13CO2 during diffusion through stomata (4.4‰) and b is the discrimination at the time of carboxylation; b varies between 27- 30‰; Warren 2006 (Figure 9).
Given the relationship between $13C and Ci/Ca and between A/gs and Ci/Ca (Equation 4
and 1 respectively), for C3 plants, $13C is related negatively to A/gs and positively to Ci/Ca
(Farquhar & Richards 1984). The theoretical relationship between A/gs and $13C was validated
experimentally in trees (see Figure 10), in intra-specific and several other studies (Zhang et al. 1994; Lauteri et al. 1997; Roupsard et al. 1998; Cregg et al. 2000; Grossnickle et al. 2005). In oaks, Ponton et al. (2002) showed a negative relationship between A/gs and $13C. However,
some studies failed to obtain this relationship, such as in white spruce (Sun et al. 1996), in sessile oak (Picon et al. 1996) and in six lentil genotypes (Turner et al. 2007). The lack of relationship between $13C and A/gs is often due to (i) time scale integration; instantaneous
measurements of gas exchange (A/gs) being highly sensitive to variable environmental
conditions; (ii) variation in the quantity and turn-over rate of different leaf metabolites; some metabolites being enriched and others depleted in 13C (addressed in detail in the following discussion).
In many earlier studies, a shift was observed between predicted (using Equation 6) and observed values of discrimination. The magnitude of this shift differed between species as has been summarized in Figure 11. It is well established now that this under-estimation is due at least partly to limitations in the pathway of CO2 diffusion from sub-stomatal cavities to the sites of carboxylation inside the chloroplast (often referred to as mesophyll conductance; gm), which
is not taken into account in the simple discrimination model. These limitations imply that Ci >
Fahad Rasheed PhD Dissertation 2012
26
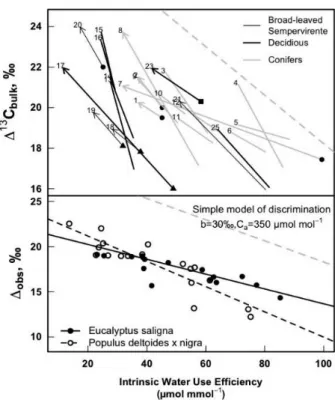
Figure 11. Upper panel: relationships between intrinsic TE calculated as A/gs in mol CO2 mol -1
H2O and !13C (in ‰) measured on leaf bulk matter in different species. The dashed grey line is the relationship predicted by the simple Farquhar model of discrimination (Equation 6), with
b=30‰ and Ca=400 mol mol-1
Lower panel: Relationship between $13C measured with online discrimination and intrinsic TE
(A/gs) for Eucalyptus saligna leaves (filled circle, each is an average of $13C and Wi recorded
during 15 min) and Populus deltoides x nigra cuttings (empty circle, each is an average of !13C and Wi recorded during 30-45 min). The dashed grey line is the relationship predicted by the
simple model of discrimination, with b=30‰ and Ca=350 mol mol -1(i.e. the averaged Ca
during the experiments). Reproduced from Cyril Douthe dissertation 2010).
Figure 12. The product of whole plant TE of C gain (TEc) and daytime vapour-pressure deficit of ambient air (Dg) plotted against whole-plant 13C discrimination. Different symbols refer to
Fahad Rasheed PhD Dissertation 2012
27
measurement of 13C discrimination and A/gs (from gas exchange measurements) or comparing
A/gs with the isotopic signatures recorded in the primary photosynthetic product (soluble sugars
in leaves, Brugnoli et al. 1988). These limitations impose a significant slow-down to the diffusion of CO2 inside the leaf. They are variable among genotypes (Barbour et al. 2010). By combining the 13C/12C fractionation associated to respiration and the diffusion of CO2 through the mesophyll layers and assuming that these effects are either constant or negligible, Farquhar & Richards (1984) produced a complete description of !13C, which can be represented as follows:
(
)
a c d d a a c a c i l s a i s a s a b C C R A R e C f C C b C C C a b C C C a C C C a C * * 13 ' "! + " ! " + " + + " + " = # (7) where ab (2.9‰) and al (0.7‰) are the fractionation associated with the diffusion through leafboundary layer and leaf water. bs is the fractionation as CO2 moves in to the solution which is taken as 1.1‰ at 25°C. cs and cc are the CO2 concentration at the leaf surface and at the site of carboxylation respectively. e’ and f are the fractionation associated to mitochondrial respiration during the day and to photorespiration respectively. !* is the CO2 compensation point in the absence of non-photorespiratory respiration (Rd). Thus we can weight the fractionation during
carboxylation as a ratio between CO2 concentrations in the chloroplast to ambient air (Cc/Ci)
rather CO2 concentrations in the intercellular spaces to ambient air (Ci/Ca).
Instant TE at leaf level and !13C can be extrapolated to the whole plant scale. Indeed, by combining equations 3 and 6, we obtain a theoretical relationship between $13C and whole TE.
Cernusak et al. (2008) found a negative correlation between $13C and whole plant TE in tropical
tree species (see Figure 12). The same way as for the relationship between instant and whole plant TE, factors (evaporative demand, $c, $w) may intervene at times and can result in lack of
correlation between TE and !13C (Guehl et al. 1995; Matzner et al. 2001; Ripullone et al. 2004; Turner et al. 2007). It is therefore important to verify whether variability of !13C among poplar genotypes reflects the variability in whole plant TE.
2.3. Other sources of variation in
13C signals: isotopic signature of different
organic compounds
13
C isotope composition ("13C) can be analysed for different compounds or organs. At both ends of time scales from instant values of A/gs and the isotopic composition of total
organic matter, there is a long chain of physiological and biochemical processes. Each of these processes is likely to add additional isotopic fractionation and thus may cause changes in the carbon isotope signature (for a review see Bowling et al. 2008 and figure 13).
Fahad Rasheed PhD Dissertation 2012
28
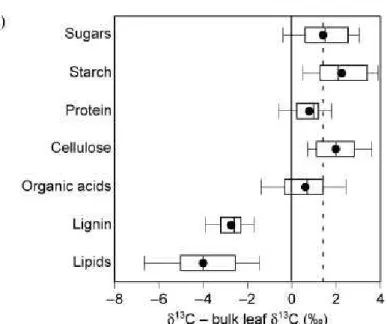
Figure 13. An update from Boutton (1996) comparing the isotopic composition of compounds isolated from leaves of C3 plants, expressed relative to bulk leaf biomass. The boxes encompass
the upper and lower quartiles of the data, the line shows the median, the symbol shows the arithmetic mean, and the error bars show the upper and lower 10th percentiles of the data. The
vertical dashed line is included for easy reference to the 13C of leaf sugars. Reproduced from Bowling et al. 2008
Fahad Rasheed PhD Dissertation 2012
29
Plant organs consist of complex mixtures of molecules with different isotopic signatures. Leaves and stems are composed of cellulose, hemicellulose, lignin and many other compounds. These molecules form a stable pool of carbon accumulated over leaf growth. The second reservoir of carbon molecules displays a rapid turnover, and includes soluble sugars and starch. The isotopic composition of total organic matter is the sum of that of each of these pools. Any discrimination and the use of certain substrates enriched or depleted in 13C during the process of mitochondrial respiration may contribute to alter the isotopic signature of leaf matter.
In addition, the isotopic composition of organic matter also depends on the discrimination involved in the respiratory and photorespiratory processes (for a review, Ghashghaie et al. 2003). During photorespiration, the CO2 released is depleted in 13C, and this affects the discrimination observed during measurements of gas exchange. The impact of photorespiration on the isotopic composition of the plant is considered to be small (Douthe et al. 2012). Some authors concluded that non-photorespiratory respiration does not significantly affect the isotopic composition of the leaf (Lin & Ehleringer 1997), as hypothesised by Farquhar et al. (1982, 1989), Farquhar & Richards (1984) and Farquhar & Lloyd (1993). However, studies with
Phaseolus vulgaris L. (Duranceau et al. 2001), Nicotiana sylvestris and Helianthus annuus
(Ghashghaie et al. 2001) invalidated the previous statements: the CO2 released during non-photorespiratory respiration can be enriched with respect to organic matter by 6‰ as also shown by Xu et al. (2004). However this fractionation caused by non-photorespiratory respiration varies according to species, stage of plant development and with environmental conditions including drought (Ghashghaie et al. 2001; Xu et al. 2004).
Differences in the 13C signature of different organs (Brugnoli & Farquhar 2000; MacFarlane et al. 2004; Peuke et al. 2006; Cernusak et al. 2007a,b), and changes during leaf development (Holtum & Winter, 2005) and along the growing season (Jaggi et al. 2002; Keitel
et al. 2003) have also been observed. The isotopic discrimination between atmospheric CO2 and leaf soluble sugars (glucose, fructose and especially sucrose), the first products of photosynthesis, reflect an integration of gas exchange over a few days (Brugnoli et al. 1988; Brugnoli & Farquhar 2000). 13C signature of starch is an integrator in the medium term (approximately one week, Jaggi et al. 2002). The analysis of components with longer life spans, such as cellulose, leaves, helps to integrate isotopic discrimination during a much larger period (formation period of the leaf, or different types of wood). Moreover, post-photosynthetic fractionation results in changes of isotopic signals depending on compound family (Brugnoli & Farquhar 2000; Badeck et al. 2005, Bowling et al. 2008). Thus, the relative quantity of these
Fahad Rasheed PhD Dissertation 2012
Fahad Rasheed PhD Dissertation 2012
31
molecules present in bulk material can significantly influence the overall 13C signal and deconnect it from the values expected from A/gs. Thus, care must be taken while interpreting the results. One way of dealing with this potential discrepancy is the extraction of single components close to the photosynthetic process.
2.4. Use of oxygen isotopes as estimator of stomatal conductance
It is of importance to identify the relative contribution of A and of gs to the variability of
intrinsic TE (=A/gs). The use of 13C alone brings no clue to this question. Analysis of the 18O
isotopic composition ("18O) of leaf water and leaf organic matter is another tool that might help overcome this limitation. It can indeed estimate gs independently of A, and thus can be used to
differentiate the changes in "13C due to A or to gs.
2.5.
18O enrichment in the leaf
There are three stable isotopes of oxygen: 16O, 17O and 18O. 16O is the most abundant (99.76%), followed by 18O (0.20%). 18O isotopic composition ("18O) of a sample represents the 18
O/16O ratio of the sample with respect to that of the international standard V-SMOW (Vienna Standard Mean Ocean Water).
1000 1 dard tan sample 18 ! " # $ % & ' ( )) * + ,, -. = s R R O / (8) where Rsample and Rstandard are the 18O/16O ratios in a sample and standard (Vienna-Standard
Mean Ocean water). Isotopic discrimination in the plant material is then estimated as:
!18 Osa = ! 18 Osw"!18Osa 1000+!18Osa # $ % & ' ()1000 (9)
where "18Osa represents the enrichment of the plant material (leaf bulk or leaf water) with
respect to the source water (!18Osw).
The enrichment of total leaf water ("18Olw) with respect to source water depends on
various factors. First, 18O isotopic composition of soil water (or source) reflects the average 18O composition of precipitation, and is influenced by the direct evaporation from the soil surface. No isotopic fractionation is expected as the water moves into the roots and from the roots towards the other parts of the plants (leaves). Thus, the isotopic composition of xylem water and the water flowing through the petiole is assumed to be the same than that of the soil water (Sternberg et al. 2003; Gan et al. 2002). Leaf water is enriched with respect to xylem water. This enrichment occurs at the sites of evaporation as H216O evaporate slightly faster than H218O.
Fahad Rasheed PhD Dissertation 2012
Fahad Rasheed PhD Dissertation 2012
33
2.5.1.
18O enrichment of leaf water at the sites of evaporation
The enrichment of water at the sites of evaporation ("18Oe) with respect to source water
is described by following model (Craig & Gordon, 1965; Dongmann et al. 1974): !18Oe=!k+! * +(!
18O v"!k)
ea
ei (10)
where $18Ov is isotopic composition of water vapour ($18Ov = #18Ov - #18Osw ; #18Osw is the
isotopic composition of the source water).
(k is the kinetic fractionation as water vapour diffuses through the stomata and the boundary layer and is calculated by the following equation:
!k=
32rs+ 21rb
rs+ rb (11)
where rs and rb are stomatal and boundary layer resistance to water flux (= 1/gs and 1/ga),
respectively.
(* is the fractionation associated with phase change from liquid water to water vapour and is sensitive to temperature. (* (‰) is calculated following Majoube (1971):
!* = exp 1.137 T2 ! 0.4156 T ! 0.0020667 " # $ % & ' !1 (12) where T is in K;
Computations show that ( * is 9.1‰ at 25°C and 9.5‰ at 20°C.
ei is the mole fraction of water vapour in the intercellular spaces (mmol H2O mol-1 air) ei= 10 * (6.1078 * exp(17.2694*! )/(237.2+! )
) / p (13)
where ) is leaf temperature in ° C and p, the atmospheric pressure (mbar)
ea is the mole fraction of water vapour in the atmosphere (mmol H2O mol-1 air )
where ea= ei * 100/RH with RH, relative humidity (%)
given that v is the difference between ei and ea, ea/ei can be replaced with (1-v/ei)
) / 1 )( ( * 18 18 i k v k e O v e O = + + " ! ! " # # # (14)
thus $18Oe is predicted to increased with increased v.
Enriched water is likely to flow back inside the leaf and dilute the expected 18O signals of the leaf water. This process called "Péclet effect" (Farquhar & Lloyd 1993) was described as a continuous isotopic gradient in the leaf, with maximum enrichment at the sites of evaporation, and exponentially decreases until it reaches the isotopic signature of the source water ("18Osw) near the veins. The 18O enrichment of mesophyll water ('18OL) is also connected to '18Oe (Farquhar & Lloyd 1993) by the following equation:
Fahad Rasheed PhD Dissertation 2012
34
Figure 14. The relationship between measured and modelled laminar mesophyll water enrichment ('L) for tree species grown at high and low humidity: (A) the Craig-Gordon model, (B) the Péclet effect model using a single fitted effective length, and (C) the Péclet effect model using effective lengths for Alder, Birch and cottonwood. Reproduced from Barbour et al. 2004.
Fahad Rasheed PhD Dissertation 2012 35 !18O L= ! 18O e(1" e "# ) /# (12)
or '18OL = "18OL – "18Osw, or "18OL is the isotopic composition of water from the mesophyll (‰) and # the Péclet number:
CD EL
=
! (15)
where E = gs * % with % the difference in mole fraction water vapour between the atmosphere
and the intercellular spaces (% = ei - ea, in mmol H2O mol air-1);
-L is the effective distance between the sites of evaporation and veins; L varies between
4 to 166 mm, after Wang et al. (1998);
-C is the molar concentration of water (55.5 mol m*3);
-D is the diffusivity of water H218O (2.66!10*9 m2 s*1 ; Barbour et al. 2004).
Since leaf water is a mixture in varying proportions of depleted and enriched water from different pools, the enrichment of mesophyll water (or total leaf water, "18OL) is lower than the
enrichment observed at the sites of evaporation ("18Oe) (Farquhar & Lloyd 1993). This
discrepancy was explained by the factor !, which depends on the effective distance between the sites of evaporation and veins (L; Figure 14). The actual distance between the veins and the stomata is about 100 µm for most of the leaves. L depends on the route by which water passes (symplasmic through the plasmodesmata, transcellular through aquaporins or apoplasm), but also of the site from which it is evaporated (intercellular spaces, sub-stomatal cavities or cells surrounding the cavities sub-stomatal and stomatal) (Barbour & Farquhar 2003). The factor !
is also determined by transpiration (E). However, E is defined as the product of stomatal conductance to water vapour (gs) and the vapour pressure deficit between the atmosphere and the intercellular spaces (%). When the changes in E are caused by changes in % while gs is
constant, the relationship between '18OL and E (and hence %) is positive. On the other hand, where % is constant and that changes in gs are a cause of changes in E, then the relationship
between '18OL and E (and thus gs) is negative (Farquhar et al. 2007). This negative relationship
is caused by different processes: an increase in gs has the effect of reducing the kinetic
fractionation during diffusion of water vapour through the stomata and boundary layer ((k), which leads to a decrease in '18Oe. In addition, when the stomata close and transpiration decreases, leaf temperature increases and thus ei, which also results in a decrease in '18Oe and
vice versa. The change in temperature can also influence the fractionation factor bounded to the equilibrium phase: changes from liquid water to water vapour ((*), but the impact on '18Oe are low.
Fahad Rasheed PhD Dissertation 2012