Numerical analysis of the role
of radiogenic basement on temperature
distribution in the St. Lawrence Lowlands,
Québec
Hejuan Liu
1,2, Bernard Giroux
1*, Lyal B. Harris
1, Steve M. Quenette
3,4and John Mansour
4Introduction
Active volcanic or magma-related systems possessing a high heat flow at plate mar-gins have received attention for geothermal energy because of their high temperature at shallow depths (Capuno et al. 2010). Regions with low or medium surface heat flow in stable cratonic areas, such as in eastern Canada, have received much less attention. In some such regions, there, however, may still be potential to develop high-tempera-ture “Hot Dry Rock” geothermal resources (summarized by Hillis et al. 2004), especially
Abstract
Regions with low or medium surface heat flow in stable cratonic areas, such as in eastern Canada, have received little attention for geothermal energy. In the presence of a high heat-producing basement overlain by a sedimentary cover, however, such areas might be prospective. Their potential will depend on various parameters such as heat production within the basement, thermal conductivity of sedimentary formations, and structural context. In this study, we aim at quantifying the importance of these parameters on temperature distribution at depth for a model representative of the St. Lawrence Lowlands, Québec, where locally anomalously higher heat flow has been observed and a 3D model of sedimentary cover is available. Scenarios involving physi-cal properties from neighbouring Grenvillian domains are considered:
Portneuf–Mau-ricie domain with radiogenic heat production of 0.94–5.83 µW m−3 , 0.02–4.13 µW m−3
for the Morin Terrane, and 0.34–1.96 µW m−3 for the Parc des Laurentides domain.
The impact of radiogenic heating on temperature distribution at depth was simulated using the Underworld2 numerical modeling code. Results show that at 5 km depth, the range of temperature difference is 22 °C for all modeled scenarios. In addition, the benefit of the thermal blanket effect of the sedimentary cover can be significant, but depends strongly on the contrast in thermal conductivity between the basement and the cover, as well as on the structural context, and less on heat production in the basement. Finally, depth of the 120 °C isotherm varies by up to 1 km for the scenarios considered; carefully assessing the boundary conditions therefore, appears critical in an exploration context.
Keywords: Deep geothermal potential, St. Lawrence Lowlands, Radiogenic Grenvillian
basement, Temperature distribution, Underworld2 numerical modeling
Open Access
© The Author(s) 2018. This article is distributed under the terms of the Creative Commons Attribution 4.0 International License (http://creat iveco mmons .org/licen ses/by/4.0/), which permits unrestricted use, distribution, and reproduction in any medium, provided you give appropriate credit to the original author(s) and the source, provide a link to the Creative Commons license, and indicate if changes were made.
RESEARCH
*Correspondence: [email protected]
1 Centre – Eau Terre
Environnement, Institut national de la recherche scientifique, 490 rue de la Couronne, Québec, QC G1K 9A9, Canada
Full list of author information is available at the end of the article
when there is a high heat-producing basement, e.g. granites rich in radiogenic ele-ments (Costain et al. 1980). The Cooper Basin in Australia is an example of such “Hot Dry Rock” geothermal exploration where high heat producing (3.8–8.7 µW m−3 ) base-ment granites, and thick sedibase-mentary rocks with low thermal conductivity act as a “ther-mal blanket”, give rise to temperature ano“ther-malies in the range of 240 °C at 3.5 km depth (Beardsmore 2005; Hillis et al. 2004; Horspool et al. 2012). There has, however, been lit-tle previous study of whether there is potential for “Hot Dry Rock” geothermal resources in eastern Canada.
In Canada, the utilization of geothermal energy has increased significantly during the last decade, although it is mainly limited to low enthalpy systems (Raymond et al. 2015; Thompson 2010). Compared to other countries, such as the USA, Indonesia, Philip-pines, Mexico, and New Zealand, the development and application of geothermal power in Canada lags because of the lack of federal and provincial support (Thompson et al. 2015). There is, however, great potential for developing geothermal power in western Canada, especially in British Columbia and SW Yukon (Grasby et al. 2012; Thompson et al. 2015) which are along the Pacific Ring of Fire. In contrast, the Canadian Shield of eastern Canada and the Appalachian orogen on its SE margin have an overall low heat flow of less than 60 mW m−2 (Drury et al. 1987; Fou 1969; Grasby et al. 2012; Jaupart et al. 1998; Majorowicz and Minea 2012; Mareschal et al. 2000; Misener et al. 1951; Pinet et al. 1991; Saull et al. 1962), making the utilization of geothermal power from deep geo-thermal resources less attractive.
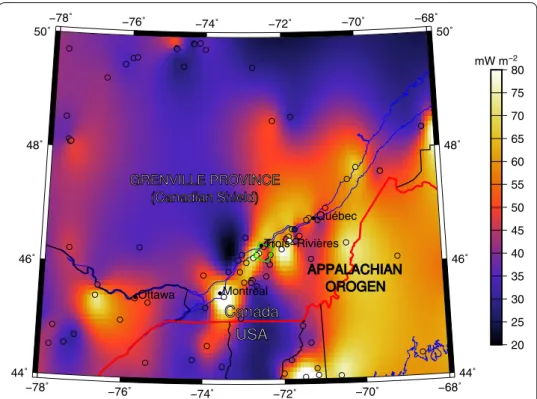
Grasby et al. (2012) concluded that there is little potential for high-temperature geo-thermal resources in the province of Québec because of the generally low heat gen-eration (0.7–0.8 µW m−3 ) and high thermal conductivity ( > 3 W m−1K−1 ) of the Precambrian basement rocks, resulting in low geothermal gradients. However, recent evaluations in parts of the St. Lawrence Lowlands have suggested differently, especially south of Montréal and Trois–Rivières, in the Gaspésie Peninsula, and on Anticosti Island (Majorowicz and Grasby 2010; Majorowicz and Minea 2012, 2013; Minea and Majorow-icz 2011, 2012; Perry et al. 2010; Raymond et al. 2012). The local elevated temperatures at depth suggested in these studies are likely due to the presence of radiogenic crystal-line gneissic basement. For example, in the N Appalachians ca. 230 km NE of Québec City, Gicquel et al. (2015) present a correlation between higher thermal maturation in Appalachian sedimentary rocks (calculated from vitrinite reflectance data,) where they overlie radiogenic migmatitic Grenvillian paragneisses interpreted from aeromagnetic data. Some basement granitoids or alkaline and carbonatite intrusions in the sedimen-tary cover (e.g., in Oka, Ford et al. 2001) may result in local, high radiogenic heat flow in St. Lawrence Lowlands, and N Appalachian orogen. Preliminary interpretations of aero-magnetic and gravity data suggest the possibility for lateral offset of Grenvillian base-ment rocks along ductile shear zones that parallel the St. Lawrence River (Gicquel et al. 2015); therefore, direct extrapolation of basement domains in the Grenville Province beneath the St. Lawrence Lowlands is not yet possible. Our research has focused on the general problem of whether radiogenic rocks in basement to the St. Lawrence Lowlands in the region south of Trois–Rivières (Fig. 1) may play a significant role in affecting the temperature distribution at depth and whether thermal modeling may help constrain the nature of basement in this area.
This area was selected, as it was the subject of prior research evaluating the potential for the CO2 storage in the St. Lawrence Lowlands in which petrophysical parameters of the sedimentary rocks were measured and present-day stress field calculated (Bédard et al. 2013b; Konstantinovskaya et al. 2012; Malo et al. 2014), and a 3D GOCAD model (Bédard et al. 2013a) and a structural interpretation of 2D seismic line M2002 (Castonguay et al. 2010) that crosses the area are available. Although a broad overview of depth to basement and main faults has been documented by Thériault et al. (2005), the detailed lithological composition of the Grenville Province basement underlying the Cambro-Ordovician plat-form sequence in this region is not well constrained.
A sensitivity study was undertaken using the Underworld2 geothermal modeling soft-ware (Mansour et al. 2018; Moresi et al. 2007; Quenette et al. 2015) on small scale 3D model, using the area S of Trois–Rivières as representing a geological setting typical of the St. Lawrence Lowlands to investigate the impacts of: (1) a homogeneous basement with properties representative of the different basement domains (each with different concen-trations of uranium, thorium, and potassium and variable thermal conductivity) that may occur beneath the Saint Lawrence Lowlands; (2) intrusions within basement; (3) the ther-mal blanket effect of sedimentary cover; and (4) boundary conditions, especially the tem-perature at the bottom boundary of the model.
Montréal Trois−Rivières Québec Ottawa 20 25 30 35 40 45 50 55 60 65 70 75 80 mW m−2 −78˚ −78˚ −76˚ −76˚ −74˚ −74˚ −72˚ −72˚ −70˚ −70˚ −68˚ −68˚ 44˚ 44˚ 46˚ 46˚ 48˚ 48˚ 50˚ 50˚
Fig. 1 Surface heat flow in southwestern Québec. Open circles show the data points of heat flow values based on Perry et al. (2010) and references therein; Bédard et al. (2016); SMU Geothermal Laboratory (2018); Jean-Claude Mareschal, pers. comm. Green box is the study area
Geological setting
St. Lawrence Lowlands
The St. Lawrence Lowlands in southern Québec is composed of Cambrian to Ordovi-cian sedimentary rocks that overly a Mesoproterozoic Grenvillian metamorphic and intrusive basement (geology of basement domains is discussed in the next section). The St. Lawrence Lowlands basin developed during the intracratonic rifting of the Rodinia supercontinent related to the opening of the Iapetus ocean during the Neo-proterozoic to Early Cambrian (Hersi et al. 2003; Tremblay et al. 2003). During the Cambrian to early Ordovician, it evolved into an oceanic basin (Kumarapeli 1985) characterized by a syn-rift and passive continental margin succession (Lavoie et al. 2014). During the Middle-to-Late Ordovician onset of Taconian thrusting in the ini-tial stage of Appalachian orogenesis, it evolved into a foreland basin characterized by the deposition of carbonates, shales, and clastic sequences (Bernstein 1991; Lavoie et al. 2009, 2014; Tremblay et al. 2003). Deposition in the St. Lawrence Lowlands ended following the emplacement of large ophiolitic nappes onto Laurentia and the accretion of volcanic arcs and continental blocks induced by the closure of the Iape-tus Ocean and convergence between Laurentia and Gondwana Taconian Orogeny (De Souza et al. 2014; Lavoie and Chi 2010; Rimando and Benn 2005; Rocher and Trem-blay 2001).
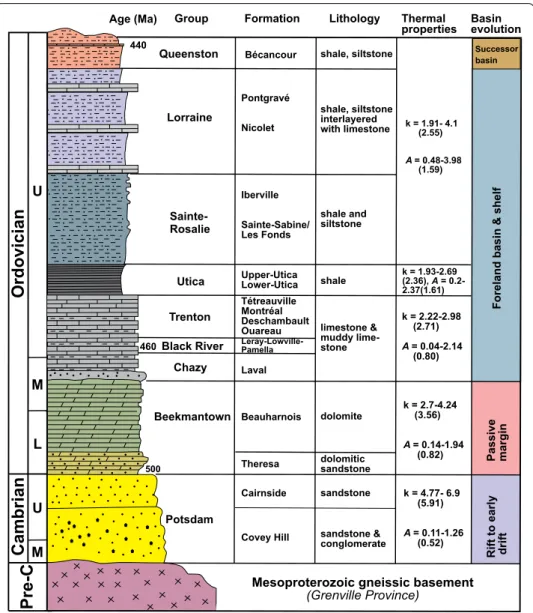
From bottom to top, the sedimentary sequence of the St. Lawrence Lowlands is: Potsdam (PO), Beekmantown (BK), Trenton–Black River–Chazy (Tr–BR–Ch), Utica and Sainte-Rosalie–Lorraine–Queenston (SR–LO–QT) groups which are mainly composed of sandstones, dolomites, limestone, shale, and siltstone, respectively (Clark 1972; Globensky 1987; Lavoie et al. 2009); see Figs. 2 and 3.
Densities and radiogenic element concentrations of rocks representative of the overlying sedimentary formations are listed in Table 1. Utica shales have the high-est concentrations of radiogenic elements, with uranium, thorium and potassium in the range of 2.59–3.41 ppm, 2.9–9.8 ppm, and 0.29–3.42%, respectively. Dolomites from the Beekmantown group also have high concentration of radiogenic elements. There is only one measurement for uranium and thorium in the uppermost cap rock (SR–LO–QT groups), which is relatively high but likely not representative. Thermal conductivities of the sedimentary rocks show that the sandstones of the Potsdam group have the highest values in the range 4.77–6.9 W m−1K−1 , followed by the dolo-mites of the Beekmantown group in the range of 2.7–4.24 W m−1K−1 while for other groups with an average value less than 3.0 W m−1K−1.
Grenvillian basement
The Grenville Province of western Québec is composed of high-grade metamorphic terranes accreted to the SE Laurentian margin (Davidson 1984; Dufréchou et al. 2014; Rivers 1997, 2015). Grenvillian rocks outcropping N of our study area comprise the generally N–S trending Portneuf–Mauricie and Parc des Laurentides domains on the E margin of the Mékinac–Taureau dome, along with an eastern extremity of the Morin terrane on the dome’s southern and eastern margins (Nadeau and Brouillette 1994, 1995; Nadeau et al. 2008; Sappin et al. 2009), as portrayed in Fig. 4.
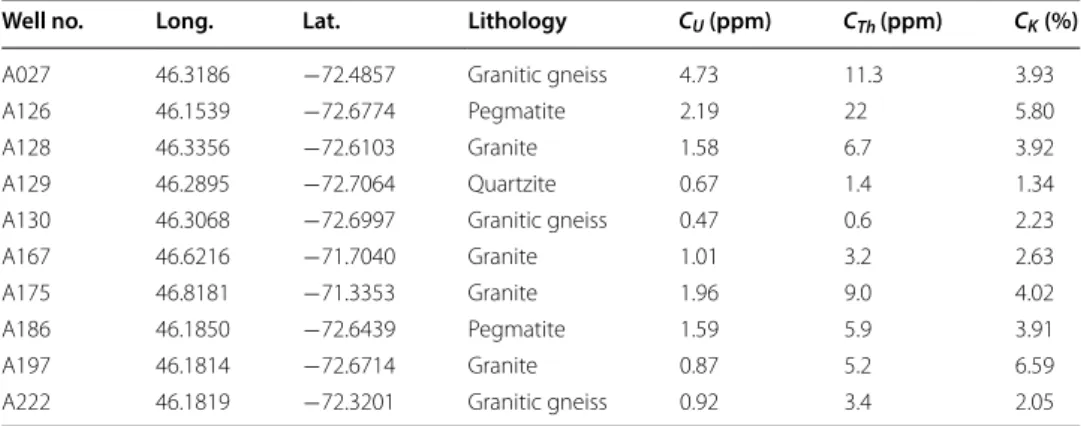
The concentration of uranium, thorium, and potassium of ten basement core samples of orthogneiss, granite ± pegmatite, and quartzite from wells located in or around the region of interest is in the range of 0.67–4.73 ppm, 0.6–22 ppm 1.34–5.8%, respectively (Table 2).
Portneuf–Mauricie (PM) domain
The Portneuf–Mauricie domain (PM) region comprises (1) metasedimentary and meta-volcanic rocks of the Montauban group, including amphibolite facies quartzofeldspathic gneiss, quartzite, marble, and calc-silicate rocks and andesitic to rhyolitic volcanics and (2) the La Bostonnais Complex plutons, including the de Lapeyrère and Gagnon
Potsdam Beekmantown Chazy Black River Trenton Utica Sainte-Rosalie Lorraine Queenston Covey Hill Cairnside Theresa Beauharnois Laval Leray-Lowville-Pamella Tétreauville Montréal Deschambault Ouareau Upper-Utica Lower-Utica Iberville Sainte-Sabine/ Les Fonds Pontgravé Nicolet Bécancour Group Formation
Cambrian
Ordovician
Pre-C
shale, siltstone shale, siltstone interlayered with limestone shale and siltstone shale limestone & muddy lime-stone dolomite dolomitic sandstone sandstone sandstone & conglomerate M U L M U Lithology Thermal properties k = 2.7-4.24 (3.56) A = 0.14-1.94 (0.82) k = 4.77- 6.9 (5.91) A = 0.11-1.26 (0.52) k = 2.22-2.98 (2.71) A = 0.04-2.14 (0.80) k = 1.93-2.69 (2.36), A = 0.2-2.37(1.61) k = 1.91- 4.1 (2.55) A = 0.48-3.98 (1.59)Rift to early drif
t Passive margin Foreland basi n & shel f
Mesoproterozoic gneissic basement
(Grenville Province) Basin evolution 500 Successor basin 440 Age (Ma) 460
Fig. 2 Stratigraphy of St. Lawrence Lowlands. Stratigraphy of St. Lawrence Lowlands, with lithology, thermal and reservoir properties (thermal conductivity k in W m−1K−1 and radiogenic heat production A in µW m−3 , values of the minimum, maximum and mean are in parentheses; Perm = permeability). Basin evolution is modified after (Comeau et al. 2012), combining data obtained from Bédard et al. (2016), Globensky (1987), Hersi et al. (2003), Hofmann (1972), Nasr (2016), Pinti et al. (2011), Rocher and Tremblay (2001)
gabbronorites, granite, quartz monzonite, quartz syenite, and pegmatite which contain high concentrations of K2O and Th (Corrigan 1995; Gautier 1993; Nadeau et al. 1992; Sappin 2012). Montauban group rocks are interpreted as part of a 1.45 Ga arc–back–arc complex into which the La Bostonnais complex plutons were intruded between 1.40 and 1.37 Ga after deformation and metamorphism of the Montauban group (Nadeau and van Breemen 1994; Sappin 2012; Sappin et al. 2009, 2014). Physical properties of Port-neuf–Mauricie domain rocks are listed in Table 3. There are limited thermal conductiv-ity data in the literature; therefore, five additional measurements were performed using a KD2 Pro probe and lab thermal properties analyzer.
Morin Terrain (MT) and Mékinac Taureau domain
The Morin Terrane in our study area (the Shawinigan domain of Corrigan and van Breemen (1997)) is characterized by Grenville Supergroup paragneisses and quartz-ite along with granitic and granodioritic gneiss and metavolcanics. The main area of exposure of the Morin Terrane W of our study area underwent regional ca. 1280 Ma deformation and metamorphism prior to diapiric emplacement of 1165–1135 Ma anorthosite–mangerite–charnockite–granite (AMCG) suite intrusions (Corri-gan and van Breemen 1997; Corriveau and van Breemen 2000; Emslie and Hunt 1990;
A185 A229 5 km A071 A025 A158 A070 1
two-way travel time (s)
2 3 4 Queenston Lorraine petroleum well fault unconformity Sainte-Rosalie Utica Chazy-Black River-Trenton
Beekmantown Potsdam Humber zone
Grenville basement
NW SE
Yamaska Fault
Chambly Fortierville Syncline Chaudière nappe
Fig. 3 Interpretation of seismic profile M2002. Interpretation of seismic profile M2002 crossing the modeled region (simplified from Castonguay et al. (2010). Bottom hole temperatures after Harrison correction in °C for wells A070, A229 and A185 are shown in the profile
Table 1 Density, concentration of radiogenic elements, and thermal conductivity of sedimentary rocks of the St. Lawrence Lowlands, with the minimum, maximum values and average in parentheses
Densities of sedimentary rocks are based on measurements of 32 samples by Nasr (2016); averages are in parenthesis. Radiogenic element data are from Owen and Greenough (2008), Pinti et al. (2011), Rivard et al. (2002), Vautour et al. (2015) as well as new ICP–MS and ICP–OES measurements. Thermal conductivity data of sedimentary rocks are from Nasr (2016) and Perozzi et al. (2016)
Groups ρr ( kg m−3) CU (ppm) CTh (ppm) CK (%) k ( W m−1K−1) SR–LO–QT siltstone 2540–2720 (2602) 3.1 10.2 0.05–0.8 (0.24) 1.91–4.1 (2.55) Utica shale 2700–2710 (2705) 2.59–3.41 (2.9) 2.9–9.8 (7.4) 0.29–3.42 (2.33) 1.93–2.46 (2.36) TR-BR-Ch limestone 2630–2700 (2680) 0.2–6.6 (1.6) 2.4–4.7 (3.55) 0.04–2.66 (0.67) 2.22–2.98 (2.71) Beekmantown dolomite 2640–2810 (2717) 0.07–3.08 (2.0) 3–14 (7.5) 0.19–6.26 (2.08) 2.7–4.24 (3.56) Potsdam sandstone 2540–2640 (2602) 0.4–0.45 (0.43) 1.38–1.4 (1.39) 0.05–2.3 (0.32) 4.77–6.9 (5.91)
Late Grenvillian sinistral shear zone
Boundary of the Portneuf-Mauricie Domain Lakes and Rivers
Thrust fault
Boundary of the Parc des Laurentides Domain Normal fault
Boundary of the Morin Terrane Montauban Saint-Prosper Faul t Deschambault Fault Saint-Maurice Rive r 10 km ’ ’ 47°50'’ 73°15'’ River Michaud-Simard mine Appalachian Province Logan ’s Line Saint-Didace 46°4' 46°4' 71°45'’ ’ St. Lawrence Lowlands
Saint Lawrence Lowlands
Potsdam sandstone Beekmantown dolomite
Trenton-Black River-Chazy carbonates Lorraine-Queenston-St. Rosalie silty shale & siltstone
Appalachian Province
Fm. Bulstrode & Melbourne Saint-Roch Group Sillery Group
Rivière Etchemin olistostrome Oak Hill & Caldwell Group Utica shale Lac Saint Pi erre Grenville Province 71°45' 73°15' Trois-Rivières MTD PDL MT Nicolet Victoriaville
Granite & monzonite of unknown age
Rivière-à-Pierre plutonic suite: porphyroid granite & monzonite Saint-Didace massif Lejeune plutonic suite: quartz-bearing metamonzonite Gabbro-gabbronorite
Morin Terrane (MT) (Shawinigan Domain) St. Boniface paragneiss
Unsubdivided gneiss
Mékinac-Taureau Domain (MTD) Unsubdivided granulite
Jimmy suite: Metagabbro & meta-anorthosite Portneuf-Mauricie (PM) Domain
La Bostonnais Complex: mainly granodiorite, monzodiorite, & diorite Unsubdivided gneiss
Parc des Laurentides Domain (PDL) Montauban Group
Amphibolite and meta-basalt Felsic meta-volcanite & meta-sediments Unsubdivided gneiss & orthogneiss
Gagnon plutonic suite: granite-quartzitic monzonite-quartzitic syenite & pegmatite
Jésuite complex: tonalitic orthogneiss
Migmatite Grenville Province Saint Shawinigan study area Lawrence PM ? ? ? 50km Montréal Québec Chicoutimi MLT SUPERIOR GRENVILLE APPALACHIANS MT PDL PM aer a pa m MTD AMCG
Fig. 4 Simplified regional geology. Geology of the Grenville Province is taken from Nadeau and Brouillette (1994, 1995); St. Lawrence Lowlands and Appalachian Province geology is from SIGÉOM (2018). Dashed maroon square indicates the study area. Inset map is modified after (Charlier et al. 2010)
Table 2 Concentration of radiogenic elements for basement rocks obtained from wells located south of Trois–Rivières from ICP–MS and ICP–OES analyses undertaken in our study
Well no. Long. Lat. Lithology CU (ppm) CTh (ppm) CK (%)
A027 46.3186 −72.4857 Granitic gneiss 4.73 11.3 3.93
A126 46.1539 −72.6774 Pegmatite 2.19 22 5.80
A128 46.3356 −72.6103 Granite 1.58 6.7 3.92
A129 46.2895 −72.7064 Quartzite 0.67 1.4 1.34
A130 46.3068 −72.6997 Granitic gneiss 0.47 0.6 2.23
A167 46.6216 −71.7040 Granite 1.01 3.2 2.63
A175 46.8181 −71.3353 Granite 1.96 9.0 4.02
A186 46.1850 −72.6439 Pegmatite 1.59 5.9 3.91
A197 46.1814 −72.6714 Granite 0.87 5.2 6.59
Martignole and Schrijver 1977). The domal structure of the Mékinac Taureau domain (Fig. 4), interpreted as being exhumed during crustal extension by Soucy La Roche et al. (2015), has subsequently been attributed from geophysical data to the pres-ence of an underlying, contemporaneous AMCG body by Dufréchou (2017), which our unpublished geophysical data support. Sinistrally oblique extension along the Tawachiche shear zone (TSZ) on the E margin of the Morin Terrane, marking the mapped contact with the Portneuf–Mauricie domain, occurred between 1065 and 1035 Ma (Soucy La Roche et al. 2015). The Shawinigan norite, the Lejeune complex and the St. Didace complex intrude Morin Terrane granulites on the S margin of the Mékinac–Taureau dome between 1080 and 1056 Ma (Nadeau et al. 2008; Nadeau and van Breemen 2001; Soucy La Roche 2014; Soucy La Roche et al. 2015).
Paradis (2004) presents density data for granite (2630–2710 kg m−3 , average = 2668.3), quartzite (2640–2730 kg m−3 , average = 2685), charnockite (2700–2750 kg m−3 , average = 2733), anorthosite (2670–2830 kg m−3 , average = 2726) and par-agneiss (2930–3100 kg m−3 , average = 2990); the overall bulk density of the Morin Terrane is in the range 2580–3350 kg m−3 , with an average of 2760 kg m−3 . Table 4 contains concentration of radiogenic elements data collected from the SIGÉOM (2018) and Mareschal (2018) databases, Mareschal and Jaupart (2013), Peck (2012), as well as field and laboratory measurements performed in this study. Radiogenic Table 3 Density, radiogenic element concentration and thermal conductivity data for rocks of the Portneuf–Mauricie domain
Data sources: densities are from Emslie and Ermanovics (1975), Feininger and Goodacre (1995), Kearey (1978), Paradis (2004). Radiogenic element concentration data are from 163 samples from the SIGÉOM (2018) database. Thermal conductivity data are from Mareschal (2018), Jessop et al. (2005). Average values are in parenthesis. Number of samples for radiogenic element concentration is given in parenthesis after rock type
Basement rock ρr ( kg m−3) CU (ppm) CTh (ppm) CK (%) k ( W m−1K−1) Amphibolite (12) 2860–3090 (3010) 0.5–3 (2.2) 3–6 (3.8) 0.19–0.92 (0.41) 2.27–2.32 (2.3) Basalt (3) – – 3 0.49–3.14 (1.47) 2.42–4.91 (3.32) Diorite (10) 2730–2970 (2840) 0.5–2.2 (1.33) 0.55–5.2 (4.08) 0.11–4.75 (1.64) 3.35–3.92 (3.64) Gabbro-gab-bronorite (21) 2600–3530 (2995) 0.05–0.6 (0.35) 0.2–3.6 (1.45) 0.1–2.32 (0.47) 1.84–4.72 (3.02) Granite (22) 2620–2760 (2670) 0.5–4.9 (1.41) 1.2–56 (6.18) 0.5–5.59 (3.6) 1.7–4.0 (2.76) Granitic gneiss (37) 2530–3160 (2650) 0–22 (3.33) 0.8–55.9 (9.35) 0.2–4.9 (2.12) 1.53–5.88 (2.24) Iherzolite (4) – 0.2 0.4–0.7 (0.55) 0.14–0.19 (0.17) – Migmatite (4) – 0.5–4.5 (1.85) 0.2–14.4 (5.18) 0.2–1.3 (1.0) – Pyroxenite (2) – 0–0.2 (0.1) 0–0.2 (0.1) 0.08–0.09 (0.085) – Paragneiss (46) 2580–3350 (2790) 0–3.9 (2.4) 0–14 (7.09) 0–3.73 (1.83) 1.53–5.88 (2.24) Pegmatite (2) 2470–2810 (2630) 640.4–1202 (921.2) 1141–1151 (1146) – 2.28–2.98 (2.46) Quartzite (5) 2580–3350 (2790) 3 3–11 (6.6) 0.48–1.73 (1.42) 6.08–6.38 (6.23) Quartz monzo-nite (9) 2600–2760 (2700) 0.5–1.8 (1.0) 3.0–3.2 (3.03) 1.48–4.52 (3.64) 3.35–3.92 (3.64) Websterite (3) – 0.05–0.2 (0.12) 0.05–0.7 (0.42) 0.11–0.54 (0.28) –
element concentrations are U = 0.01−4.5 (average = 1.67) ppm, in Th = 0.2−31 (average = 10.7) ppm and K = 0.01–7.91% (average: 2.43%). Thermal conductivities range between 2.36 and 4.58 W m−1K−1 , with an average value of 2.89 W m−1K−1 (Jessop et al. 2005). Additional measurements for nine samples obtained from the Shawinigan domain vary between 2.017 and 3.924 W m−1K−1 , with an average value of 2.648 W m−1K−1.
Parc des Laurentides domain
The Parc des Laurentides domain (PDLD) is mainly composed of the quartz–monzonite, porphyritic granite, mangeritic–charnockitic–granitic and granodioritic orthogneiss (Hébert and Nadeau 1995; Paradis 2004; Sappin 2012). Its western boundary separated from the Portneuf–Mauricie domain was obliterated by large granitic intrusions of the 1058 ± 1 Ma Rivière–à–Pierre suite (Hébert and Nadeau 1995).
The bulk density of the PDLD lies between 2575 and 2775 kg m−3 , with a mean den-sity of 2680 kg m−3 (Paradis 2004). The radioelement data for rocks from the Rivière–à– Pierre suite are shown in Table 5. Uranium, thorium, and potassium concentrations are Table 4 Concentration of radiogenic elements for outcropping rocks of the Morin Terrane (including samples from outside our study area)
Rock type CU (ppm) CTh (ppm) CK (%) Anorthosite (7) – – 0.07–1.0 Amphibolite (23) 0.2–17.7 1.7–35.1 0.9–4.5 Diorite (4) 1.7–4.5 3.6–38 1.8–5.0 Granite (7) 0.9–13.9 2.2–31 0.5–6.29 Granitic gneiss (36) 0.2–3.95 0.25–35.5 0.9–5.9 Granodiorite gneiss (4) 0.54–1.35 0.6–4.7 2.71–3.35 Mangerite (1) 0.5 0.2 0.36 Marble (20) 2.1–3.4 – 0.11–7.91 Mixed gneiss (91) 0–9.2 0.1–35.9 0–5.8 Pyroxenite (4) 0.5–3.4 – 0.01 Quartz-monzonite (1) 0.5 – 5.96 Quartzite (10) 1.7–2.4 – 0.05–0.22 Pegmatite (5) 0.3–59.3 11.2–421.5 2.8–7.1
Table 5 Concentration of radiogenic elements of rocks from Rivière–à-Pierre suite in the Parc des Laurentides domain Data sources: (SIGÉOM 2018; Higgins and van Breemen 1996) Rock type CU (ppm) CTh (ppm) CK (%) Amphibolite (1) 0.8 3 0.78 Charnockite (5) – – 2.94–4.25 Gabbro (2) 0.5–0.7 3 2.25–4.57 Granite (16) 0.5–1.9 2.2–14 1.37–5.48 Granitic gneiss (7) 0.5–1.8 3–4.1 0.99–3.87 Mangerite (5) 0.5–1.0 2.1–2.2 2.17–3.44 Quartz-monzonite (7) 0.5–1.2 3–10 4.23–5.14 Quartzite (1) 1.7 3 4.26 Bulk rock 0.5–1.9 (1.18) 2.1–14 (4.05) 0.78–5.48 (3.55)
0.5–1.9 ppm, 2.1–14 ppm, and 0.78–5.48%, respectively. The thermal conductivity of 3 samples obtained from the PDLD is in the range of 3.02–5.15 W m−1K−1 , with an aver-age value of 3.8 W m−1K−1 (Jessop et al. 2005).
Method
Model definition
In the absence of fluid flow, the heat equation with a radiogenic source term is (Jaupart and Mareschal 2011)
where T is temperature (°C), t is time (s), k is thermal conductivity ( W m−1K−1 ), ρ r is density ( kg m−3 ), Cp is specific heat ( J kg−1K−1 ) and A is heat production ( W m−3 ) calculated from the concentration of radiogenic elements. Symbol ∇· is the divergence operator and ∇T the temperature gradient. In the following, we assume a steady-state regime. The time-dependence term, therefore, vanishes, which yields
Heat production is considered using the following empirical function (Rybach 1976, 1988):
where Cu is the uranium content (ppm), CTh is the thorium content (ppm), and CK is the potassium content (%). Thermal conductivity is also assumed to be temperature depend-ent. The correction of Sekiguchi (1984) was used to take into account this dependence. According to Lee and Deming (1998), this correction is applicable to arbitrary rocks over the temperature range 0–300◦C . It is given by
where T is the in situ temperature (K), k0 is the thermal conductivity at laboratory tem-perature, T0 is the laboratory temperature (K), km and Tm are calibration coefficients, respectively, equal to 1.8418 W m−1K−1 and 1473 K.
The geothermal module of the 3D geodynamic modeling package Underworld2 (Man-sour et al. 2018; Moresi et al. 2007) was used to solve Eq. (2) numerically for tempera-ture distribution. Underworld2 includes a finite-element solver for Eulerian meshes that embed a set of Lagrangian integration points or particles. These particles allow storing material properties and can be moved to follow the deformations of geological materi-als, through the use of a particle-in-cell method, to map the finite-element integrals in the system. When solving the steady-state heat equation with the Underworld2 module, a standard Gaussian quadrature module is used in place of the particle-in-cell method because there is no deformation.
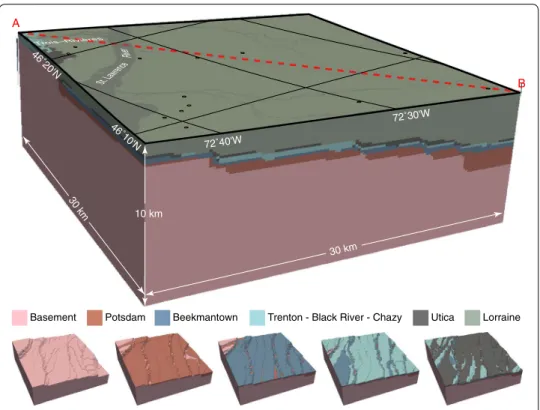
The area of interest is represented by a simplified 30 km × 30 km × 10 km geo-logical model representative of the sedimentary configuration of the St. Lawrence Lowlands south of Trois–Rivières (Fig. 1). This model was set up based on available seismic and well-log data and comprises the Grenvillian basement and the overlying
(1) ρrCp∂T ∂t = ∇ · (k ∇ T ) + A, (2) ∇ · (k ∇ T ) = −A. (3) A = ρr(9.52Cu+ 2.56CTh+ 3.48CK) × 10−5, (4) k = T0Tm Tm− T0 (k0− km) 1 T − 1 Tm + km,
Cambrian-Ordovician sedimentary sequence (see Fig. 5). To perform the sensitivity analysis, various structures are inserted in this model, as described below.
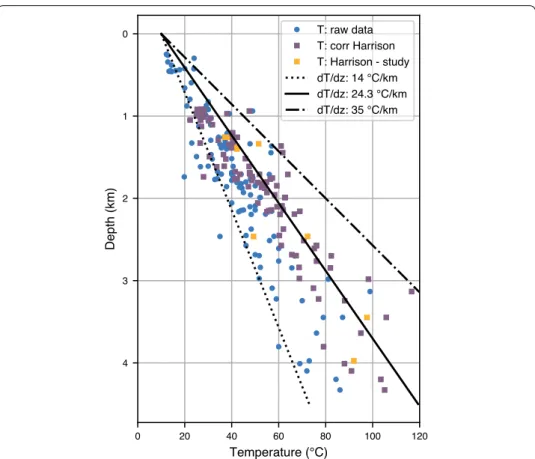
To perform the calculations, the model was discretized in 128 × 128 cells in the hori-zontal directions, and in 64 cells in the vertical direction. The bottom boundary condi-tion was established based on geothermal gradient data in the area as well as bottom hole temperature and surface heat flow data available inside the area of the model. For the St. Lawrence Lowlands, Bédard et al. (2016) found that the geothermal gradient is in the range of 14–35◦C km−1 , with an average of 24.3 ± 4.9◦C km−1 (Fig. 6). Within the model limits, 9 bottom hole temperature data are available and 15 heat flow meas-urements are found (Bédard et al. 2016). For each modeled scenarios described below, a series of modeling runs were done with heat flow imposed at the bottom boundary, with values ranging from 50 to 66 mW m−2 . The value that yielded a temperature dis-tribution giving the best fit with the 24.3◦C gradient, the bottom hole temperature data and the surface heat flow data was selected. The fit is defined as the sum of the Relative Root Mean Square Error (rRMSE) of all three variables, with a lower weight (1/2) given to the rRMSE of the gradient because it was obtained with data outside the modeling domain. In all cases, the temperature at the top boundary is specified to be 10 °C and no-flow Neumann conditions are applied on the sides. Physical properties of the litho-logical units have been assigned based on the data presented in the geology section. Due to the size of the cells in the numerical mesh, the lithology of each formation must be simplified. Therefore, the main lithology of the Potsdam Group is sandstone, dolomite for the Beekmantown Group, limestone for the Trenton–Black River–Chazy Groups
10 km
30 km
30 km
Basement Potsdam Beekmantown Trenton - Black River - Chazy Utica Lorraine A B 72˚40'W 72˚30'W 46˚10' N 46˚20'N
Fig. 5 3D views of the geological model. 3D views of the geological model in the selected region after discretization. The red dashed line represents the location of profile A–B that crosses the model from shallower (A) to deeper basement (B)
(or TR–BR–Ch), shale for the Utica Group, siltstone for the top three groups of Sainte– Rosalie, Lorraine and Queenston (i.e. SR–LO–QT), respectively. For Precambrian base-ment, the influence of various rock types will be studied, as described next.
Modeled scenarios
In the study area, the basement is buried by a sedimentary cover varying in thickness between 0.5 and 6.5 km (see Fig. 3). As previously mentioned, a detailed interpreta-tion of the basement structure is not possible due to scarcity of available data. There-fore, we begin with a simple homogeneous basement with thermal properties obtained from rocks outcropping in the Portneuf–Mauricie domain, which will be referred to as the base case in the simulation study. In the five scenarios presented in this paper, only differences in basement characteristics are considered. For four of the five scenarios, a homogeneous basement is considered, with input data summarized in Table 6. Each sce-nario is described in more detail below.
Model 1: PM domain basement
From data listed in Table 3, using Rybach’s empirical function (Eq. 3), heat production in the basement is equal to 0.94 µW m−3 . For this model, a heat flow value of 59 mW m−2
Fig. 6 Temperature–depth relationship. Temperature–depth relationship based on 124 bottom hole temperature data (Bédard et al. 2016) from petroleum wells located in the St. Lawrence Lowlands. The yellow squares are the temperature data after Harrison correction in the modeled region of this paper
at the bottom boundary gave the best fit to the data, with the sum of rRMSE equal to 36%.
Model 2: Morin Terrane basement
Based on data in Table 4, the calculated heat production for the Morin Terrane is 1.42 µW m−3 . In this case, a bottom boundary condition of 52 mW m−2 was obtained (sum of rRMSE equal to 35%).
Model 3: Parc des Laurentides domain basement
An average heat production value of 0.91 µW m−3 is obtained using the empirical func-tion of Rybach (1988). In this model, the mean concentration of uranium, thorium, and potassium is, respectively, 1.18 ppm, 4.05 ppm and 3.55%. Heat flow at the bottom boundary is in this case 62 mW m−2 (sum of rRMSE equal to 39%).
Model 4: basement based on well data
The parameters of the fourth model are computed from measurements taken on 10 sam-ples obtained from cores collected from wells in the modeled region (Table 2) for which the average bulk density is 2598 kg m−3 (Nasr 2016). With the values given in Table 2 for this model, the heat production is 1.18 µW m−3 . For this model, 53 mW m−2 at the bot-tom boundary gave the best fit to the data (sum of rRMSE equal to 37%).
Models 5 and 6: intrusions in the basement
Two models are used to evaluate the influence of a relatively “hot” intrusion on tem-perature distribution. The shape of the intrusion is arbitrarily set to a vertical cylinder that crosses the basement in the center of the model. The top of the intrusion is set at 2.4 km, at the interface between the basement and the Potsdam sandstones. In the first model, the radius of the intrusion is 1 km and its volume is approximately 2.5 × 10¹⁰m3 , whereas in the second case the radius is 2 km, for a volume of 9.5 × 10¹⁰m3 . Physical properties of the model unit parameters are given in Table 7. The radiogenic element concentrations for the host rock are assumed to be the same as in Model 1. For the intru-sion, properties of granites of the Gagnon pluton (Fig. 4) are used. The bottom boundary condition is the same as for Model 1.
Table 6 Physical properties of Grenvillian rocks in the PM domain (Model 1), Shawinigan domain (Model 2), PDLD (Model 3) and from well cores (Model 4); average values in parentheses Basement ρr ( kg m−3) CU (ppm) CTh (ppm) CK (%) A ( µW m−3) k ( W m−1K−1) Model 1 2620–3050 0.05–6.0 0.5–56 0.05–5.59 0.94 2.39–3.87 (2790) (1.61) (4.65) (1.64) (3.0) Model 2 2580–3350 0–17.7 0–68.1 0.01–7.91 1.42 2.02–3.92 (2760) (1.91) (10.38) (2.92) (2.65) Model 3 2575–2775 0.5–1.9 2.1–14 0.78–5.48 0.91 3.02–5.15 (2680) (1.18) (4.05) (3.55) (3.8) Model 4 2580–2620 0.67–4.73 0.6–22 1.34–5.8 1.18 2.26–2.71 (2598) (1.60) (6.87) (3.64) (2.54)
Results and discussion
Homogeneous basement
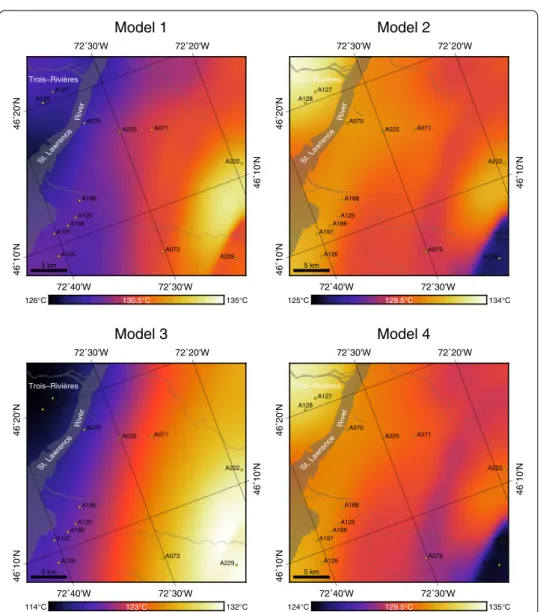
Figure 7 shows the temperature at 5 km for the different homogeneous basement mod-els. The first observable trend is the relative temperature in the Trois–Rivières vicin-ity (where basement rocks are predominent), which is colder for Models 1 and 3, and warmer for Models 2 and 4, this for lower heat production in Models 1 and 3 but for lower heat flow at the bottom for Models 2 and 4. Thus, not surprisingly, the effect of Table 7 Parameters used for the heterogeneous basement model
Unit CU (ppm) CTh (ppm) CK (%) k ( W m−1K−1) A ( µW m−3) Host rock 1.61 4.65 1.64 3.0 0.94 Intrusion 4.9 56 5.59 2.24 5.53 126°C 130.5°C 135°C 5 km St. Lawrenc e River Trois−Rivières A025 A070 A071 A073 A125 A126 A127 A186 A188 A197 A128 A222 A229 Model 1 72˚40'W 72˚30'W 72˚30'W 72˚20'W 46˚10'N 46˚10'N 46˚20'N 125°C 129.5°C 134°C 5 km St. Lawre nce Riv er Trois−Rivières A025 A070 A071 A073 A125 A126 A127 A186 A188 A197 A128 A222 A229 Model 2 72˚40'W 72˚30'W 72˚30'W 72˚20'W 46˚10'N 46˚10'N 46˚20'N 114°C 123°C 132°C 5 km St. La wrenc e River Trois−Rivières A025 A070 A071 A073 A125 A126 A127 A186 A188 A197 A128 A222 A229 Model 3 72˚40'W 72˚30'W 72˚30'W 72˚20'W 46˚10'N 46˚10'N 46˚20'N 124°C 129.5°C 135°C 5 km St. Lawrenc e Riv er Trois−Rivières A025 A070 A071 A073 A125 A126 A127 A186 A188 A197 A128 A222 A229 Model 4 72˚40'W 72˚30'W 72˚30'W 72˚20'W 46˚10'N 46˚10'N 46˚20'N
heat production is counterbalanced by heat flow at the bottom boundary: models with high heat production have a better fit to the available data with lower heat flow at the bottom. On the other hand, Models 1 and 4 have the highest temperature, followed by Model 2 and Model 3. This might appear surprising, because basement rocks in Model 2 have the highest value of heat production and Model 3 the highest value of heat flow at the bottom boundary. However, Model 2 also has the second lowest thermal conductiv-ity and Model 3 has the highest thermal conductivconductiv-ity (respectively, 3 and 3.8 W m−1K−1 for Models 1 and 3 vs 2.7 and 2.5 W m−1K−1 for Models 2 and 4). These observations thus show that the thermal conductivity of the basement rocks has a significant impact on temperature distribution, regardless of heat production. It is, therefore, equally important to accurately determine both parameters to correctly assess the geothermal potential of a given area.
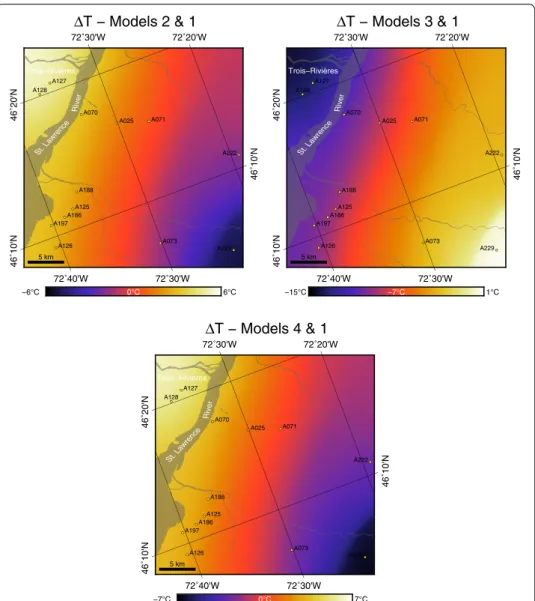
The difference between Models 2–4 and Model 1 at 5 km depth is shown in Fig. 8. The maximum difference with Model 1 is 15◦C (Model 3), with a range of 22◦C (−15 to
−6°C 0°C 6°C 5 km St. Lawrence Rive r Trois−Rivières A025 A070 A071 A073 A125 A126 A127 A186 A188 A197 A128 A222 A229 ∆T − Models 2 & 1 72˚40'W 72˚30'W 72˚30'W 72˚20'W 46˚10'N 46˚10'N 46˚20'N −15°C −7°C 1°C 5 km St. La wrenc e River Trois−Rivières A025 A070 A071 A073 A125 A126 A127 A186 A188 A197 A128 A222 A229 ∆T − Models 3 & 1 72˚40'W 72˚30'W 72˚30'W 72˚20'W 46˚10'N 46˚10'N 46˚20'N −7°C 0°C 7°C 5 km St. Lawr ence Rive r Trois−Rivières A025 A070 A071 A073 A125 A126 A127 A186 A188 A197 A128 A222 A229 ∆T − Models 4 & 1 72˚40'W 72˚30'W 72˚30'W 72˚20'W 46˚10'N 46˚10'N 46˚20'N
7◦C ) if all scenarios are considered. Such a difference is important in the context of elec-tricity production, because it can imply drilling deeper than expected may be required to meet specific temperature requirements.
Effect of an intrusion in the basement
As shown in Figs. 9 and 10, the influence of a relatively hot intrusion is rather limited, both spatially and in terms of temperature increase. For the smaller intrusion, the tem-perature increase at 5 km depth is only 3◦C . Moreover, although the larger intrusion is four times bigger than the smaller, the temperature increase is only 6◦C . In Addition,
126°C 130.5°C 135°C 5 km St. Lawrenc e River Trois−Rivières A025 A070 A071 A073 A125 A126 A127 A186 A188 A197 A128 A222 A229 Model 5 72˚40'W 72˚30'W 72˚30'W 72˚20'W 46˚10'N 46˚10'N 46˚20'N 127°C 131.5°C 136°C 5 km St. Lawrenc e Riv er Trois−Rivières A025 A070 A071 A073 A125 A126 A127 A186 A188 A197 A128 A222 A229 Model 6 72˚40'W 72˚30'W 72˚30'W 72˚20'W 46˚10'N 46˚10'N 46˚20'N
Fig. 9 Temperature distribution at 5 km for models with intrusions. Temperature distribution at 5 km for models with a 1 km radius vertical intrusion (left) and 2 km radius vertical intrusion (right) in the basement. Green circles are the surface projection of the vertical intrusion
1.5°C St. Lawrenc e Rive r Trois−Rivières 3°C St. Lawrence Rive r Trois−Rivières 0°C 3°C 5 km A025 A070 A071 A073 A125 A126 A127 A186 A188 A197 A128 A222 A229 ∆T − Models 5 & 1 72˚40'W 72˚30'W 72˚30'W 72˚20'W 46˚10'N 46˚10'N 46˚20'N 0°C 6°C 5 km A025 A070 A071 A073 A125 A126 A127 A186 A188 A197 A128 A222 A229 ∆T − Models 6 & 1 72˚40'W 72˚30'W 72˚30'W 72˚20'W 46˚10'N 46˚10'N 46˚20'N
Fig. 10 Temperature difference between Models 5–6 and Model 1. Temperature difference between Models 5–6 and Model 1 at 5 km depth. Green circles are projection of the intrusion
the spatial extent of the anomaly is mostly limited to the location of the intrusion. It thus appears that “hot” intrusions are of limited interest as geothermal exploration targets. Effect of bottom boundary condition
At this point in the study, we examine the choice of the bottom boundary condition. In addition to the basement parameters, the boundary condition obviously plays a sig-nificant role in affecting the temperature distribution at depth, but to what quantitative extent? Figure 11 shows the 120◦C and 150◦C isotherms as function of depth for Model 1 (thick lines) and the range of depths for all models (shaded areas). There is a significant difference in isotherm depth between the difference models, with up to a km in depth difference in the northern part. In a given geothermal project, a poor estimation of this boundary condition would likely have dramatic impact on drilling costs.
Figure 12 shows a comparison between the simulated temperature for Model 1 under different bottom boundary conditions, with the measured temperature obtained from the drill stem tests in wells A126, A188, A197 and A222. This figure also indicates that the choice of the boundary condition value has a strong influence on the modeled tem-peratures at depth. This emphasizes the importance of having high quality data to cali-brate the model.
“Thermal blanket” effect of the sedimentary rocks
Because sedimentary rocks usually have a relatively low thermal conductivity, they behave as a “thermal blanket”, preserving the heat in the rocks at depth (Beardsmore 2005). We examine this effect taking Models 1, 2 and 3 as examples. Figure 13 shows temperature profiles at three virtual wells located along profile AB, as illustrated in Figs. 5 and 11. Figure 13 shows that the temperature gradient in the sedimentary rocks is stronger than in the basement for Models 1 and 3, and especially for Model 3 in which the thermal conductivity of the basement is relatively higher. The opposite can be observed for Model 2, which has the lowest thermal conductivity but the highest heat
A
PW−1 PW−2 PW−3B
0 2 4 6 8 10Depth (km)
0 10 20 30 40Distance (km)
120 °C isotherm 150 °C isothermFig. 11 Depth of 120 °C and 150 °C isotherms along profile A–B. Depth of 120 °C and 150 °C isotherms along profile A–B for the modeled scenarios. Lines are isotherm for Model 1 and light shadow areas indicate the min–max range given by Models 2, 3, and 4. The black dashed line is the depth to basement profile and PW-1, PW-2, and PW-3 are virtual wells used below
production. Thus, the thermal blanket effect is strongly controlled by the contrast in thermal conductivity. The inflection point varies in depth depending on thickness of the sedimentary cover, with an advantage at well PW-3. However, although the difference in sedimentary cover thickness is almost 4000 m between PW-1 and PW-3, the difference in inflection point depth is about 1500 m, i.e., the so-called blanket effect is not as strong as might be expected at first. This can be attributed to the fact that the topography of the basement is irregular, with a large “step” not far from well PW-3 (see Fig. 11, and that lateral effects influence the thermal response. Through this case study, it appears that the benefit of the insulating effect of the sedimentary cover can be significant, but that it
Fig. 12 Temperature profiles in wells. Temperature profiles in wells A126, A188, A197, and A222 for different heat flow conditions at the bottom boundary of Model 1 (dashed line indicates basement depth; red solid circles represent temperature after Harrison’s correction)
strongly depends on the contrast in thermal conductivity between the basement and the cover, as well as on the structural context.
Surface heat flow
Surface heat flow values computed from borehole data in the study area are given by Bédard et al. (2016). These data are compared with vertical heat flow computed from the results of the modeling with Underworld2. Figure 14 shows maps of surface heat flow for the six modeled scenarios, together with 18 data points from Bédard et al. (2016). The general agreement is best for the model with a basement representative of the Parc des Laurentides domain (Model 3), followed by models corresponding to the Portneuf– Mauricie domain (Models 1, 5, and 6). More specifically, the rRMSE between data points from Bédard et al. (2016) and modeled surface heat flow is 13% for Model 1, 15% for Model 2, 11% for Model 3, 17% for Model 4, 13% for Model 5 and 13% for Model 6. These results should, however, be considered carefully, as the average of the borehole data ( 76 mW m−2 ) is much higher than the interpolated value that can be seen in the map of Fig. 1 ( ≈ 55 mW m−2 ), and Model 3 also has the worst rRMSE fit with the bot-tom hole temperature and regional gradient.
Comparisons between Model 6 and Model 1 reveal that, although the top of the large intrusion is 2.4 km below the surface, it produces sufficient heat to alter the temperature gradient up to the surface, and thus affects the heat flow at the surface. It is interesting to note, however, that the heat flow is lower for Model 6, which is counterintuitive. It is found that the presence of the intrusion slightly decreases the temperature gradient in the sedimentary cover, and thus decreases the heat flow at the surface, as shown in Fig. 15. Interpretation of temperature at depth from surface heat flow data is, therefore, a delicate matter.
Fig. 13 Temperature changes along three vertical profiles. Temperature changes along three vertical profiles in Fig. 11 showing the thermal blanket effect of the sedimentary rocks (the sedimentary cover is thinnest at PW-1 and thickest at PW-3). Dashed lines show a 24.3◦C/km gradient
60 70 80 mW/m2 5 km St. Lawrence River Trois−Rivières A025 A070 A071 A073 A125 A126 A127 A186 A188 A197 A128 A222 A229 Model 1 72˚40'W 72˚30'W 72˚30'W 72˚20'W 46˚10'N 46˚10'N 46˚20'N 60 70 80 mW/m2 5 km St. Lawren ce River Trois−Rivières A025 A070 A071 A073 A125 A126 A127 A186 A188 A197 A128 A222 A229 Model 2 72˚40'W 72˚30'W 72˚30'W 72˚20'W 46˚10'N 46˚10'N 46˚20'N 60 70 80 mW/m2 5 km St. Lawrence Rive r Trois−Rivières A025 A070 A071 A073 A125 A126 A127 A186 A188 A197 A128 A222 A229 Model 3 72˚40'W 72˚30'W 72˚30'W 72˚20'W 46˚10'N 46˚10'N 46˚20'N 60 70 80 mW/m2 5 km St. Lawrence Riv er Trois−Rivières A025 A070 A071 A073 A125 A126 A127 A186 A188 A197 A128 A222 A229 Model 4 72˚40'W 72˚30'W 72˚30'W 72˚20'W 46˚10'N 46˚10'N 46˚20'N 60 70 80 mW/m2 5 km St. Lawren ce Rive r Trois−Rivières A025 A070 A071 A073 A125 A126 A127 A186 A188 A197 A128 A222 A229 Model 5 72˚40'W 72˚30'W 72˚30'W 72˚20'W 46˚10'N 46˚10'N 46˚20'N 60 70 80 mW/m2 5 km St. La wrence River Trois−Rivières A025 A070 A071 A073 A125 A126 A127 A186 A188 A197 A128 A222 A229 Model 6 72˚40'W 72˚30'W 72˚30'W 72˚20'W 46˚10'N 46˚10'N 46˚20'N
Conclusions
The main conclusions that can be drawn from this study are:
1 Statistical analysis of radiogenic element concentrations suggests that the radiogenic heat production south of Trois–Rivières is in the range of 0.34–3.24 µW m−3 , 0.94– 5.83 µW m−3 for the Portneuf–Mauricie domain, 0.02–4.13 µW m−3 for the Morin Terrane, especially its Shawinigan domain, 0.34–1.96 µW m−3 for the Parc des Lau-rentides domain.
2 The distribution of temperature is affected by many factors, e.g., thermal conductiv-ity, densconductiv-ity, and concentration of radioelements in sedimentary rocks and basement, thickness of sedimentary cover, and structural context. For the modeled scenarios, temperature is highest in Models 1 and 4 (respectively, PM and well data basement), because it has the highest thermal conductivity, followed by Model 2 (Morin Ter-rane) and by Model 3 (PDLD basement). At a depth of 5 km, the maximum differ-ence with Model 1 is 15◦C (with Model 3), and the range of difference is 22◦C (−15 to 7◦C ) if all scenarios are considered.
3 Thick Cambro-Ordovician sedimentary rocks in this region may limit heat loss to the surface by virtue of the so-called “thermal blanket” effect. The benefit of this insulat-ing effect can be significant, but it strongly depends on the contrast in thermal con-ductivity between the basement and the cover, as well as on the structural context, and less on heat production in the basement.
4 The boundary condition value imposed at the bottom boundary of the model plays a significant role in controlling the distribution of temperature. Depending on base-ment rock parameters, values in the range [52–62] mW m−2 yield comparable fit to the regional temperature gradient, bottom hole temperature data and surface heat
flow data. Moreover, heat production values in the models are counterbalanced by heat flow at the bottom boundary.
5 The effect of hot intrusions in the basement is relatively modest and localized in terms of temperature increase. The presence of intrusions underneath the sedimen-tary cover may also decrease the heat flow at the surface, and caution should be taken when using surface heat flow as an exploration variable.
The sensitivity of model outcomes to small changes in input parameters shows that bet-ter constrained input paramebet-ters are required to establish with certainty the nature of basement to our study area. Computed and measured heat flow models for Portneuf– Mauricie domain basement beneath our study area are, however, compatible with the results of preliminary geophysical interpretations that ca. 35 km dextral transcurrent displacement may have occurred on late Grenvillian ductile shear zones beneath the northern St. Lawrence platform (Gicquel, unpublished data; Gicquel et al. 2015). Model results can, nevertheless, be applied to adjacent areas where the nature of basement domains is better defined.
A limitation of the present study lies in the assumption that, except for the models with intrusions, the basement is homogeneous. The input parameters, e.g., concentra-tion of radiogenic elements, thermal conductivity, and density, used in these simulaconcentra-tion models are derived from measurements made on different types of rocks, both from the St. Lawrence Lowlands and the geological domains surrounding the city of Trois–Riv-ières, and exhibit a broad range of values. Besides this, some parameters are poorly con-strained due to the limited number of available data. Therefore, the selected scenarios do not encapsulate the variability that is likely encountered in reality. For this reason, work is underway to generate models with stochastic distributions of physical properties that are representative of the spatial variability observed in the outcropping rocks for the different domains considered in the study. This will in turn allows establishing ranges of possible temperatures at depth for the different scenarios.
Abbreviations
AMCG: anorthosite–mangerite–charnockite–granite; BK: Beekmantown; MT: Morin Terrane; PDLD: Parc des Laurentides domain; PM: Portneuf–Mauricie; PO: Potsdam; SR–LO–QT: Sainte–Rosalie–Lorraine–Queenston; Tr–BR–Ch: Trenton–Black River–Chazy; TSZ: Tawachiche shear zone.
Authors’ contributions
HL gathered data, prepared the model, ran Underworld2 simulations and wrote the first draft of the manuscript. BG reviewed the model and the numerical simulations, ran additionnal Underworld2 simulations, and revised the manu-script. LBH reviewed the manuscript and completed the section on Geological setting. SMQ and JM contributed to the elaboration of the numerical model. All authors read and approved the final manuscript.
Author details
1 Centre – Eau Terre Environnement, Institut national de la recherche scientifique, 490 rue de la Couronne, Québec, QC
G1K 9A9, Canada. 2 State Key Laboratory of Geomechanics and Geotechnical Engineering, Institute of Rock and Soil
Mechanics, Chinese Academy of Sciences, Wuhan 430071, China. 3 Monash eResearch Centre, Monash University,
Clay-ton, VIC 3800, Australia. 4 School of Mathematical Sciences, Monash University, Clayton, VIC 3800, Australia. Acknowledgements
We would like to thank the reviewers for their constructive comments. We would also like to show our appreciation to Jean-Claude Mareschal at the Université du Québec à Montréal, Karine Bédard, Aurélie Gicquel, Félix-Antoine Comeau, Jasmin Raymond, Emmanuelle Millet, Maher Nasr, and Jean-Philippe Drolet from INRS-ETE. Vasile Minea from Hydro-Québec gave us much help with the collection of basic geothermal data, and Jennifer Levett from Mira Geoscience Ltd. of Montréal gave us invaluable help in technical support of GOCAD software, to Louis Moresi, Fabio Capitanio, Julian Giordani, Jerico Revote, Owen Kaluza and Ben Mather for their guidance in using the Underworld2 software. We also give our thanks to Adrien Bouffard at the Ministère de l’Énergie et des Ressources naturelles (MERN) who helped in collecting the basement rock samples.
Competing interests
The authors declare that they have no competing interests.
Availability of data and materials
The datasets used and/or analysed during the current study are available from the corresponding author on reasonable request.
Funding
Research was funded by the Natural Sciences and Engineering Research Council of Canada and IREQ/Hydro Québec (Grant RDCPJ 451432-13).
Publisher’s Note
Springer Nature remains neutral with regard to jurisdictional claims in published maps and institutional affiliations. Received: 12 July 2018 Accepted: 15 December 2018
References
Beardsmore GR. Thermal modeling of the Hot Dry Rock geothermal resource beneath GEL99 in the Cooper Basin, South Australia. In: World Geothermal Congress 2005. 2005. http://www.geoth ermal -energ y.org/pdf/IGAst andar d/ WGC/2005/1634.pdf. Accessed 22 Dec 2018.
Bédard K, Comeau F-A, Malo M. Modélisation géologique 3D du basin des Basses-Terres du Saint-Laurent. Research Report INRSCO2-2013-V1.5, Institut national de la recherche scientifique. 2013. http://espac e.inrs.ca/1643/1/R0014 39.pdf. Accessed 22 Dec 2018.
Bédard K, Comeau F-A, Millet E, Raymond J, Malo M, Gloaguen E. Évaluation des ressources géothermiques du bassin des Basses-Terres du Saint-Laurent. Research Report INRS-1659, Institut national de la recherche scientifique. 2016.
http://espac e.inrs.ca/4845/1/R0016 59.pdf. Accessed 22 Dec 2018.
Bédard K, Malo M, Comeau F-A. CO2 geological storage in the province of Québec, Canada. Capacity evaluation of the St.
Lawrence Lowlands basin. Energy Procedia. 2013;37:5093–100.
Bernstein L. The Lower Ordovician Beekmantown Group, Québec and Ontario. Ph.D. thesis, Université de Montréal, Montréal. Canada. 1991.
Capuno VT, Maria RBS, Minguez EB. Tiwi geothermal field, Philippines: 30 years of commercial operation. In: Proceedings World Geothermal Congress 2010, Bali, Indonesia. 2010.
Castonguay S, Dietrich J, Lavoie D, Laliberte JY. Structure and petroleum plays of the St. Lawrence Platform and Appa-lachians in southern Quebec: insights from interpretation of MRNQ seismic reflection data. Bull Can Petrol Geol. 2010;58(3):219–34.
Charlier B, Namur O, Malpas S, de Marneffe C, Duchesne JC, Vander Auwera J, Bolle O. Origin of the giant Allard Lake ilmenite ore deposit (Canada) by fractional crystallization, multiple magma pulses and mixing. Lithos. 2010;117(1–4):119–34.
Clark TH. Région de Montréal area. Geological Report RG-152, Ministère des Richesses Naturelles, Québec. 1972. Comeau F-A, Bédard K, Malo M. Les régions de Nicolet et de Villeroy: état des connaissances pour le stockage géologique
du CO2 . Research Report R1332, INRS-ETE. 2012. http://espac e.inrs.ca/532/1/R0013 32.pdf. Accessed 22 Dec 2018.
Corrigan D. Mesoproterozoic evolution of the south-central Grenville orogen: structural, metamorphic, and geochrono-logic constraints from the Mauricie transect. Ph.D. thesis, Carleton University; 1995. https ://curve .carle ton.ca/df84d eaf-2f8e-4ba2-9c7e-58c98 d5faff 6. Accessed 22 Dec 2018.
Corrigan D, van Breemen O. U-Pb age constraints for the lithotectonic evolution of the Grenville province along the Mauricie transect, Quebec. Can J Earth Sci. 1997;34(3):299–316.
Corriveau L, van Breemen O. Docking of the Central Metasedimentary Belt to Laurentia in geon 12: evidence from the 1.17-1.16 Ga Chevreuil intrusive suite and host gneisses, Quebec. Can J Earth Sci. 2000;37(2):253–69.
Costain JK, Glover L, Sinha AK. Low-temperature geothermal resources in the eastern United-States. Eos Trans Am Geo-phys Union. 1980;61(1):1–3.
Davidson A. Identification of ductile shear zones in the south-western Grenville Province of the Canadian Shield. In: Kroner A, Greiling R, editors. Precambrian Tectonics Illustrated. Stuttgart: Schweizerbart’sche Verlagsbuchhandlung; 1984. p. 263–79.
De Souza S, Tremblay A, Ruffet G. Taconian orogenesis, sedimentation and magmatism in the southern Quebec-northern Vermont Appalachians: Stratigraphic and detrital mineral record of Iapetan suturing. Am J Sci. 2014;314(7):1065–103.
Drury MJ, Jessop AM, Lewis TJ. The thermal nature of the Canadian Appalachian crust. Tectonophysics. 1987;133:1–14. Dufréchou G. Aeromagnetic signature of an exhumed double dome system in the sw Grenville Province (Canada). Terra
Nova. 2017;29(6):363–71.
Dufréchou G, Harris LB, Corriveau L. Tectonic reactivation of transverse basement structures in the Grenville orogen of SW Quebec, Canada: insights from gravity and aeromagnetic data. Precambrian Res. 2014;241:61–84.
Emslie RF, Ermanovics IF. Major rock units of the Morin Complex, southwestern Quebec. Paper 74–48, Geological Survey of Canada. 1975. https ://doi.org/10.4095/10255 5
Emslie RF, Hunt PA. Ages and petrogenetic significance of igneous mangerite-charnockite suites associated with massif anorthosites, Grenville Province. J Geol. 1990;98(2):213–31.
Feininger T, Goodacre AK. The eight classical Monteregian hills at depth and the mechanism of their intrusion. Can J Earth Sci. 1995;32(9):1350–64.
Ford KL, Savard M, Dessau J-C, Pellerin E, Charbonneau BW, Shives BK. The role of gamma-ray spectrometry in radon risk evaluation: a case history from Oka, Quebec. Geosci Can. 2001;28(2):59–64.
Fou JTK. Thermal conductivity and heat flow at St. Jerôme, Quebec. M.Sc. thesis, McGill University. 1969.
Gautier E. Géochimie et pétrologie du complexe de La Bostonnais et du gabbro du Lac Lapeyrère. M.Sc. thesis, Université Laval; 1993.
Gicquel A, Harris LB, Groulier PA. Interpretation of new aeromagnetic data and implications for geothermal power from a suite of radiogenic units beneath the Appalachian sedimentary cover. In: Québec Mines, Québec, Canada; 2015.
http://gq.mines .gouv.qc.ca/docum ents/exami ne/DV201 506/DV201 506.pdf. Accessed 22 Dec 2018.
Globensky Y. Géologie des Basses-Terres du Saint-Laurent. Report MM85-02, Ministère de l’Énergie et des Ressources du Québec. 1987.
Grasby SE, Allen DM, Bell S, Chen Z, Ferguson G, Jessop A, Kelman M, Ko M, Majorowicz J, Moore M, Raymond J, Therrien R. Geothermal energy resource potential of Canada. Open File 6914, Geological Survey of Canada. 2012. https ://doi. org/10.4095/29148 8.
Hébert C, Nadeau L. Géologie de la région de Talbot (Portneuf ), carte 2213, échelle 1:50000. Étude 95-01, Ministère des Ressources naturelles, Québec. 1995.
Hersi OS, Lavoie D, Nowlan GS. Reappraisal of the Beekmantown group sedimentology and stratigraphy, montreal area, southwestern Quebec: implications for understanding the depositional evolution of the Lower-Middle Ordovician Laurentian passive margin of eastern Canada. Can J Earth Sci. 2003;40(2):149–76.
Higgins MD, van Breemen O. Three generations of anorthosite-mangerite-charnockite-granite (AMCG) magmatism, contact metamorphism and tectonism in the Saguenay-Lac-Saint-Jean region of the Grenville Province, Canada. Precambrian Res. 1996;79(3–4):327–46.
Hillis R, Hand M, Mildren S, Morton J, Reid P, Reynolds S. Hot Dry Rock geothermal exploration in Australia: Application of the in situ stress field to Hot Dry Rock geothermal energy in the Cooper Basin. In: PESA Eastern Australasian Basins Symposium II, Adelaide, South Australia; 2004. p. 415–423.
Hofmann HJ. Stratigraphy of the Montreal area. Excursion Guidebook B-O3, 24th International Geological Congress. 1972. Horspool N, Lescinsky DT, Kirkby AL, Meixner AJ. The Cooper Basin Region 3D Map Version 2: Thermal modeling and
Temperature Uncertainty. 2012. http://pid.geosc ience .gov.au/datas et/ga/74291 . Accessed 22 Dec 2018.
Jaupart C, Mareschal JC, Guillou-Frottier L, Davaille A. Heat flow and thickness of the lithosphere in the Canadian Shield. J Geophys Res Solid Earth. 1998;103(B7):15269–86.
Jaupart C, Mareschal J-C. Heat Generation and Transport in the Earth. Cambridge: Cambridge University Press; 2011. p. 464.
Jessop AM, Allen VS, Bentkowski W, Burgess M, Drury M, Judge AS, Lewis T, Majorowicz J, Mareschal JC, Taylor AE. The Canadian geothermal data compilation. Open File 4887, Geological Survey of Canada. 2005.
Kearey P. An interpretation of the gravity field of the Morin anorthosite complex, southwest Quebec. Geol Soc Am Bull. 1978;89(3):467–75.
Konstantinovskaya E, Malo M, Castillo DA. Present-day stress analysis of the St. Lawrence Lowlands sedimentary basin (Canada) and implications for caprock integrity during CO2 injection operations. Tectonophysics. 2012;518:119–37.
Kumarapeli PS. Vestiges of Iapetan rifting in the craton west of the northern Appalachians. Geosci Can. 1985;12(2):54–9. Lavoie D, Chi GX. Lower Paleozoic foreland basins in eastern Canada: tectono-thermal events recorded by faults, fluids
and hydrothermal dolomites. Bull Can Petrol Geol. 2010;58(1):17–35.
Lavoie D, Pinet N, Castonguay S, Dietrich J, Giles P, Fowler M, Thériault R, Laliberté JY, Peter S, Hinds S, Hicks L, Klassen H. Hydrocarbon systems in the Paleozoic basins of eastern Canada. Open File 5980, Geological Survey of Canada. 2009. Lavoie D, Rivard C, Lefebvre R, Sejourne S, Theriault R, Duchesne MJ, Ahad JME, Wang B, Benoit N, Lamontagne C. The
Utica Shale and gas play in southern Quebec: geological and hydrogeological syntheses and methodological approaches to groundwater risk evaluation. Int J Coal Geol. 2014;126:77–91.
Lee YM, Deming D. Evaluation of thermal conductivity temperature corrections applied in terrestrial heat flow studies. J Geophys Res Solid Earth. 1998;103(B2):2447–54.
Majorowicz J, Grasby SE. Heat flow, depth-temperature variations and stored thermal energy for enhanced geothermal systems in Canada. J Geophys Eng. 2010;7(3):232–41.
Majorowicz J, Minea V. Geothermal energy potential in the St. Lawrence River area, Quebec. Geothermics. 2012;43:25–36. Majorowicz J, Minea V. Geothermal anomalies in the Gaspésie Peninsula and Madeleine Islands, Québec. Trans GRC.
2013;37:1–12.
Malo M, Aznar J-C, Bédard K, Claprood M, Comeau F-A, Konstantinovskaya E, Giroux B, Moutenet J-P, Tran Ngoc TD. Rapport synthèse 2008-2013, Chaire de recherche sur la séquestration géologique du CO2 . Research Report 1492,
INRS-ETE. 2014. http://espac e.inrs.ca/2092/1/R0014 92.pdf. Accessed 22 Dec 2018.
Mansour J, Kaluza O, Giordani J, Beucher R, Farrington R, Kennedy G, Moresi L, Velic M, Beall A, Sandiford D. underworld-code/underworld2: v2.6.0b. 2018. https ://doi.org/10.5281/zenod o.14758 61.
Mareschal JC. Données géothermiques. 2018.
Mareschal JC, Jaupart C. Radiogenic heat production, thermal regime and evolution of continental crust. Tectonophysics. 2013;609:524–34.
Mareschal JC, Jaupart C, Gariepy C, Cheng LZ, Guillou-Frottier L, Bienfait G, Lapointe R. Heat flow and deep thermal struc-ture near the southeastern edge of the Canadian Shield. Can J Earth Sci. 2000;37(2):399–414.
Martignole J, Schrijver K. Anorthosite-farsundite complexes in the southern part of the Grenville Province. Geosci Can. 1977;4(3):137–43.
Minea V, Majorowicz J. Assessment of enhanced geothermal systems potential in Québec, Canada. In: AAPG/SPE/SEG HEDBERG Research Conference Enhanced Geothermal Systems, Napa, California. 2011. http://www.searc handd iscov ery.com/pdfz/abstr acts/pdf/2011/hedbe rg-calif ornia /abstr acts/ndx_minea .pdf.html Accessed 22 Dec 2018. Minea V, Majorowicz J. Preliminary assessment of deep geothermal resources in Trois–Rivières area, Québec. Trans
Geo-therm Resour Council. 2012;36:709–15.
Misener AD, Thompson LGD, Uffen RJ. Terrestrial heat flow in Ontario and Quebec. Trans Am Geophys Union. 1951;32(5):729.