1 2 3 4 5 6
Interactions between silver nanoparticles/silver ions and liposomes: evaluation of the 7
potential passive diffusion of silver and effects of speciation 8 9 10 11 12 13
CAMILLE GUILLEUX, PETER G.C. CAMPBELL and CLAUDE FORTIN* 14
15 16
Institut national de la Recherche scientifique, INRS Eau Terre et Environnement 17
490 rue de la Couronne 18
Québec, Canada G1K 9A9 19 20 21 22 23 *Corresponding author 24
Email [email protected]; Telephone (418) 654-3770 25
Abstract
26Silver nanoparticles, used mainly for their antibacterial properties, are among the most common 27
manufactured nanomaterials. How they interact with aquatic organisms, especially how they cross 28
biological membranes, remains uncertain. Free Ag+ ions, released from these nanoparticles, are
29
known to play an important role in their overall bioavailability. In this project, we have studied 30
the uptake of dissolved and nanoparticulate silver by liposomes. These unilamellar vesicles, 31
composed of phospholipids, have long been used as models for natural biological membranes, 32
notably to study the potential uptake of solutes by passive diffusion through the phospholipid 33
bilayer. The liposomes were synthesized using extrusion techniques and were exposed over time 34
to dissolved silver under different conditions where Ag+, AgS
2O3- or AgCl0 were the dominant
35
species. Similar experiments were conducted with the complexes HgCl20 and Cd(DDC)20, both of
36
which are hydrophobic and known to diffuse passively through biological membranes. The 37
uptake kinetics of Ag+, HgCl20 and Cd(DDC)20show no increase in internalized concentrations
38
over time, unlike AgS2O3- and AgCl0, which appear to pass through the phospholipid bilayer.
39
These results are in contradiction with our initial hypothesis that lipophilic Hg and Cd complexes 40
would be able to cross the membrane whereas silver would not. Encapsulated tritiated water 41
inside the liposomes was shown to rapidly diffuse through the lipid bilayer, suggesting a high 42
permeability. We hypothesize that monovalent anions or complexes as well as small neutral 43
complexes with a strong negative dipole can diffuse through our model membrane. Finally, 44
liposomes were exposed to 5-nm polyvinylpyrrolidone-coated silver nanoparticles over time. No 45
significant uptake of nanoparticulate silver was observed. Neither disruption of the membrane nor 46
invagination of nanoparticles into the liposomes was observed. This suggests that the main risk 47
caused by AgNPs for non-endocytotic biological cells would be the elevation of the free silver 48
concentration near the membrane surface due to adsorption of AgNPs and subsequent 49
oxidation/dissolution. 50
Keywords: model membrane, liposome, metals, speciation, silver nanoparticles, passive diffusion. 51
52 53
Introduction
54The free metal ion is normally the most chemically reactive form for many cationic trace metals 55
in the environment and it is recognized as the best predictor of their uptake and toxicity 56
(Campbell 1995). This relation between the free metal ion activity and metal uptake reflects the 57
dominant mode of transmembrane transport for cationic trace metals, namely facilitated transport 58
involvingmembrane-bound transporters or channels (Campbell 1995). However, one should also 59
take a close look at small and hydrophobic complexes of trace metals that are present in natural 60
waters, as they may bypass the normal membrane transport systems and enter biological cells by 61
simple passive diffusion across the lipid bilayer (Phinney and Bruland 1994). Turner and Mawji 62
(2004) reviewed the literature in this area and summarized the experimentally determined 63
octanol-water partition coefficients (Kow) for neutral Al, Cu, Mn and Pb complexes (from 0.0003
64
for Al-citrate to 10,000 for Pb-diethyl-dithiocarbamate (Pb(DDC)20)). They compared the
65
coefficients they determined for five natural waters with the literature and concluded that such 66
hydrophobic complexes are present in natural surface waters. 67
The involvement of neutral complexes in transmembrane transport is somewhat controversial, 68
notably for AgCl0. Reinfelder and Chang (1999) suggested that the AgCl0 complex could pass
69
through the cell membrane of the euryhaline marine microalga Thalassiosira weissflogii by 70
passive diffusion. They experimentally determined the octanol-water partition coefficients (Kow)
71
at increasing chloride concentrations to estimate the contribution of each silver chloride complex 72
and showed that AgCl0 had the highest value (K
ow = 0.09), suggesting that AgCl0 could diffuse
73
through the algae phospholipid bilayer more easily than other silver species. This Kow, however,
74
is much lower than that of HgCl20 (3.3, Mason et al. (1996)) and of Cd(DDC)20 (270 ± 28,
75
Boullemant et al. (2009)), the internalisation of which have been shown to occur via passive 76
diffusion. In contrast, Fortin and Campbell (2000) studied silver uptake by the freshwater green 77
alga Chlamydomonas reinhardtii and argued against the AgCl0 passive diffusion hypothesis. For
78
example, they found that silver uptake was only slightly affected when the total silver 79
concentration was fixed and the relative importance of the AgCl0 complex was varied by
80
adjusting the chloride concentration. 81
Silver nanoparticles are being increasingly used and contribute to the overall mobility of silver in 82
the environment. Blaser et al. (2008) and Gottschalk et al. (2009) estimated, using theoretical 83
models based on projected use of silver nanoparticles, that nanosilver concentrations could reach 84
40-320 ng/L in European rivers and 0.09-0.43 ng/L in American surface waters. Although silver 85
nanoparticles will likely dissolve or react with suspended particles (Blaser et al. 2008), they could 86
also come into contact with aquatic organisms. However, the assimilation mechanisms of 87
nanoparticles are not well known yet (Treuel et al. 2013). Additionally, their transformations and 88
the speciation of the resulting species will directly affect their bioavailability and toxicity towards 89
aquatic organisms (Levard et al. 2012). To our knowledge, there is only one report of intact 90
nanoparticle assimilation by a unicellular organism (Miao et al. 2010). In this paper, the authors 91
suggested that silver nanoparticles were taken up by phagocytosis, but passive uptake of silver 92
nanoparticles through cell membranes could also contribute to the overall internalization. 93
Phospholipid membranes and especially liposomes, as presented in Figure 1a, have often been 94
used as abiotic models of biological membranes, especially for pharmacological research. Indeed, 95
many of the properties of these vesicles, such as osmotic swelling and permeability to small 96
solutes, are similar to those of natural membranes (Sessa and Weissmann 1968). Rusciano et al. 97
(2009) examined, for example, the interaction between nano-sized organic carbon particles and 98
liposomes. Moghadam et al. (2012) used liposomes to study the influence of the concentration 99
and coating of gold and titanium dioxide nanoparticles on membrane disruption.. The aims of the 100
present study were to determine if liposomes can be used as a model to study the passive 101
diffusion of Ag(I) and the interactions between 5-nm PVP-coated AgNPs and the lipid bilayer. 102
Large unilamellar vesicles made of egg phosphatidylcholine (PC) were prepared. PC is one of the 103
main phospholipids in natural membranes, especially in aquatic invertebrates and algae. One of 104
the objectives of this approach was to explore whether or not silver nanoparticles can cross the 105
cell membrane of small unicellular organisms such as algae. The PC gel-liquid crystalline 106
transition temperature (−2.5°C) is low enough to allow us to work at ambient temperature 107
(Koynova and Caffrey 1998). The simplicity of the membrane composition was important so that 108
only passive diffusion through the lipid bilayer could be considered. Similar experiments were 109
performed with HgCl20and Cd(DDC)20, known to be sufficiently hydrophobic to pass through the
110
biological membranes as mentioned previously,and tritiated water to evaluate the suitability or 111
the potential limits of our model membrane. 112
Materials and methods
113Buffer preparation
114
All plasticware was soaked for 24 h in 10% HNO3 (v/v), rinsed three times with deionized water
115
and three times with ultrapure water (≥ 18 MΩ cm) prior to use. Phenol red and sodium 116
thiosulfate pentahydrate were obtained from Fisher Scientific. The 2-(N-morpholino)-117
ethanesulfonic acid (MES) and 2-(N-morpholino-propanesulfonic acid (MOPS) were obtained 118
from Sigma-Aldrich. Table 1 shows the composition of the different buffer solutions used in this 119
study. The buffers were prepared by using stock solutions (0.1 M) of each of the components, 120
which had been previously filtered through 0.2 µm polycarbonate filter membranes. The pH of 121
the buffer solutions was adjusted using a 1 M NaOH solution and the ionic strength was fixed at 122
25 meq/L by addition of KNO3; the pH was chosen to be environmentally relevant, based on the
123
average pH of freshwater (6.3-8.3, MDDELCC (2016)) and internal cell medium (5.5-7.5, 124
Carrozzino and Khaledi (2005)). In order to maintain the concentration gradient between the 125
exposure solution and the internal solution trapped in the liposomes, a strong ligand was added to 126
the liposomes’ inner solution. We chose thiosulfate because it forms very stable hydrophilic 127
complexes with silver (AgS2O3-, Ag(S2O3)23-: log K1 = 8.82, log β2 = 13.50, Martell et al. (2004))
128
and mercury (Hg(S2O3)22-, Hg(S2O3)34-: log K1 = 29.27, log K2 = 30.8, Nyman and Salazar
129
(1961)). For cadmium, ethylenediaminetetraacetic acid (EDTA) was chosen as the internal ligand 130
(Cd(EDTA)2+, log K = 18.1, Martell et al. (2004)). The ionic strength and species distribution in
131
each solution were calculated using MINEQL+ chemical equilibrium software (v.4.6; Schecher 132
and McAvoy (2001)). According to these calculations, silver and mercury were mostly (>99%) 133
bound to thiosulfate when placed in the internal buffer solution, for all tested conditions; 134
similarly, cadmium speciation in the internal buffer solution was dominated by its complex with 135
EDTA (>99%). 136
Liposomes synthesis
137
Egg yolk phosphatidylcholine (EPC) was provided by Avanti Polar Lipids. Internally threaded 138
cryogenic vials (5 mL) were obtained from Fisher Scientific. Polycarbonate filters were provided 139
by Millipore. Liposomes were prepared by the extrusion technique (Ducat et al. 2010). Egg yolk 140
phosphatidylcholine was initially dissolved in a mixture of organic solvents (9:1; 141
chloroform:methanol), kept in the freezer at -20°C. The solvents were evaporated under a gentle 142
nitrogen flow (1 h at 35°C). The cryogenic vial was then placed in a desiccator under vacuum for 143
2 h to remove traces of solvent. The lipids were then re-suspended in the internal buffer solution 144
by using a vortex mixer. Multilamellar vesicles (or MLVs) are spontaneously formed under these 145
conditions (Berger et al. 2001). Eight freeze-thaw cycles were then applied in order to break the 146
phospholipid bilayers by the formation of ice crystals formed during the freezing step (Castile and 147
Taylor 1999) and form large unilamellar vesicles. Briefly, the vial was placed in a liquid nitrogen 148
bath for 1 min, then in a water bath at 45°C for 5 min and lastly shaken on a vortex mixer for 1 149
min. The vesicles were finally passed six times through an extruding system containing two 150
stacked 200-nm polycarbonate filters (Figure S1 in the supporting information (SI)) (Ducat et al. 151
2010). Two syringes were used alternately, without changing the filter orientation, to force the 152
liposomes through the filters, minimizing losses. 153
The mean diameter and size distribution of the liposomes were analyzed by dynamic light 154
scattering (DLS) using a Malvern Zetasizer Nano-ZS instrument. Malvern folded capillary zeta 155
cells were cleaned three times with ethanol and three times with ultrapure water before use for 156
measurements. Six measures were taken at 25°C for each preparation, each measure 157
corresponding to six scans of 15 s each. 158
Size-exclusion chromatography
159
The aim of this step was to transfer the liposomes to the pH 7.4 exposure buffer solution and to 160
verify the liposomes’ membrane integrity. Indeed, if there were any leakage out of the liposomes, 161
the phenol red dye, yellow in the pH 6.0 internal buffer solution, would reach the pH 7.4 outer 162
solution and turn red. Sephadex G50 Fine resin was obtained from Fisher Scientific. The 2.5 x 50 163
cm Econo-Column Chromatography columns were purchased from Bio-Rad. The transfer was 164
done by passing the liposomes through a Sephadex G50 resin filled column, used for size-165
exclusion chromatography (SEC) and previously equilibrated with the pH 7.4 exposure buffer 166
solution. The first colored fraction (yellow), containing the liposomes, was collected and analyzed 167
on a Varian Cary 50 UV-spectrophotometer at 432 nm (Agilent Technologies). Just after the 168
fraction collection and before using the large unilamellar vesicles (LUVs), the vials containing 169
the liposomes were kept on ice to avoid potential membrane damage. The mean diameter and size 170
distribution of the liposomes in the pH 7.4 exposure buffer solution were determined again as 171
mentioned above. 172
Total phosphorus analysis
173
In order to quantify the amount of liposomes used, a relationship between the absorbance of a 174
sample at 432 nm (phenol red absorbance wavelength) and its total phosphorus concentration (g 175
P/L) was determined. The total phosphorus concentration was determined by colorimetry. Briefly, 176
a sample aliquot was diluted in a 0.2 % sulfuric acid solution. After addition of 0.5 g of potassium 177
persulfate, the solution was autoclaved for 45 min between 83 and 103 kPa. A solution of 7.5 g/L 178
ammonium paramolybdate and 0.14 g/L potassium antimonyl tartrate in 8.8% H2SO4 was stirred
179
together with a solution of 25 g/L ascorbic acid. This mixture was added to the autoclaved 180
solution to form a blue complex with phosphate. A standard solution of KH2PO4 was used to
181
establish a calibration curve and a control sample initially containing 3.54 mg P/L was used to 182
verify the method accuracy. Absorbance measurements were made on a UV-spectrophotometer at 183
885 nm. The phosphorus calibration curve is given in Figure S2 (SI). 184
The total number of phosphatidylcholine molecules per chromatographic fraction,
N
PC, could 185then be calculated as follows: 186 a PC N N V C n (1) 187 a a PC
V
N
x
N
V
C
N
31
(2) 188where
n
= amount of PC (moles), C = concentration (moles PC/L), V = fraction volume (L),189 a
N
= Avogadro constant (6.022·1023 mole-1),x
= total phosphorus concentration in the fraction 190(g P/L). 191
The total number of liposomes per chromatographic fraction is: 192 tot PC LUV N N N (3) 193
The total number of phosphatidylcholine molecules per liposome,
N
tot , depends on the 194liposome’s diameter d (nm) (Enoch and Strittmatter 1979):
195 ) ) 5 2 ( ) 2 (( 69 . 17 2 2 d d Ntot (4) 196 Then, ) ) 5 2 ( ) 2 (( 69 . 17 31 2 2 d d N V x N a LUV (5) 197 198
Short term accumulation experiments
199
Liposomes exposed to dissolved silver 200
This preliminary experiment was done to quantify any contribution of the free silver ion, released 201
from the nanoparticles, to silver uptake by the liposomes. This was also useful to quantify the 202
potential contribution of free silver ions in the AgS2O3- and the AgCl0 experiments (Table 2).
203
Radioactive 110mAg (as AgNO
3 in 0.1 M HNO3, initial specific activity = 5.15 mCi/mL, total [Ag]
204
= 5 mM) was supplied by the Radioisotope Centre Polatom. Short-term (100 min) experiments 205
were performed at pH 7.40 ± 0.02 with an initial concentration of 30 nM 110mAg in the exposure
solution. As radioactive silver produces radiation at 657.76 keV, every analysis was done 207
between 580 and 1020 keV on a Wizard 2 automatic gamma counter (PerkinElmer), with a 208
counting time of 300 s and a maximal counting number of 100,000 events. 209
Radioactive silver was diluted in a pH 7.4 buffer solution with or without a silver-binding ligand 210
(thiosulfate or chloride), the pH was adjusted using a 1 M NaOH solution and the ionic strength 211
was fixed with KNO3 to reach the same ionic strength as the internal buffer held within the
212
liposomes (Tables 1 and 2). The solutions were placed in three 125-mL HDPE vials. An aliquot 213
of each solution was then taken and analyzed on the gamma counter to determine the initial silver 214
exposure concentration. An aliquot of the liposomes suspension was then added to the exposure 215
solutions and the vials were placed on a Wrist Action Shaker (Burrell) for 100 min. The liposome 216
concentration was selected so that the external silver concentration did not decrease more than 217
10% during the exposure period. The thiosulfate concentration in the inner solution (1.33 mM) 218
was chosen to ensure that it was always greater than the internal silver concentration, so that a 219
free Ag+ concentration gradient was maintained between the exposure solution and the solution
220
held within the liposomes. 221
In the time-course experiments, an aliquot from each vial was taken every 10 min and placed in a 222
15-mL vial containing Ambersep GT 74 resin (300 mg) (Sigma-Aldrich), a weakly acidic cation 223
exchange resin with very high affinity for soft metal ions such as mercury, silver and cadmium. 224
The vials were shaken for 5 min. After allowing the resin to settle, an aliquot of the supernatant 225
was taken and analyzed on the gamma counter (see Figure S3 in the supporting information for a 226
detailed illustration of the experimental design of these uptake experiments). 227
Similar experiments were conducted with liposomes prepared with an internal buffer solution 228
without thiosulfate (internal buffer solution (w/o trap) in Table 1) and the results were compared 229
to the previous ones. As only adsorption to the liposomes could occur in these experiments, it 230
allowed us to differentiate between uptake (C, D or E in Figure 1c) and adsorption (B in Figure 231
1c) by comparing the first two experiments: if the results are the same, only adsorption is 232
occurring. On the other hand, if there is a difference, one could conclude that silver can pass 233
through the liposome membrane. 234
Liposomes exposed to HgCl2 0
235
Similar experiments were conducted in a medium where HgCl20 was the dominant species
236
(exposure solution 4 in Table 2). Mercury was diluted in a pH 7.4 buffer solution with chloride as 237
the mercury ligand. The liposomes were exposed as explained previously for silver. Ambersep 238
GT 74 resin (500 mg) was then added to stop the exposure and bind adsorbed and non-239
internalized mercury. Mercury was analysed by inductively coupled plasma – mass spectrometry 240
(ICP-MS, Model XSeries 2, Thermo Scientific). Briefly, samples were diluted in 10% HCl and 241
3% H2O2. Gold was also added to a concentration of 10 ppm to prevent any adsorption of Hg on
242
tube walls. Instrument response was calibrated within the expected range (0 to 28 nM) with 243
standard solutions obtained from PlasmaCAL SCP Science. An internal standard solution of 103Rh
244
(58 nM) was used to correct analytical signal suppression (or enhancement) due to matrix effects 245
or signal fluctuations. Custom ICP Standards (SCP Science) were used as controls to verify the 246
precision and accuracy of the method (see Figure S3). 247
The mean diameter and size distribution of the liposomes exposed to mercury for 100 min were 248
analyzed once by dynamic light scattering (DLS) using a Malvern Zetasizer Nano-ZS instrument 249
to verify there was no change. 250
Liposomes exposed to Cd(DDC)20 251
Radioactive Cd (as CdCl2 in 0.5 M HCl, initial specific activity = 37.1 µCi/mL, total [Cd] = 1.0
252
µM) was supplied by Eckert & Ziegler). Similar experiments were conducted in a medium where 253
Cd(DDC)20 was the dominant species (exposure solution 5 in Table 2). Cadmium was diluted in a
254
pH 7.4 buffer solution with sodium diethyl-dithiocarbamate (DDC) as the cadmium ligand. The 255
liposomes were exposed as explained before. As radioactive cadmium produces radiation at 22 256
keV, each analysis was done between 16 and 32 keV on a Wizard 2 automatic gamma counter 257
(PerkinElmer)), with a counting time of 600 s and a maximal counting number of 10,000,000 258
events (see Figure S3). 259
Liposomes exposed to tritiated water 260
The basic permeability of the phospholipid bilayer was determined by measuring the diffusion of 261
tritiated water from the internal to the external buffer. Tritiated water (initial specific activity = 10 262
mCi/mL) was supplied by DuPont. The liposomes were prepared in a buffer containing tritiated 263
water so as to encapsulate 3H2O inside the vesicles. The liposomes were then transferred to the
264
pH 7.4 exposure buffer solution suing the Sephadex column as described above. Fractions from 265
the column were collected every 10 or 20 mL and analysed on the liquid scintillation analyzer and 266
UV-visible spectrophotometer to quantify 3H and P respectively. Each analysis was done between
0 and 18.6 keV using Ecolite scintillation cocktail (MP Biomedicals) on a Tri-Carb 2910TR 268
liquid scintillation analyzer (PerkinElmer), with a counting time of 1 min. 269
Liposomes exposed to silver nanoparticles 270
A solution of 5-nm PVP-coated silver nanoparticles with an initial concentration of 9 mM 271
(Nanocomposix, San Diego, CA) was used in these experiments. In order to be able to compare 272
the results for silver nanoparticles with those for dissolved silver, the concentration of free silver 273
in the exposure solution 6 should be equal to that in the exposure solution 1 (Table 2). 274
Ultracentrifugation was used to determine the free silver content in AgNPs solutions of different 275
concentrations, between 42 and 463 nM, prepared from the 9 mM solution. Silver nanoparticles 276
were diluted in a solution at pH 7.4 as shown in Table 2. Ultracentrifugation tubes (Amicon 277
Ultra-15, Millipore), equipped with filters with a molecular weight cut-off (MWCO) of 3 kDa, 278
were pre-rinsed with the external buffer solution in order to remove glycerin present on the 279
membranes. Filters were then pre-equilibrated with the AgNPs solutions by successive 280
centrifugations at 3700 x g for 20 min, as dissolved silver adsorbs on the membrane surface to a 281
non-negligible extent. After each centrifugation, total and ultrafiltered Ag concentrations were 282
analyzed by ICP-MS (2% HNO3). For example, the dissolved silver concentrations after one and
283
two centrifugations were statistically different. For the targeted 4 µg/L solution, dissolved silver 284
concentrations decreased from 1.8 to 1.4 µg/L due to adsorption on the membrane (Figure S6). 285
The equilibrium was estimated to be achieved after five successive centrifugations. The selected 286
AgNPs concentration was that for which the dissolved Ag concentration at equilibrium was about 287
20 nM. Ultracentrifugation was also used as presented above during the accumulation 288
experiments in order to monitor the potential AgNPs oxidation/dissolution through time. 289
Exposure of the liposomes to silver nanoparticles was performed in a similar way to that 290
described for dissolved metals. Exposure solution 6 (Table 2) was prepared from the 9 mM 291
AgNPs solution. The liposomes, synthesized in the internal buffer solution (containing 292
thiosulfate), were exposed for 100 min. Every 10 min, a 5 min treatment with the Ambersep GT 293
74 resin (500 mg) was applied to liposomes exposed to nanoparticles. Analyses were performed 294
by ICP-MS as explained above. 295
296
Replication and Statistics
297
Every experiment was conducted at least twice (n ≥ 2). Data were analysed for normality using 298
the Shapiro-Wilk test and for homogeneity of variance across treatments using Levene’s test. 299
Student’s t-tests were run to compare distributions with a size n = 2. One way ANOVA test was 300
applied to compare distributions with size n > 2. The effect of exposure time on the accumulation 301
of metals was evaluated using linear regressions. Non-linear regression (exponential rise to 302
maximum, Boullemant et al. (2009)) was used when it best fitted the data. Statistical analyses 303
were conducted at a 95% confidence interval (α = 0.05) and graphs were created using SigmaPlot 304 12.5. 305 306
Results
307Liposomes: mean diameter and size distribution
308
The Malvern Zetasizer Nano-ZS, used to determine the mean diameter and size distribution of the 309
liposomes, is an instrument based on dynamic light scattering (DLS). The size distribution most 310
frequently found in the literature is an intensity distribution (Z-average), calculated from the 311
instrument signal intensity. However, this distribution is highly affected by the presence of big 312
particles and is reliable only for monomodal samples with a polydispersity index (PDI) < 0.1. It 313
can be converted to a volume distribution (volume mean), which takes the particles’ volume into 314
account (Malvern 2004). 315
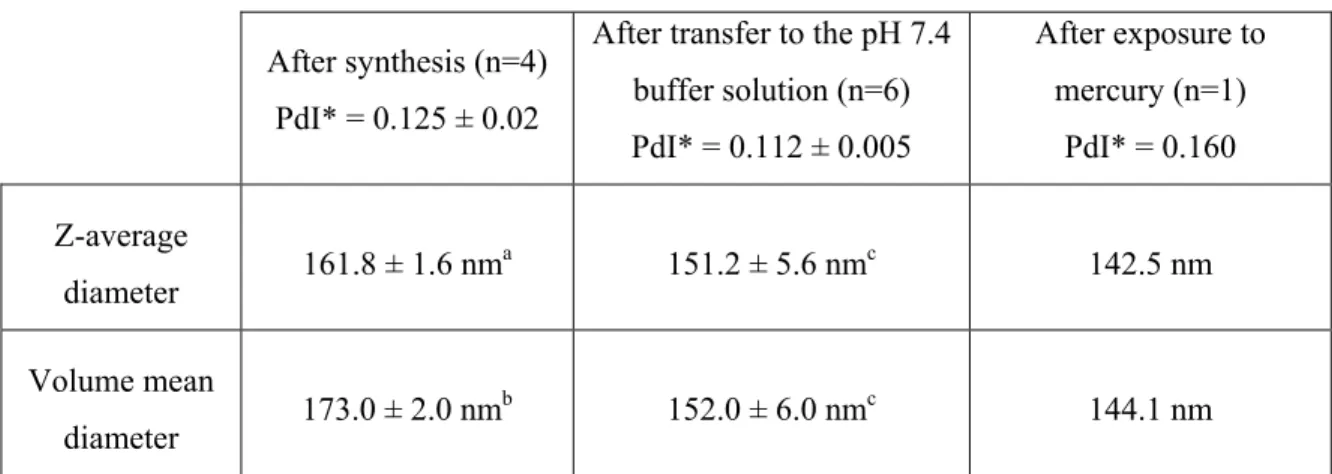
The mean diameter and size distribution of the liposomes were determined immediately after their 316
synthesis, after their transfer to the pH 7.4 exposure solution, and once at the end of their 317
exposure to mercury (Table 3). The intensity and volume distributions were significantly different 318
after synthesis (p < 0.05); since the polydispersity index was higher than 0.1, the volume mean 319
was chosen as the reference value. The volume distributions after synthesis and after transfer to 320
the pH 7.4 buffer solution were also significantly different (p < 0.05). The size of the liposomes 321
tended to decrease after their transfer to the pH 7.4 buffer solution, from 173.0 ± 2.0 to 152.0 ± 322
6.0 nm in diameter. The reason for this decrease is unclear, given that the calculated ionic 323
strengths of the inner and outer solutions were similar at both pH values 324
Transfer to the pH 7.4 buffer solution
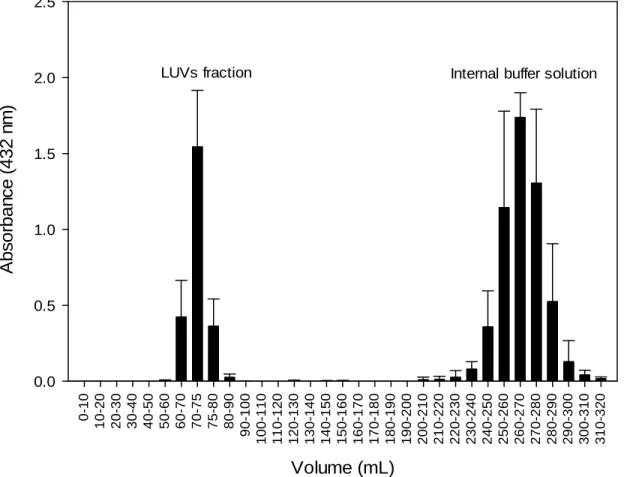
The liposomes (yellow fraction) eluted after 70 mL (Figure 2). The second fraction, in red, eluted 326
much later than the liposomes (elution volume = 265 mL). The background noise in absorbance at 327
432 nm was relatively low (around 0.06) and the results were reproducible: the elution volume of 328
the LUVs fraction (maximum absorbance between 70 and 75 mL) as well as the difference in 329
elution volume between fractions (around 150 mL) were similar for the three replicates. 330
Short term accumulation experiments
331
Liposomes exposed to dissolved metals 332
The accumulation of Ag+ by liposomes (Figure 3a) had reached a plateau from the experiment
333
start (10 min) and no significant effect of time (p > 0.05) was observed on the accumulation of 334
Ag. Similar results were obtained for HgCl20 (Figure 3b) and Cd(DDC)20(Figure 3f) (p > 0.05).
335
On the other hand, the accumulation of AgS2O3- as a function of time (Figure 3c) fitted a
non-336
linear regression as described by eq 6: 337 1 ) (6) 338 Ag ∙ ∙ ∙ 1 ∙ ∙ (7) 339
where is the total Ag concentration in the liposomes (µmol Ag/g P), Ag the 340
concentration of the complex in the exposure solution (µmol/L), the uptake constant (L/g 341
P·min), the elimination constant (min-1) and the labile intracellular metal fraction (eq 7,
342
derived from Boullemant et al. (2009)). 343
A significant coefficient of determination (R2=0.98, p˂ 0.0001, n=10) was obtained, indicating a
344
strong effect of time on the accumulation of silver complexed with thiosulfate (Figure 3c). A 345
similar result was obtained for AgCl0 (Figure 3e) (R2=0.90, p˂ 0.0001, n=10). No statistically
346
significant accumulation was observed for the experiment without thiosulfate in the internal 347
buffer solution (Figure 3d). In the absence of a trap in the internal buffer solution, silver can 348
adsorb to the surface of the liposomes but does not accumulate inside. 349
Liposomes exposed to tritiated water 350
Another experiment designed to test the liposomes’ permeability was performed with tritiated 351
water. It was encapsulated inside the liposomes and passed through the steric exclusion 352
chromatography column. Figure 4 presents the radiometric results associated with the collected 353
fractions. The liposomes emerged after around 70 mL, as shown previously and a radioactivity of 354
only 6 cpm/mL, linked to the tritiated water concentration, was detected in the liposomes’ main 355
fraction (70-80 mL). 356
Liposomes exposed to silver nanoparticles 357
We compared the ultrafiltered Ag concentrations (from 9 to 40 nM) after five successive 358
centrifugations of AgNPs solutions at different concentrations. We were then able to conclude 359
that the solution at 42 nM Agtotal was closest to the experimental conditions with dissolved silver
360
(20 nM Agdissolved, Figure S6, SI).
361
The oxidation of AgNPs as a function of time is presented in Figure 5. At time 0, only ~40% of 362
silver was in dissolved form. After about 20 min, a decrease in total Ag concentration was 363
observed in the solution (about 60%), presumably due to Ag adsorption. Silver was then present 364
mostly as dissolved (93%) and showed little variation over time, although a small statistically 365
significant increase was observed (one way ANOVA p <0.05). 366
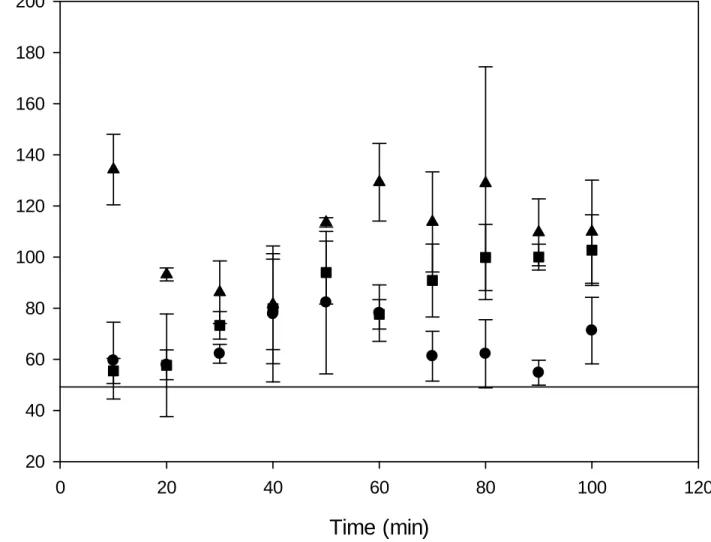
The liposome exposure experiment to nanosilver was repeated three times under the same 367
experimental conditions. The results were gathered in Figure 6. No statistically significant 368
increase (based on linear or non-linear regression analyses) was observed. Note that in the case 369
where the raw data (and not the averages) were collected on the same graph, the increase was 370
slightly significant (p = 0.0224) (Figure S7, SI). 371
372
Discussion
373The biotic ligand model (BLM) is used to predict the bioavailability (and potential toxicity) of 374
metals in the aquatic environment towards aquatic organisms (Campbell et al. 2002). The BLM 375
predicts that, once a metal encounters the surface of a living cell, it may bind to surface sites 376
before being transported across the membrane. Typically, adsorption occurs very rapidly whereas 377
metal accumulation increases slowly over time (Campbell et al. 2002). In the context of our 378
study, if only metal adsorption on liposomes occurs, equilibrium should be reached rapidly. This 379
is the case for Ag+ (cf. Figure 3a), which leads us to conclude that ionic silver did not diffuse
380
passively through the membrane of the liposomes but was only adsorbed at their surface. 381
Our results also suggest that HgCl20 (Figure 3b) and Cd(DDC)20(Figure 3f) were also simply
382
adsorbed on the membrane of the liposomes, contrary to expectations. As mentioned in the 383
introduction, these two species are believed to be sufficiently hydrophobic (Kow = 3.3, Mason et
al. (1996) and 270 ± 28 at pH 7, Boullemant et al. (2009), respectively) to pass through the lipid 385
membrane. Indeed, Mason et al. (1996) demonstrated that the coastal diatom Thalassiosira 386
weissflogii took up HgCl20 by passive diffusion. Moreover, Bienvenue et al. (1984) and
387
Gutknecht (1981) studied the permeability of planar lipid bilayer membranes (PLMs), exposed to 388
the dichloromercury complex and demonstrated that it could cross the PLM by passive diffusion. 389
Finally, Boullemant et al. (2009) as well as Phinney and Bruland (1994) observed passive 390
diffusion of Cd(DDC)20 through the cell membrane of three freshwater algae and a coastal
391
diatom, respectively. 392
Based on the solubility-diffusion model, the membrane should be permeant to water and small 393
neutral solutes (Finkelstein and Cass 1968), such as glycerol and urea (Paula et al. 1996), HgCl20
394
or Cd(DDC)20 (Finkelstein and Cass 1968). It is thus surprising that our model membrane does
395
not allow these species to pass. Several factors could have influenced these results. For example, 396
these species have relatively high molecular weights (272 g/mol for HgCl20 and 408 g/mol for
397
Cd(DDC)20). Cohen and Bangham (1972) showed that the diffusion of non-electrolytes (estimated
398
as the ratio of the measured permeability values to the oil/water partition coefficient) into 399
liposomes tended to decrease when the molecular weight increased. Note also that the water 400
permeability values for planar lipid membranes (PLMs) are on average one order of magnitude 401
higher than those for LUVs, suggesting that LUVs may be less permeable than PLMs (Deamer 402
and Bramhall 1986). For example, the water permeability coefficient for egg PC liposomes is 2.0 403
µm/s (Carruthers and Melchior 1983) against 40.2 µm/s for egg PC planar lipid bilayers 404
(Finkelstein and Cass 1967). Furthermore, Shimanouchi et al. (2011) noticed that the hydration of 405
the lipid bilayer depends on its curvature. In addition, metal interactions with membranes have 406
been shown to cause dehydration of liposomes, but only at mM concentrations (Kerek and 407
Prenner (2016), Klasczyk et al. (2010), Maity et al. (2016)). This parameter, regulating the 408
phospholipid headgroup mobility, varies as a function of liposome diameter and could then be 409
one of the determining factors influencing membrane permeability. 410
On the other hand, AgS2O3- and AgCl0 were shown to be slowly internalised by liposomes, with
411
an apparent steady-state reached after 60 min of exposure (Figure 3c, e). Non-linear regressions 412
using (eq 4) allowed us to extract uptake constants of 52.2 ± 4.4 mL/g P·min for AgS2O3- (24.2
413
nM) and 62.5 ± 19.2 mL/g P·min for AgCl0 (24.5 nM). There is no significant difference between 414
both uptake constants (Student’s t-test, p>0.05), therefore the liposomes seem to be as permeable 415
to AgCl0 as to AgS
2O3-. Considering the absence of any apparent passive diffusion of the
416
lipophilic complexes HgCl20 and Cd(DDC)20, the uptake of AgS2O3- and AgCl0 is puzzling. Fortin
and Campbell (2001) suggested that AgS2O3- could be transported into algal cells via
418
sulfate/thiosulfate transport systems but to our knowledge the uptake of this complex has never 419
been tested previously on artificial membranes. Some publications on lipid bilayers (Deamer and 420
Bramhall (1986), Haydon and Hladky (1972); Sessa and Weissmann (1968)) suggest that the 421
permeability of anions is significantly greater than that of cations (ex: 103 times higher for Cl
-422
than for Na+ or K+, Deamer and Bramhall (1986)). This could explain our results: the anionic
423
complex AgS2O3- would pass through the membrane by passive diffusion, unlike the cation Ag+.
424
Note that this mechanism involves an exchange of anions between the inside of the liposomes and 425
the external medium in order to respect solution electroneutrality. It may also be the case for 426
AgCl2-, present in non-negligible proportions in the exposure solution 3 (14.5%, Table 2). With
427
regards to the small AgCl0 complex, the residual charges are important (with large dipoles),
428
making it a very polar solute. We hypothesize that this complex can diffuse in a manner similar to 429
anions or water molecules. 430
To determine if water molecules can diffuse through the lipid bilayer of our liposomes, we 431
compared the initial and final 3H activities after separation of the tritiated LUVs from the tritium
432
solution. The initial 3H activity was calculated as follows. The initial concentrated solution of 433
tritiated water has an activity of 10 000 µCi/mL. During the liposome synthesis, this solution was 434
diluted 45 times, leading to an activity of 222 µCi/mL or 8 222 000 Bq/mL. The internal volume 435
of a 150-nm liposome is about 1.4·10-15 mL and the number of liposomes per mL was 3.8·1012
436
LUVs/mL (as determined by absorbance; see supporting information). Thus, the initial 3H activity
437
in the liposomes was estimated to be 5.5·104 Bq/mL of solution. Experimentally, only 0.25
438
Bq/mL was detected in the main liposomes fraction. The proportion of tritiated water recovered in 439
the liposomes is thus equal to 0.00005 % of the initial activity. The tritiated water, initially used 440
for liposomes synthesis, eluted after around 220 mL. Thus, the liposomes elution time (around 1 441
h, based on the elution speed) was sufficient for the encapsulated tritiated water to leave the 442
LUVs, indicating that the liposomes are very permeable to water, as first demonstrated by 443
Bangham et al. (1965). The water permeability of lipid membranes is crucial as it allows 444
biological membranes to regulate their internal volume. The membranes exhibit a wide range of 445
water permeability coefficients, depending on membrane lipid composition and structure, chain 446
length and unsaturation, and cholesterol concentration (Deamer and Bramhall 1986). The water 447
permeability of lipid bilayers is also higher for lipids in a liquid crystalline state (T > Ttransition)
448
than lipids in a gel state, which is the case in this study (T > -2.5°C) (Huster et al. 1997). 449
When AgNPs are suspended in our exposure solutions, changes were observed (Figure 5). The 450
observed trend could be due to the oxidation of AgNPs, increasing the proportion of dissolved Ag 451
and the subsequent adsorption of Ag on the container walls. Liposomes exposed to a low 452
concentration of silver nanoparticles showed no significant increase in Ag accumulation (Figure 453
6). This is consistent with the fact that no studies have shown that silver nanoparticles can pass 454
through the phospholipid membrane by passive diffusion. Le Bihan et al. (2009) studied the 455
invagination of silica nanoparticles by liposomes. They indicated that this process was very rapid 456
and that it would have been difficult to analyze it without using a method to slow it down. Thus, 457
they covered silica nanoparticles with gold nanoparticles (positively charged, 10 nm) which made 458
it possible to slow down the liposomes spreading on the silica surface. They were then able to 459
observe the intermediate steps of the engulfment process by cryo-TEM. If an invagination of 460
AgNPs-PVPs by liposomes had occurred, its observation would not have been possible under our 461
experimental conditions. It would have been possible to apply a treatment similar to that set up by 462
Le Bihan et al. (2009) in order to slow down the process and to observe or not this invagination, 463
within the 20 to 30 min where silver nanoparticles are still present and relatively intact in solution 464
(Figure 5). Nevertheless, based on Le Bihan et al. (2009), our AgNPs with a size less than or 465
equal to 5 nm would not possess sufficient adhesion strength to cause invagination and could only 466
adsorb to the surface of the liposomes. Moreover, considering the small amounts of silver found 467
associated with the liposomes (on average 38.3 μmol Ag / g P, corrected for the residual amount 468
of Ag), we can hypothesize that the invagination of silver nanoparticles is unlikely and that 469
AgNPs only adsorbed to the surface of the liposomes, as has been shown by Wang et al. (2016). 470
471
Conclusion
472The objective of this study was to test if nanoparticulate silver could cross a lipid bilayer. To do 473
this we used 150-nm liposomes made of phosphatidylcholine. Because nanoparticulate silver 474
always release dissolved ions, we first had to characterize the passive diffusion of dissolved 475
species of Ag(I). This was done by performing short term experiments under different conditions 476
where Ag+, AgS
2O3- or AgCl0 were the dominant species. The permeability of liposomes was also
477
tested with HgCl20, Cd(DDC)20 and 3H2O. Our liposomes proved to be impermeable to ionic and
478
nanoparticulate silver. Considering that we used nanoparticles among the smallest available on 479
the market with the most neutral coating which would favor its passive diffusion across a lipid 480
bilayer, our results suggest that nanoparticles cannot diffuse through a bilipid membrane. 481
On the other hand, it appeared that our artificial lipid bilayer could be more permeable to anions 482
such as AgS2O3- than to cations. However, this is not an inherent property of biological
483
membranes of living organisms. Although liposomes have often been used to study the 484
interaction between contaminants and biological membranes, there remains a large gap between 485
LUVs and living cells. Indeed, the hydrophobic complexes HgCl20 and Cd(DDC)20 did not pass
486
through the phospholipid bilayer of our liposomes, contrary to what have been previously 487
demonstrated for biological membranes. Therefore an extrapolation of the liposomes results to 488
toxicological studies must be made with caution. 489
490
Acknowledgments
491Financial support was provided by the Natural Sciences and Engineering Research Council of 492
Canada (NSERC STPGP 412940 - 2011). Claude Fortin and Peter G.C. Campbell were supported 493
by the Canada Research Chairs program. 494
References 495
496
Bangham AD, Standish MM, Watkins JC (1965) Diffusion of univalent ions across the lamellae 497
of swollen phospholipids. J Mol Biol 13:238-252 doi:10.1016/S0022-2836(65)80093-6 498
Berger N, Sachse A, Bender J, Schubert R, Brandl M (2001) Filter extrusion of liposomes using 499
different devices: comparison of liposome size, encapsulation efficiency, and process 500
characteristics. Int J Pharm 223:55-68 doi:10.1016/S0378-5173(01)00721-9 501
Bienvenue E, Boudou A, Desmazes JP, Gavach C, Georgescauld D, Sandeaux J, Sandeaux R, 502
Seta P (1984) Transport of mercury compounds across bimolecular lipid membranes: 503
effect of lipid composition, pH and chloride concentration. Chem Biol Interact 48:91-101 504
doi:10.1016/0009-2797(84)90009-7 505
Blaser SA, Scheringer M, MacLeod M, Hungerbuhler K (2008) Estimation of cumulative aquatic 506
exposure and risk due to silver: Contribution of nano-functionalized plastics and textiles. 507
Sci Total Environ 390:396-409 doi:10.1016/j.scitotenv.2007.10.010 508
Boullemant A, Lavoie M, Fortin C, Campbell PGC (2009) Uptake of Hydrophobic Metal 509
Complexes by Three Freshwater Algae: Unexpected Influence of pH. Environ Sci 510
Technol 43:3308-3314 doi:10.1021/es802832u 511
Campbell PGC (1995) Interactions between trace metals and aquatic organisms: a critique of the 512
free-ion activity model. In: Tessier A, Turner DR (eds) Metal speciation and 513
bioavailability in aquatic systems. John Wiley & Sons Ltd, pp 45-102 514
Campbell PGC, Errécalde O, Fortin C, Hiriart-Baer VP, Vigneault B (2002) Metal bioavailability 515
to phytoplankton—applicability of the biotic ligand model. Comp Biochem Physiol C: 516
Pharmacol Toxicol 133:189-206 doi:10.1016/S1532-0456(02)00104-7 517
Carrozzino JM, Khaledi MG (2005) pH effects on drug interactions with lipid bilayers by 518
liposome electrokinetic chromatography. J Chromatogr A 1079:307-316 519
doi:10.1016/j.chroma.2005.04.008 520
Carruthers A, Melchior DL (1983) Studies of the relationship between bilayer and water 521
permeability and bilayer physical state. Biochem 22:5797-5807 doi:10.1021/bi00294a018 522
Castile JD, Taylor KMG (1999) Factors affecting the size distribution of liposomes produced by 523
freeze–thaw extrusion. Int J Pharm 188:87-95 doi:10.1016/S0378-5173(99)00207-0 524
Cohen BE, Bangham AD (1972) Diffusion of small nonelectrolytes across liposomes membranes. 525
Nature 236:173-& doi:10.1038/236173a0 526
Deamer DW, Bramhall J (1986) Permeability of lipid bilayers to water and ionic solutes. Chem 527
Phys Lipids 40:167-188 doi:10.1016/0009-3084(86)90069-1 528
Ducat E, Brion M, Lecomte F, Evrard B, Piel G (2010) The experimental design as practical 529
approach to develop and optimize a formulation of peptide-loaded liposomes. AAPS 530
PharmSciTech 11:966-975 doi:10.1208/s12249-010-9463-3 531
Enoch HG, Strittmatter P (1979) Formation and properties of 1000-A-diameter, single-bilayer 532
phospholipid vesicles. Proc Nat Acad Sci USA 76:145-149 doi:10.1073/pnas.76.1.145 533
Finkelstein A, Cass A (1967) Effect of cholesterol on the water permeability of thin lipid 534
membranes. Nature 216:717-718 doi:10.1038/216717a0 535
Finkelstein A, Cass A (1968) Permeability and electrical properties of thin lipid membranes. J 536
Gen Physiol 52:145-172 doi:10.1085/jgp.52.1.145 537
Fortin C, Campbell PGC (2000) Silver uptake by the green alga Chlamydomonas reinhardtii in 538
relation to chemical speciation: Influence of chloride. Environ Toxicol Chem 19:2769-539
2778 doi:10.1002/etc.5620191123 540
Fortin C, Campbell PGC (2001) Thiosulfate enhances silver uptake by a green alga: Role of anion 541
transporters in metal uptake. Environ Sci Technol 35:2214-2218 doi:10.1021/es0017965 542
Gottschalk F, Sonderer T, Scholz RW, Nowack B (2009) Modeled environmental concentrations 543
of engineered nanomaterials (TiO2, ZnO, Ag, CNT, fullerenes) for different regions.
544
Environ Sci Technol 43:9216-9222 doi:10.1021/es9015553 545
Gutknecht J (1981) Inorganic mercury (Hg2+) transport through lipid bilayer membranes. J
546
Membr Biol 61:61-66 doi:10.1007/bf01870753 547
Haydon DA, Hladky SB (1972) Ion transport across thin lipid-membranes - critical discussion of 548
mechanisms in selected systems. Q Rev Biophys 5:187-282 549
doi:10.1017/S0033583500000883 550
Huster D, Jin AJ, Arnold K, Gawrisch K (1997) Water permeability of polyunsaturated lipid 551
membranes measured by O-17 NMR. Biophys J 73:855-864 doi:10.1016/S0006-552
3495(97)78118-9 553
Kerek EM, Prenner EJ (2016) Inorganic cadmium affects the fluidity and size of phospholipid 554
based liposomes. Biochimica et Biophysica Acta (BBA) - Biomembranes 1858:3169-555
3181 doi:10.1016/j.bbamem.2016.10.005 556
Klasczyk B, Knecht V, Lipowsky R, Dimova R (2010) Interactions of Alkali Metal Chlorides 557
with Phosphatidylcholine Vesicles. Langmuir 26:18951-18958 doi:10.1021/la103631y 558
Koynova R, Caffrey M (1998) Phases and phase transitions of the phosphatidylcholines. Biochim 559
Biophys Acta, Biomembr 1376:91-145 doi:10.1016/s0304-4157(98)00006-9 560
Le Bihan O et al. (2009) Cryo-electron tomography of nanoparticle transmigration into liposome. 561
J Struct Biol 168:419-425 doi:10.1016/j.jsb.2009.07.006 562
Levard C, Hotze EM, Lowry GV, Brown GE, Jr. (2012) Environmental transformations of silver 563
nanoparticles: impact on stability and toxicity. Environ Sci Technol 46:6900-6914 564
doi:10.1021/es2037405 565
Maity P, Saha B, Kumar GS, Karmakar S (2016) Binding of monovalent alkali metal ions with 566
negatively charged phospholipid membranes. Biochimica Et Biophysica Acta-567
Biomembranes 1858:706-714 doi:10.1016/j.bbamem.2016.01.012 568
Malvern (2004) Zetasizer nano series user manual - MAN0317 Issue 2.1. Malvern Instruments 569
Ltd. 570
Martell AE, Smith RM, Motekaitis RJ (2004) NIST critically selected stability constants of metal 571
complexes v. 8.0. National Institute of Standards and Technology, Gaithersburg, MD, 572
USA 573
Mason RP, Reinfelder JR, Morel FMM (1996) Uptake, toxicity, and trophic transfer of mercury 574
in a coastal diatom. Environ Sci Technol 30:1835-1845 doi:10.1021/es950373d 575
MDDELCC (2016) Suivi de la qualité des rivières et petits cours d'eau. 576
http://www.mddelcc.gouv.qc.ca/eau/eco_aqua/rivieres/annexes.htm#ph. Accessed 27 577
October 2016. 578
Miao AJ, Luo ZP, Chen CS, Chin WC, Santschi PH, Quigg A (2010) Intracellular uptake: A 579
possible mechanism for silver engineered nanoparticle toxicity to a freshwater alga 580
Ochromonas danica. PLoS One 5:e15196 doi:e1519610.1371/journal.pone.0015196 581
Moghadam BY, Hou WC, Corredor C, Westerhoff P, Posner JD (2012) Role of nanoparticle 582
surface functionality in the disruption of model cell membranes. Langmuir 28:16318-583
16326 doi:10.1021/la302654s 584
Nyman CJ, Salazar T (1961) Complex ion formation of mercury(II) and thiosulfate ion. Anal 585
Chem 33:1467-1469 doi:10.1021/ac60179a005 586
Paula S, Volkov AG, VanHoek AN, Haines TH, Deamer DW (1996) Permeation of protons, 587
potassium ions, and small polar molecules through phospholipid bilayers as a function of 588
membrane thickness. Biophys J 70:339-348 doi:10.1016/S0006-3495(96)79575-9 589
Phinney JT, Bruland KW (1994) Uptake of lipophilic organic Cu, Cd, and Pb complexes in the 590
coastal diatom Thalassiosira weissflogii. Environ Sci Technol 28:1781-1790 591
doi:10.1021/es00060a006 592
Reinfelder JR, Chang SI (1999) Speciation and microalgal bioavailability of inorganic silver. 593
Environ Sci Technol 33:1860-1863 doi:10.1021/es980896w 594
Rusciano G, De Luca AC, Pesce G, Sasso A (2009) On the interaction of nano-sized organic 595
carbon particles with model lipid membranes. Carbon 47:2950-2957 596
doi:10.1016/j.carbon.2009.06.042 597
Schecher WD, McAvoy D (2001) MINEQL+: A Chemical Equilibrium Modeling System. 4.62 598
edn. Environmental Research Software, Hallowell, ME, USA 599
Sessa G, Weissmann G (1968) Phospholipid sherules (liposomes) as a model for biological 600
membranes. J Lipid Res 9:310-318 601
Shimanouchi T, Sasaki M, Hiroiwa A, Yoshimoto N, Miyagawa K, Umakoshi H, Kuboi R (2011) 602
Relationship between the mobility of phosphocholine headgroups of liposomes and the 603
hydrophobicity at the membrane interface: A characterization with spectrophotometric 604
measurements. Colloid Surf B-Biointerfaces 88:221-230 605
doi:10.1016/j.colsurfb.2011.06.036 606
Treuel L, Jiang XE, Nienhaus GU (2013) New views on cellular uptake and trafficking of 607
manufactured nanoparticles. J R Soc Interface 10:14 doi:10.1098/rsif.2012.0939 608
Turner A, Mawji E (2004) Hydrophobicity and octanol-water partitioning of trace metals in 609
natural waters. Environ Sci Technol 38:3081-3091 610
Villarreal MR (2007) Cross section of a liposome via wikimedia.org (public property). 611
Wang Q, Lim M, Liu X, Wang Z, Chen KL (2016) Influence of solution chemistry and soft 612
protein corona on the interactions of silver nanoparticles with model biological 613
membranes. Environ Sci Technol 50:2301-2309 doi:10.1021/acs.est.5b04694 614
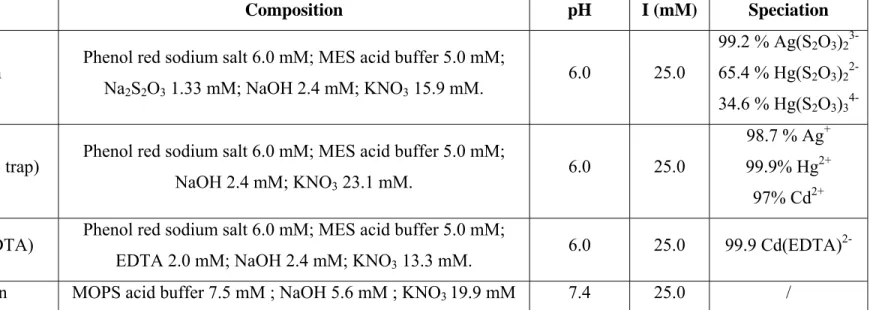
Table 1. Composition of the buffer solutions (ionic strength and speciation calculated using MINEQL+ v.4.6)
Buffer solutions
Composition
pH
I (mM)
Speciation
Internal buffer solution
Phenol red sodium salt 6.0 mM; MES acid buffer 5.0 mM;
Na
2S
2O
31.33 mM; NaOH 2.4 mM; KNO
315.9 mM.
6.0 25.0
99.2 % Ag(S
2O
3)
23-65.4 % Hg(S
2O
3)
22-34.6 % Hg(S
2O
3)
34-Internal buffer solution (w/o trap)
Phenol red sodium salt 6.0 mM; MES acid buffer 5.0 mM;
NaOH 2.4 mM; KNO
323.1 mM.
6.0 25.0
98.7 % Ag
+99.9% Hg
2+97% Cd
2+Internal buffer solution (EDTA)
Phenol red sodium salt 6.0 mM; MES acid buffer 5.0 mM;
EDTA 2.0 mM; NaOH 2.4 mM; KNO
313.3 mM.
6.0 25.0
99.9
Cd(EDTA)
2-Exposure buffer solution
MOPS acid buffer 7.5 mM ; NaOH 5.6 mM ; KNO
319.9 mM
7.4
25.0
/
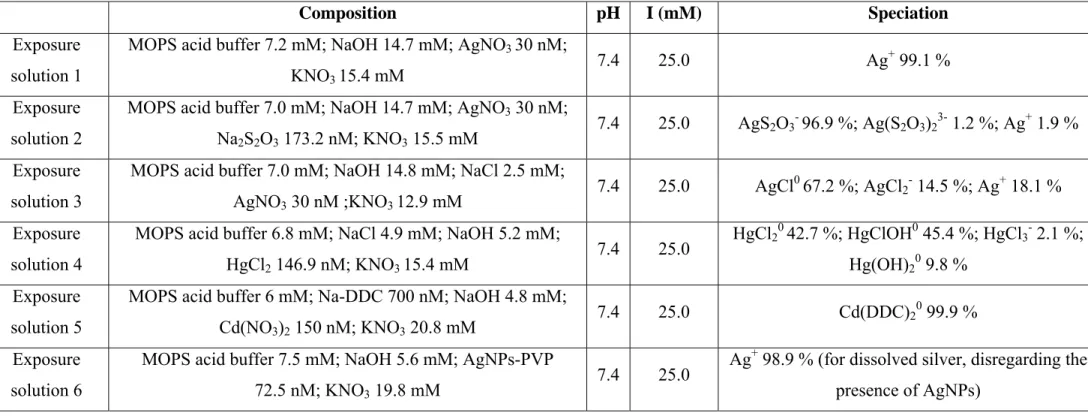
Table 2.
Composition of the exposure solutions, after dilution with the liposome dispersion (ionic strength and speciation calculated using MINEQL+ v.4.6).Composition
pH
I (mM)
Speciation
Exposure
solution 1
MOPS acid buffer 7.2 mM; NaOH 14.7 mM; AgNO
330 nM;
KNO
315.4 mM
7.4 25.0
Ag
+99.1 %
Exposure
solution 2
MOPS acid buffer 7.0 mM; NaOH 14.7 mM; AgNO
330 nM;
Na
2S
2O
3173.2 nM; KNO
315.5 mM
7.4 25.0 AgS
2O
3-96.9 %; Ag(S
2O
3)
23-1.2 %; Ag
+1.9 %
Exposure
solution 3
MOPS acid buffer 7.0 mM; NaOH 14.8 mM; NaCl 2.5 mM;
AgNO
330 nM ;KNO
312.9 mM
7.4 25.0
AgCl
067.2 %; AgCl
2-14.5 %; Ag
+18.1 %
Exposure
solution 4
MOPS acid buffer 6.8 mM; NaCl 4.9 mM; NaOH 5.2 mM;
HgCl
2146.9 nM; KNO
315.4 mM
7.4 25.0
HgCl
2 042.7 %; HgClOH
045.4 %; HgCl
3-2.1 %;
Hg(OH)
209.8 %
Exposure
solution 5
MOPS acid buffer 6 mM; Na-DDC 700 nM; NaOH 4.8 mM;
Cd(NO
3)
2150 nM; KNO
320.8 mM
7.4 25.0
Cd(DDC)
2099.9 %
Exposure
solution 6
MOPS acid buffer 7.5 mM; NaOH 5.6 mM; AgNPs-PVP
72.5 nM; KNO
319.8 mM
7.4 25.0
Ag
+
98.9 % (for dissolved silver, disregarding the
Table 3.
Size distributions of the liposomes, determined by dynamic light scattering, after their synthesis, their transfer to the pH 7.4 buffer solution and their exposure to silver. Mean ± standard deviation.After synthesis (n=4) PdI* = 0.125 ± 0.02
After transfer to the pH 7.4 buffer solution (n=6) PdI* = 0.112 ± 0.005 After exposure to mercury (n=1) PdI* = 0.160 Z-average diameter 161.8 ± 1.6 nm a 151.2 ± 5.6 nmc 142.5 nm Volume mean diameter 173.0 ± 2.0 nm b 152.0 ± 6.0 nmc 144.1 nm
*PdI : Polydispersity Index
Figure 1. Cross section of a liposome (Villarreal 2007) a) and potential metal localizations after interaction with the liposomes: A. in the bulk solution, B. adsorbed at the surface of the liposomes, C. inside the lipid bilayer, D. adsorbed at the surface of the liposome in the inner solution, E. in the internal solution before b) and after c) treatment with Ambersep GT74 resin. (B) in Figure 1c) : The Ambersep GT74 resin may not be 100% efficient in removing metal adsorbed at the surface of the liposomes.
c) b)
Volume (mL) 0-10 10-20 20-30 30-40 40-50 50-60 60-70 70-75 75-80 80-90 90-100 1 00-110 1 10-120 1 20-130 1 30-140 1 40-150 1 50-160 1 60-170 1 70-180 1 80-190 1 90-200 2 00-210 2 10-220 2 20-230 2 30-240 2 40-250 2 50-260 2 60-270 2 70-280 2 80-290 2 90-300 3 00-310 3 10-320 A b s o rban c e ( 432 n m ) 0.0 0.5 1.0 1.5 2.0 2.5
LUVs fraction Internal buffer solution
Figure 2. Presence of liposomes as determined by absorbance at 432 nm after the transfer of the liposomes to the pH 7.4 buffer solution. Liposomes were separated from the buffer solution by size exclusion chromatography. Eluant was collected in 10 mL fractions. Mean ± standard deviation (n=3).
0 20 40 60 80 100 µ m ol H g / g P 0 50 100 150 200 250 0 20 40 60 80 100 µm o l A g / g P 0 10 20 30 40 50 0 20 40 60 80 100 µ m ol A g / g P 0 10 20 30 40 50 Time (min) 0 20 40 60 80 100 µ m ol A g / g P 0 10 20 30 40 50 Time (min) 0 20 40 60 80 100 µ m ol A g / g P 0 10 20 30 40 50 Time (min) 0 20 40 60 80 100 µ m ol C d / g P 0 10 20 30 40 50 Figure 3. Accumulation of a) Ag+ b) HgCl
20 c) AgS2O3- d) AgS2O3- (without internal metal trap) e) AgCl0 f) Cd(DDC)20 by
liposomes over time, corrected for the residual quantity of dissolved metal. Mean ± standard deviation (n=3). No statistically significant increase observed for a) b) d) and f) (non-linear regression, p > 0.05).
a) c) e) b) d) f)
Fractions (mL)
0-2 0 20 -40 40 -60 60 -70 70 -80 80-1 00 10 0 -1 2 0 12 0 -1 4 0 14 0 -1 6 0 16 0 -1 8 0 18 0 -2 0 0 20 0 -2 2 0 22 0 -2 4 0 24 0 -2 6 0 26 0 -2 8 0 28 0 -3 0 0 30 0 -3 2 0 32 0 -3 4 0log c
p
m
/m
L
0 2 4 6 8 10A
b
s
o
rban
c
e
(
432 n
m
)
0.0 0.2 0.4 0.6 0.8 1.0 1.2 1.4 1.6 1.8 log cpm/mL AbsorbanceFigure 4. Presence of liposomes as determined by absorbance at 432 nm and tritium activity determined in each fraction collected from a steric exclusion column. Mean ± standard deviation (n=2).
Time (min)
0 20 40 60 80 100 120D
is
s
o
lve
d
Ag
/ T
o
ta
l Ag
(
%
)
0 20 40 60 80 100 Dissolved Ag / Total Ag (%)[Ag
] (
µ
g
/L
)
0 2 4 6 8 Dissolved Ag (µg/L) Total Ag (µg/L)Figure 5. Oxidation of AgNPs as a function of time in exposure solution 6 (MOPS acid buffer 7.5 mM ; NaOH 5.6 mM ; AgNPs-PVP 72.5 nM ; KNO3 19.8 mM) and in the presence of liposomes. Mean ± standard deviation (n = 3). A
Time (min)
0
20
40
60
80
100
120
µ
m
ol
A
g
/
g P
20
40
60
80
100
120
140
160
180
200
Figure 6. Accumulation of Ag by liposomes over time when exposed to AgNPs. The horizontal line corresponds to the residual quantity of dissolved metal. Mean ± standard deviation (n=3). Each set of symbols corresponds to one experiment. No statistically significant increase observed (linear and non-linear regression : exponential rise to maximum, Boullemant et al. (2009)).