Assessing the risks associated with metals that change speciation and/or form precipitates under natural environmental conditions – comparison of chemical equilibrium models
Project ILETAP-1/solubility
Ronny Blust, University of Antwerp, Department of Biology, Antwerp, Belgium and
Peter Campbell and Claude Fortin, INRS Eau, Terre et Environnement, Québec, QC, Canada
Report to «Ecotoxicity Technical Assessment Panel (ETAP)»
Final (10 March 2010)
Table of Contents
1 Introduction ... 1 1.1 Background ... 1 1.2 Chemical equilibrium modeling ... 1 2 Objective ... 2 3 Methodology ... 2 3.1 Overall approach ... 2 3.2 Chronology of the simulations ... 3 4 Results ... 3 4.1 Screening simulations ... 3 4.2 Simulations with the complete OECD medium ... 4 5 Discussion... 5 5.1 Choice of solid phases ... 5 5.2 Comparison among models ... 5 6 Conclusions ... 6 7 Bibliography ... 7 8 Appendix ... 191 Introduction
1.1 BackgroundThe issue of how to assess the risks associated with metals that change speciation and/or form precipitates under natural environmental conditions was discussed at the 2009 ETAP meeting in Ann Arbor, MI, USA. In particular, the panel was asked to consider the following question:
(a) What is/are the most appropriate method(s) to conduct aquatic toxicity testing with these metals in freshwater and seawater? (b) Under what situations is it appropriate to test at concentrations above solubility?
In response, the panel members to whom this issue was assigned (Peter Campbell and Ronny Blust) suggested that the logical first step would be to perform equilibrium calculations with a chemical equilibrium model and determine the maximum predicted solubility of the metal of interest in the test medium.
In anticipation of this response, the sponsors had formulated a second question:
(c) Which geochemical model should be used to predict the dissolved and particulate metal species in the freshwater? Please discuss the reliability of the model.
There is no shortage of models for this task (Turner 1995). The available models differ in how the water quality data are entered, how the data are processed, and how the results of the equilibrium calculations are presented. More importantly, the default thermodynamic data used for the calculations (i.e., the solubility products and the complexation constants that are included in the model’s database) may differ from one model to another – see Appendix, Table A-1, comparing some of the more popular models. During the subsequent discussion at the ETAP meeting, it was suggested that it would be useful to complete the information in Table A-1 by comparing model predictions for the metals of concern and for a number of standard toxicity testing media. The present project was carried out in this context.
1.2 Chemical equilibrium modeling
Chemical equilibrium models such as those presented in Table A-1 take into account the various
reactions in which metal cations can participate. Examples include complexation reactions, oxidation and reduction reactions, and precipitation reactions:
complexation reactions, e.g.
3 2
Fe HO FeOH
precipitation reactions, e.g.
3
3
Fe 3HO Fe(OH) (s)
oxidation-reduction reactions, e.g.
2 1 3
Fe e Fe
In addition, the models can be set up to take into account gas exchanges between the atmosphere and the aqueous solution:
gas exchanges, e.g.
1
2 2 2 3 3
CO H O H CO H HCO
The models do not consider just one cation, but rather are able to solve the equilibrium equations simultaneously for all the cations and anions in solution. The process of solving chemical equilibrium
problems involves the following steps (Schecher and McAvoy 2001): (i) selection of the chemical
components that will define the system; (ii) definition of the chemical species that can be formed by these components; (iii) setting the total concentrations of the individual components; and (iv) solving the
simultaneous equilibria. To perform these calculations, the model needs the equilibrium constant for each of the reactions to be considered; for each model, these constants are normally supplied as part of a default thermodynamic database that comes with the software package. Normally these constants are given for dilute solution (I = ionic strength 0, T=298 K), and the model then “corrects” the constants to take into account the true ionic strength and temperature of the solution and the effect of the ionic strength and temperature on the activity coefficients of the cations and ions present in solution (some models allow for the introduction of thermodynamic constants at a given condition, so that the user does not have to correct for infinite dilution as it is done by the software). To run the model, one must furnish the total concentrations of each cation and anion, including those that do not interact with the metal of interest but nevertheless affect the overall ionic strength of the solution (e.g., Ca. Mg, Na, K). In addition, one normally fixes the pH, the redox potential and the temperature of the solution. Note that 25 oC is the reference temperature used for the thermodynamic data; choosing a temperature other than 25 oC would require having ΔH and ΔS values for the various (precipitation) reactions – these latter data are not widely available.
For a given aqueous solution, each model should in principle yield the same results. When this is not the case, the differences in predictions from one model to another can normally be traced to differences in the underlying thermodynamic data (e.g., the solubility product for a particular precipitation reaction may differ from one model to another). In addition, the models may differ in how they correct the equilibrium constants as a function of ionic strength; for concentrated solutions these differences may yield different equilibrium concentrations (e.g., relatively simple ionic strength correction models such as the Davies equation should in principle only be applied to dilute waters).
It is important to emphasize that the models that we are comparing are equilibrium models (i.e., they do not consider the kinetics of the various reactions). This constraint is usually ignored for complexation reactions (which are usually relatively fast for monovalent and divalent metals), but in the present project we are specifically interested in precipitation reactions, which may be (very) slow if the necessary
nucleation sites are scarce or absent (Stumm 1992). In addition, for a given combination of metal + anion, the solubility of the resulting solid phase will tend to decrease as the solid ages and becomes more crystalline. In other words, kinetics must be considered not only for the initial precipitation reaction, but also for the subsequent ageing reactions. The thermodynamic databases furnished with the models often include several mineral phases involving the same cations but which differ in their solubility products and also in their kinetics of formation. Therefore the results of the equilibrium speciation calculations will depend on the mineral phases being considered.
2 Objective
In this project, using the composition of several standard toxicity testing media as input data and
employing several different chemical equilibrium models, we set out to determine the predicted maximum solubility of the metals of concern and to identify the solid phase(s) predicted to limit their solubility.
3 Methodology
3.1 Overall approachWe have used off-the-shelf versions of three chemical equilibrium models (MINEQL+ v.4.6, Visual-MINTEQ 2.61, and PHREEQC Interactive v.2.15.0.2697). Two standard, unbuffered freshwater toxicity testing media were used as the matrices for the trials (OECD 201 medium for toxicity testing; U.S. EPA «Very Soft Water») (Table 1). Metal “titrations” were performed with each model; a single metal was added individually to the medium under study, the concentration at which the solubility limit for the metal was exceeded was determined, and the solid phase predicted to precipitate was identified.
The studied metals included Al(III), Fe(III), Pb(II), Sn(II) and Sn(IV). The metals were added individually (not as mixtures) and the simulations were carried out at pH 6, 7 and 8, in systems open to the
atmosphere (i.e., CO2 exchange or CO2 and O2 exchange in the case of PHREEQC) and at 25 oC. Unless
otherwise indicated, oxidation-reduction reactions were not included in the simulations of the two redox-sensitive metals (Fe and Sn).
The metals were added without any anion, so the matrix corresponds exactly to the test medium, except that since the simulations were run “open to the atmosphere”, in equilibrium with atmospheric CO2, HCO3
-and CO32- anions were present in the solution. The total metal concentrations were normally in the range
10-5 to 10-3 M; we would start at the lower end, and if no precipitate was predicted, the metal
concentration would be increased until an oversaturated condition was reached. 3.2 Chronology of the simulations
The initial simulations were run on the two test media that were originally supplied by the ETAP sponsors (Table 1). The MINEQL simulations were run first, allowing all solid phases present in the MINEQL database to precipitate if they exceeded their solubility limit. In this way, one can identify the least soluble of the solid phases (i.e., the first to precipitate). These least soluble phases are the most highly crystalline ones (e.g. hematite in the case of ferric iron), and they are unlikely to form during the relatively short water retention time of a typical toxicity test. Accordingly, we removed one phase at a time from MINEQL (the software allows you to “ignore” a particular solid phase) and re-ran the simulations.
Once the MINEQL runs were completed, we switched to Visual MINTEQ and PHREEQC. Each metal was again run separately. From the initial menu of Visual MINTEQ (“Solid phases and excluded species”), we chose all the solid phases that were listed for a given metal, and that were possible given the composition (cations, anions) of the test medium. From the initial menu of PHREEQC Interactive (“Equilibrium
Phases”), we chose all the solid phases that were listed for a given metal, and that were possible given the composition (cations, anions) of the test medium. As before, we progressively eliminated one solid phase at a time, moving from the least soluble to the most soluble. Within PHREEQC there are several databases to choose from. The current simulations were run using the default phreeqc.dat database, except in case of Sn, which is not included in this database. Simulations with Sn were run using the llnl.dat database. Note that the type and number of species considered by the different databases can be very different and that calculations using the same model platform but a different database may give different results. The simulations using Visual Minteq were done independently by the Québec and Antwerp groups to verify internal consistency.
4 Results
4.1 Screening simulations Predicted solid phases
The results of the equilibrium calculations for the simplified OECD medium and for the US EPA medium are presented in Tables 2 to 6. In each table the results are arranged in a vertical order, from the least soluble solid phase to the most soluble (e.g., for ferric iron the first phase is hematite and the last is jarrosite). Visual MINTEQ allows the user to check the saturation index for the solid phases, and in virtually every case the solid phase that was predicted to precipitate was the same in MINTEQ and MINEQL (the only exceptions were for Fe(III), where MINTEQ includes both ferrihydrite and aged ferrihydrite but MINEQL only includes ferrihydrite, and for Sn(II), where the order of SnO and Sn(OH)2
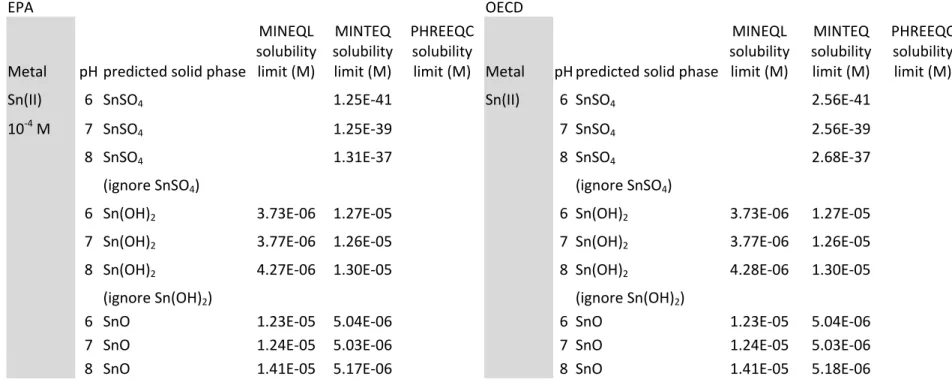
precipitation was different with the two models). In the case of PHREEQC, more important differences existed and these differences depended on the database used with PHREEQC (e.g., the default phreeqc.dat or another one such as llnl.dat). The screening simulations with PHREEQC were run using the default database, except in case of Sn (which is not included as an element in phreeqc.dat). With reference to Sn(II), there was a problem with the sulphate SnSO4(s), which according to MINTEQ
and MINEQL is exceedingly insoluble; MINEQL refused to run the simulations with SnSO4, citing a
solubility product for SnSO4 (log Kso = -55.47) and a search of the relevant literature indicated that this
value appears to be to be suspicious. No solubility constants are available in recent critically reviewed compilations for this solid (Duro et al. 2006; Séby et al. 2001). Moreover, empirical data suggest that SnSO4(s) is a highly soluble salt (e.g., solubility of 330 g/L;
http://www.chemblink.com/products/7488-55-3.htm). PHREEQC was run under conditions allowing redox changes, and the model predicted the absence of Sn(II) under O2 saturated conditions (i.e., in solutions equilibrated with the atmosphere).
Tin(IV) was predicted to precipitate as cassiterite (SnO2); removal of cassiterite as a possible solid did not
result in the precipitation of another mineral phase included in the llnl.dat database. pH dependence
Given the similarity of the predicted solid phases, the pH dependence of the calculated maximum solubilities followed the same trends for the three models. For example, the solubility of Al and Sn(IV) consistently increased over the pH range 678, whereas the iron oxyhydroxide phases and lead decreased in solubility over the same pH range; in contrast, Sn(II) solubility was relatively insensitive to pH changes. PHREEQC predicted that the solubility of Sn(IV) was independent of pH within the simulation range.
Comparison of the results for the two test media
The US EPA medium is more dilute than the standard OECD medium (concentrations of Ca, Mg, Na, K and Cl are all lower in the EPA very soft water; SO4 is the only ion present at higher concentration). When
the predicted solid phase is a hydroxide or oxide, the metal concentration in solution is normally a
function of pH but is not affected by the composition of the medium. Indeed, as indicated in Tables 2 to 6, the predicted solubilities of the five cations are virtually identical for the two media. However, when the predicted solid phase involves sulphate (e.g., some of the cases with Al and Fe), there is only a finite amount of sulphate available in the test medium; if all the sulphate precipitates, then the solubility control over the metal will shift to a second solid phase. Similar results are obtained if the predicted solid phase involves chloride (one case with Fe).
4.2 Simulations with the complete OECD medium
Based on the results of the initial simulations and the known geochemistry of the four metals, we selected the solid phases most likely in our judgement to form under the conditions of a typical aquatic toxicity test (Table 7). We then reran the MINEQL and MINTEQ simulations1, with these phases specified as the “controlling” solids and using a more complete version of the OECD TG 201 medium (which included oligo-elements, phosphate, ammonia and EDTA (ethylenediamine-tetraacetate)). The results of these simulations with the complete OECD medium can be found in Tables 8a, b and c. While running these latter simulations, we also checked the redox equilibrium between the two tin species, Sn(II) and Sn(IV); in the presence of O2, virtually all the Sn(II) should eventually be oxidized to Sn(IV).
The complete OECD TG 201 medium contains low concentrations of EDTA and phosphate. Many phosphates are of limited solubility, and indeed the results from the simulations with the complete medium indicated the potential for precipitation of several of the cations present in the medium (e.g., Ca, Mn and Pb). For the metals of primary interest here, only Pb was predicted to form an insoluble
phosphate precipitate. However, the initial concentration of phosphate was low, and once the phosphate had been removed from solution by precipitation, the Pb concentration was controlled by one or the other of the solid phases indicated in Table 7.2 The EDTA present in the complete OECD medium can
potentially interact with all the cations in solution. The mass balance for EDTA was checked for all the simulations and in some cases (Pb, at all three pH values; Al and Fe at pH 6 and 7) the EDTA did interact with the metals of primary interest and contribute to dissolved metal pool. However, in an aquatic toxicity 1 These simulations were not performed with PHREEQC. The PHREEQC default phreeqc.dat and the llnl.dat databases do not include EDTA, so performing the simulations would have required editing of the database to include this ligand. 2 Note that if the medium were to be used for an algal culture, the precipitation of phosphate would presumably result in an indirect effect on algal growth.
testing framework, these metals bound to EDTA would not be expected to be biologically available (Campbell 1995).
5 Discussion
5.1 Choice of solid phasesAs indicated in the results from the screening simulations, the databases for the off-the-shelf versions of the models contain a great variety of solid phases, many of which are highly crystalline and are unlikely to form under toxicity test conditions (this is especially true for the MINEQL and MINTEQ databases, and also for some of the PHREEQC databases; for example, e.g. the phreeqc.dat database contains many fewer mineral phases than the llnl.dat database).
As a result, the models yield vastly different predictions of maximum solubilities in a given medium, depending upon the precipitate that is chosen as the controlling solid phase. For example, for the runs at pH 7 and for all metals except Pb, the differences between the least soluble solid phase and the most soluble solid phase are large (e.g., 104 to 106; see Tables 2 to 6, and the summary text table below), meaning that some geochemical knowledge/intuition is needed if the “proper” phase is to be chosen.
OECD Calculated solubilities (M) at pH 7
Metal MINEQL MINTEQ PHREEQC
minimum maximum minimum maximum minimum maximum Al(III) 1.78×10⁻⁹ 1.50×10⁻⁵ 9.69×10⁻¹⁰ 8.19×10⁻⁶ 3.15x10⁻⁸ 1.54x10⁻⁵
Fe(III) 5.72×10⁻¹³ 4.55×10⁻⁹ 3.64×10⁻¹⁴ 2.95×10⁻¹⁰ 4.96x10⁻¹⁵ 3.90x10⁻⁸ Pb(II) 2.25×10⁻⁶ 5.69x10⁻⁴ 2.17×10⁻⁶ 1.86x10⁻³ 2.73x10⁻⁶ 5.39x10⁻⁶ Sn(IV) 1.25×10⁻¹⁵ 6.19×10⁻⁹ 1.25×10⁻¹⁵ 6.18×10⁻⁹ 2.89x10⁻⁸ 2.89x10⁻⁸
Sn(II) 3.77x10⁻⁶ 1.24×10⁻⁵ 2.56×10-39 5.03×10⁻⁶
As mentioned earlier (pp.3-4), the highlighted value for Sn(II) is considered to be erroneous.
In Table 7 we have presented the solid phases most likely in our judgement to form under the conditions of a typical aquatic toxicity test. However, it must be emphasized that the use of equilibrium models in this context implies that precipitation kinetics are reasonably rapid. As mentioned in the Introduction, the kinetics of precipitation reactions are however highly variable. For example, if acidic solutions containing Al are slowly neutralized by base addition, the resulting oversaturated solutions may remain in a
metastable state for months (Hem and Smith 1972), whereas if alkaline solutions containing Al are neutralized by acid addition, equilibrium is achieved much more rapidly (Roy et al. 2000). Therefore, if a metal is predicted to precipitate within the concentration range that will be used for toxicity testing, abiotic trials should be run to determine the rate of precipitation under the conditions to be used for the toxicity test.
5.2 Comparison among models
In the second set of simulations, we restrained the number of solid phases to those indicated in Table 7 and reran the simulations with the complete OECD TG 201 medium. When a given solid phase is specified, the models do not always yield the same numerical result (Tables 8a, b and c). The most obvious reason for these differences among models would be the use of different solubility products for the solid phases, and this is the case for some of the precipitates (see Table 9: gibbsite, PbCO3(s) and
Sn(OH)2(s)). However, in some cases there are also differences even when the solubility products are
identical (e.g., amorphous Al(OH)3, for which the same constant is listed for MINEQL and MINTEQ, yet
the predicted Al solubilities differ). These differences are presumably due to differences in the calculated speciation for the dissolved phase. For example, if in the case of Al the complexation constants for the
formation of the various hydroxo-complexes (KAlOH, KAl(OH)2, KAl(OH)3) differ among the models, then the
precipitation equilibrium will also be perturbed even if the solubility products are identical.
6 Conclusions
Most of the current chemical equilibrium models include databases with compilations of solid phases showing very different solubilities. Some of these may well form under toxicity test scenarios but others will not. Some of the solid phases may have very low solubility products and therefore result in very low predicted metal solubilities.
Consequently it is essential to use chemical equilibrium models carefully. The off-the-shelf versions of the models should not be used blindly, particularly with respect to the solid phases present in their default thermodynamic database. The modeller should select those solid phases most likely to form under the toxicity test conditions. This may not always be straightforward and before toxicity tests are initiated, experimental verification may be necessary.
If a metal is predicted to precipitate within the concentration range that will be used for toxicity testing, abiotic trials should be run to determine the rate of precipitation under the conditions to be used for the toxicity test.
Today little experimental information is available concerning the formation of solid phases and the precipitation of metals under toxicity testing scenarios. Such information would be most valuable to determine the real solubility limits for a range of metals. On the basis of these results the solid phases controlling the solubilities could be identified and included in a metal speciation database intended for modeling metal speciation and precipitation under toxicity testing scenarios.
The consensus model of choice would be Visual MINTEQ: it is easy to use, inexpensive, and if necessary it can be used to model interactions with natural organic matter (NOM = fulvic and humic acids).
7 Bibliography
Allison, J.D., Brown, D.S., and Novo-Gradac, K.J. 1991. MINTEQA2/PRODEFA2, A geochemical assessment model for environmental systems: Version 3.0 User's Manual. Environmental
Research Laboratory, Office of Research and Development, U.S. Enviromental Protection Agency, EPA/600/3-91/021, Athens, GA, USA, 107 p.
Campbell, P.G.C. 1995. Interactions between trace metals and organisms: a critique of the free-ion activity model. In Metal Speciation and Bioavailability in Aquatic Systems. Edited by A. Tessier and D.Turner. J. Wiley & Sons, Chichester, UK, pp. 45-102.
Duro, L., Grivé, M., Cera, E., Domènech, C., and Bruno, J. 2006. Update of a thermodynmaic database for radionuclides to assist solubility limit calculation for performance assessment. Swedish Nuclear Fuel and Waste Management Company, TR-06-17, Stockholm, Sweden, 129 p.
Dzombak, D.A. and Morel, F.M.M. 1990. Surface complexation modeling. Hydrous ferric oxide. J. Wiley & Sons Inc., New York, NY, USA, 393 p.
Hem, J.D. and Smith, R.W. 1972. Effect of aging on aluminum hydroxide complexes in dilute aqueous solutions. US Geological Survey, Water Supply Paper No. 1827 D,
Parker, D.R., Norvell, W.A., and Chaney, R.L. 1995. GEOCHEM-PC - a chemical speciation program for IBM and compatible personal computers. In Chemical equilibrium and reaction models. Soil Science Society of America, Madison, pp. 253-269.
Parkhurst, D.L. and Appelo, C.A.J. 1999. User's guide to PHREEQC (version 2), A computer program for speciation, batch-reaction, one-dimensional transport and inverse geochemical calculations. U.S. Geological Survey, Water-Resources Investigations Report 99-4295, Denver, Colorado, USA, 312 p.
Roy, R.R., Campbell, P.G.C., Prémont, S., and Labrie, J. 2000. Geochemistry and toxicity of Al in the Saguenay River, Québec, in relation to discharges from an aluminum smelter. Environ. Toxicol. Chem. 19: 2457-2466.
Schecher, W.D. and McAvoy, D. 2001. MINEQL+: A Chemical Equilibrium Modeling System. (4.6). Hallowell, ME, USA, Environmental Research Software.
Schecher, W.D. and McAvoy, D.C. 1992. MINEQL+: a software environment for chemical equilibrium modeling. Comput. Environ. Urban Syst. 16: 65-76.
Séby, F., Potin-Gauthier, M., Giffault, E., and Donard, O.F.X. 2001. A critical review of the thermodynamic data for inorganic tin species. Geochim. Cosmochim. Acta 65: 3041-3053.
Serkiz, S.M., Allison, J.D., Perdue, E.M., Allen, H.E., and Brown, D.S. 1996. Correcting errors in the thermodynamic database for the equilibrium speciation model MINTEQA2. Wat. Res. 30: 1930-1933.
Stumm, W. 1992. Precipitation and Nucleation. In Chemistry of the Solid-Water Interface: Processes at the mineral-water and particle-water interface in natural systems. J. Wiley & Sons Ltd., New York, NY, USA, pp. 211-242.
Turner, D.R. 1995. Problems in trace metal speciation modeling. In Metal Speciation and Bioavailability in Aquatic Systems. Edited by A. Tessier and D.Turner. J. Wiley & Sons, Chichester, UK, pp. 149-203.
Table 1: Composition of the aquatic toxicity test media used for the solubility simulationsa. A: Initial simulations
EPA Very Soft Water OECD test medium - simplified
Concentration Concentration Component (mg/L) (mM) Component (mg/L) (mM) Na 3.3 0.1435 Na 13.7 0.5959 K 0.3 0.0077 K 0.7 0.0179 Mg 1.5 0.0617 Mg 2.9 0.1193 Ca 1.7 0.0424 Ca 4.9 0.1223 Cl 0.2 0.0056 Cl 23 0.6487 SO4 10.2 0.1062 SO4 5.8 0.0604
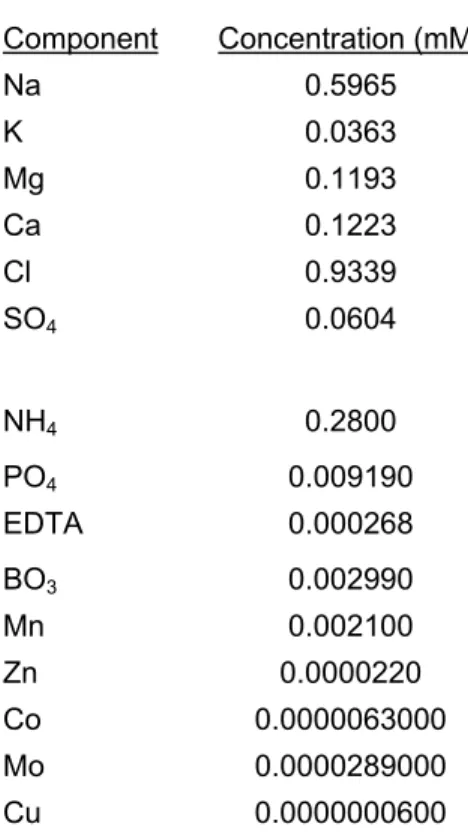
B: Final simulations OECD TG 201 (with trace constituents) Component Concentration (mM) Na 0.5965 K 0.0363 Mg 0.1193 Ca 0.1223 Cl 0.9339 SO4 0.0604 NH4 0.2800 PO4 0.009190 EDTA 0.000268 BO3 0.002990 Mn 0.002100 Zn 0.0000220 Co 0.0000063000 Mo 0.0000289000 Cu 0.0000000600
a The concentrations shown in these tables are those provided by the ETAP sponsors.
Some of the concentrations provided by the sponsors are slightly different than those in the original OECD and US EPA documents, presumably due to arithmetic rounding. However, the effects of these concentration differences on the simulation results are negligible.
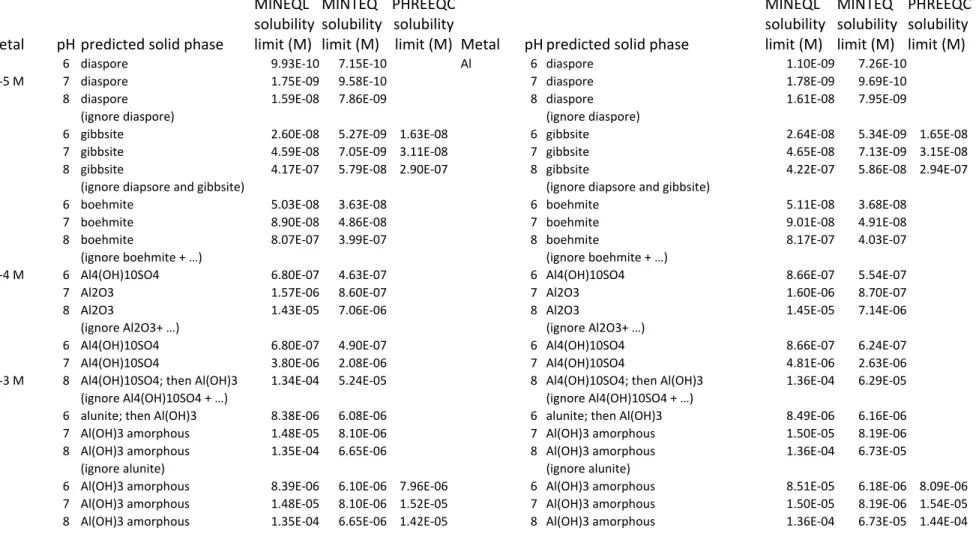
Table 2: Comparison of predicted solubilities of Al in the U.S. EPA medium and the simplified OECD medium. EPA OECD Metal pH predicted solid phase MINEQL solubility limit (M) MINTEQ solubility limit (M) PHREEQC solubility
limit (M) Metal pH predicted solid phase
MINEQL solubility limit (M) MINTEQ solubility limit (M) PHREEQC solubility limit (M)
Al 6 diaspore 9.93E‐10 7.15E‐10 Al 6 diaspore 1.10E‐09 7.26E‐10
10‐5 M 7 diaspore 1.75E‐09 9.58E‐10 7 diaspore 1.78E‐09 9.69E‐10
8 diaspore 1.59E‐08 7.86E‐09 8 diaspore 1.61E‐08 7.95E‐09
(ignore diaspore) (ignore diaspore)
6 gibbsite 2.60E‐08 5.27E‐09 1.63E‐08 6 gibbsite 2.64E‐08 5.34E‐09 1.65E‐08
7 gibbsite 4.59E‐08 7.05E‐09 3.11E‐08 7 gibbsite 4.65E‐08 7.13E‐09 3.15E‐08
8 gibbsite 4.17E‐07 5.79E‐08 2.90E‐07 8 gibbsite 4.22E‐07 5.86E‐08 2.94E‐07
(ignore diapsore and gibbsite) (ignore diapsore and gibbsite)
6 boehmite 5.03E‐08 3.63E‐08 6 boehmite 5.11E‐08 3.68E‐08
7 boehmite 8.90E‐08 4.86E‐08 7 boehmite 9.01E‐08 4.91E‐08
8 boehmite 8.07E‐07 3.99E‐07 8 boehmite 8.17E‐07 4.03E‐07
(ignore boehmite + …) (ignore boehmite + …)
10‐4 M 6 Al4(OH)10SO4 6.80E‐07 4.63E‐07 6 Al4(OH)10SO4 8.66E‐07 5.54E‐07
7 Al2O3 1.57E‐06 8.60E‐07 7 Al2O3 1.60E‐06 8.70E‐07
8 Al2O3 1.43E‐05 7.06E‐06 8 Al2O3 1.45E‐05 7.14E‐06
(ignore Al2O3+ …) (ignore Al2O3+ …)
6 Al4(OH)10SO4 6.80E‐07 4.90E‐07 6 Al4(OH)10SO4 8.66E‐07 6.24E‐07
7 Al4(OH)10SO4 3.80E‐06 2.08E‐06 7 Al4(OH)10SO4 4.81E‐06 2.63E‐06
10‐3 M 8 Al4(OH)10SO4; then Al(OH)3 1.34E‐04 5.24E‐05 8 Al4(OH)10SO4; then Al(OH)3 1.36E‐04 6.29E‐05
(ignore Al4(OH)10SO4 + …) (ignore Al4(OH)10SO4 + …)
6 alunite; then Al(OH)3 8.38E‐06 6.08E‐06 6 alunite; then Al(OH)3 8.49E‐06 6.16E‐06
7 Al(OH)3 amorphous 1.48E‐05 8.10E‐06 7 Al(OH)3 amorphous 1.50E‐05 8.19E‐06
8 Al(OH)3 amorphous 1.35E‐04 6.65E‐06 8 Al(OH)3 amorphous 1.36E‐04 6.73E‐05
(ignore alunite) (ignore alunite)
6 Al(OH)3 amorphous 8.39E‐06 6.10E‐06 7.96E‐06 6 Al(OH)3 amorphous 8.51E‐05 6.18E‐06 8.09E‐06
7 Al(OH)3 amorphous 1.48E‐05 8.10E‐06 1.52E‐05 7 Al(OH)3 amorphous 1.50E‐05 8.19E‐06 1.54E‐05
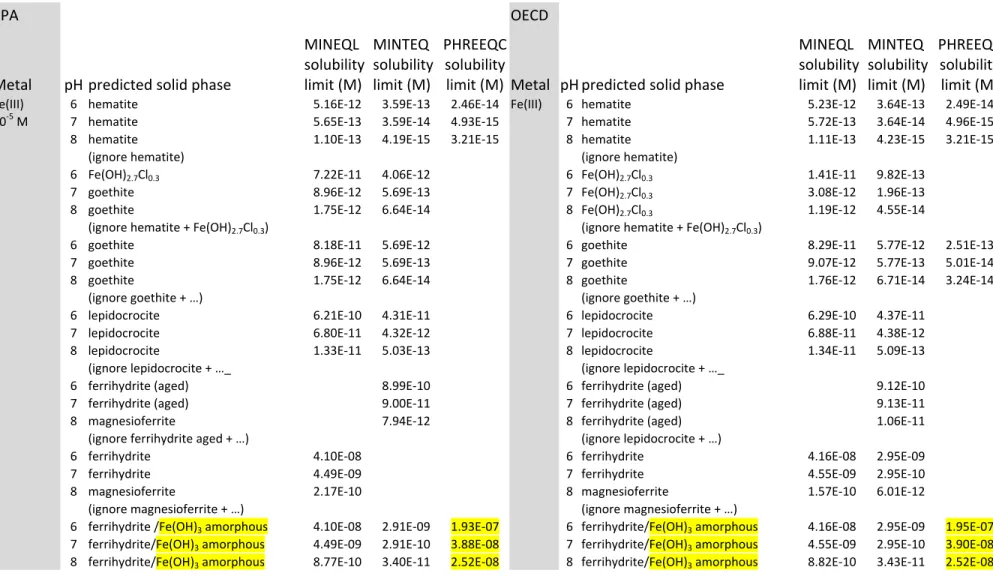
Table 3 : Comparison of predicted solubilities of Fe(III) in the U.S. EPA medium and the simplified OECD medium. EPA OECD Metal pH predicted solid phase MINEQL solubility limit (M) MINTEQ solubility limit (M) PHREEQC solubility
limit (M) Metal pH predicted solid phase
MINEQL solubility limit (M) MINTEQ solubility limit (M) PHREEQC solubility limit (M)
Fe(III) 6 hematite 5.16E‐12 3.59E‐13 2.46E‐14 Fe(III) 6 hematite 5.23E‐12 3.64E‐13 2.49E‐14
10‐5 M 7 hematite 5.65E‐13 3.59E‐14 4.93E‐15 7 hematite 5.72E‐13 3.64E‐14 4.96E‐15
8 hematite 1.10E‐13 4.19E‐15 3.21E‐15 8 hematite 1.11E‐13 4.23E‐15 3.21E‐15
(ignore hematite) (ignore hematite)
6 Fe(OH)2.7Cl0.3 7.22E‐11 4.06E‐12 6 Fe(OH)2.7Cl0.3 1.41E‐11 9.82E‐13
7 goethite 8.96E‐12 5.69E‐13 7 Fe(OH)2.7Cl0.3 3.08E‐12 1.96E‐13
8 goethite 1.75E‐12 6.64E‐14 8 Fe(OH)2.7Cl0.3 1.19E‐12 4.55E‐14
(ignore hematite + Fe(OH)2.7Cl0.3) (ignore hematite + Fe(OH)2.7Cl0.3)
6 goethite 8.18E‐11 5.69E‐12 6 goethite 8.29E‐11 5.77E‐12 2.51E‐13
7 goethite 8.96E‐12 5.69E‐13 7 goethite 9.07E‐12 5.77E‐13 5.01E‐14
8 goethite 1.75E‐12 6.64E‐14 8 goethite 1.76E‐12 6.71E‐14 3.24E‐14
(ignore goethite + …) (ignore goethite + …)
6 lepidocrocite 6.21E‐10 4.31E‐11 6 lepidocrocite 6.29E‐10 4.37E‐11
7 lepidocrocite 6.80E‐11 4.32E‐12 7 lepidocrocite 6.88E‐11 4.38E‐12
8 lepidocrocite 1.33E‐11 5.03E‐13 8 lepidocrocite 1.34E‐11 5.09E‐13
(ignore lepidocrocite + …_ (ignore lepidocrocite + …_
6 ferrihydrite (aged) 8.99E‐10 6 ferrihydrite (aged) 9.12E‐10
7 ferrihydrite (aged) 9.00E‐11 7 ferrihydrite (aged) 9.13E‐11
8 magnesioferrite 7.94E‐12 8 ferrihydrite (aged) 1.06E‐11
(ignore ferrihydrite aged + …) (ignore lepidocrocite + …)
6 ferrihydrite 4.10E‐08 6 ferrihydrite 4.16E‐08 2.95E‐09
7 ferrihydrite 4.49E‐09 7 ferrihydrite 4.55E‐09 2.95E‐10
8 magnesioferrite 2.17E‐10 8 magnesioferrite 1.57E‐10 6.01E‐12
(ignore magnesioferrite + …) (ignore magnesioferrite + …)
6 ferrihydrite /Fe(OH)3 amorphous 4.10E‐08 2.91E‐09 1.93E‐07 6 ferrihydrite/Fe(OH)3 amorphous 4.16E‐08 2.95E‐09 1.95E‐07
7 ferrihydrite/Fe(OH)3 amorphous 4.49E‐09 2.91E‐10 3.88E‐08 7 ferrihydrite/Fe(OH)3 amorphous 4.55E‐09 2.95E‐10 3.90E‐08
Table 4: Comparison of predicted solubilities of Pb(II) in the U.S. EPA medium and the simplified OECD medium. EPA OECD Metal pH predicted solid phase MINEQL solubility limit (M) MINTEQ solubility limit (M) PHREEQC solubility
limit (M) Metal pH predicted solid phase
MINEQL solubility limit (M) MINTEQ solubility limit (M) PHREEQC solubility limit (M)
Pb 6 larnakite; then Pb(OH)2 1.64E‐04 1.56E‐04 Pb 6 larnakite; then Pb(OH)2 1.77E‐04 1.68E‐04
10‐3 M 7 Pb(OH)2 2.15E‐06 2.08E‐06 10‐3 M 7 Pb(OH)2 2.25E‐06 2.17E‐06
8 Pb(OH)2 1.56E‐07 1.81E‐07 8 Pb(OH)2 1.58E‐07 1.82E‐07
(ignore larnakite) (ignore larnakite)
6 Pb(OH)2 1.71E‐04 1.71E‐04 1.72e‐04 6 Pb(OH)2 1.79E‐04 1.80E‐04 1.80E‐04
7 Pb(OH)2 2.15E‐06 2.20E‐06 2.67e‐06 7 Pb(OH)2 2.25E‐06 2.29E‐06 2.73E‐06
8 Pb(OH)2 1.56E‐07 1.91E‐07 7.21e‐07 8 Pb(OH)2 1.58E‐07 1.93E‐07 7.23E‐07
(remove Pb(OH)2 + …) (ignore Pb(OH)2 + …)
6 hydrocerrusite 1.81E‐04 1.62E‐04 6 hydrocerrusite 1.90E‐04 1.80E‐04
7 hydrocerrusite 2.27E‐06 2.08E‐06 7 hydrocerrusite 2.38E‐06 2.29E‐06
8 hydrocerrusite 1.65E‐07 1.81E‐07 8 hydrocerrusite 1.67E‐07 1.93E‐07
(remove hydrocerrusite + …) (ignore hydrocerrusite + …)
6 anglesite, then cerrusite 4.02E‐04 2.85E‐04 6 cerrusite 4.27E‐04 3.01E‐04 3.57E‐04
7 cerrusite 5.00E‐06 3.64E‐06 7 cerrusite 5.23E‐06 3.80E‐06 5.39E‐06
8 cerrusite 3.64E‐07 3.17E‐07 8 cerrusite 3.67E‐07 3.19E‐07 1.41E‐06
(remove anglesite +…) (ignore cerrusite + …)
6 cerrusite 4.09E‐04 2.87E‐04 3.41E‐04 6 anglesite 9.77E‐04 9.77E‐04
7 cerrusite 5.00E‐06 3.64E‐06 5.20E‐06 7 Pb3O2SO4, Pb2(OH)3Cl 8.37E‐05 7.59E‐04
8 cerrusite 3.64E‐07 3.17E‐07 1.40E‐06 8 Pb2(OH)3Cl 2.23E‐05 9.95E‐05
(remove cerrusite + …) (ignore anglesite + …)
6 anglesite 9.30E‐04 9.29E‐04 10‐2 M 6 Pb3O2SO4, then Pb2(OH)3Cl 8.60E‐03 9.83E‐03
7 Pb3O2SO4, then Pb2OCO3 5.54E‐04 5.05E‐04 7
Pb3O2SO4, then Pb2(OH)3Cl,
then Pb2OCO3 5.69E‐04 1.86E‐03
8 Pb3O2SO4, then Pb2OCO3 3.85E‐05 4.32E‐05 8
Pb4(OH)6SO4, then Pb3O2CO3,
then Pb2OCO3 3.88E‐05 1.06E‐04
(remove anglesite + …)
10‐2 M 6 Pb3O2SO4 9.69E‐03 9.69E‐03
7
Pb4(OH)3SO4, then Pb2(OH)3Cl,
then Pb2OCO3 5.54E‐04 7.37E‐04
Table 5: Comparison of predicted solubilities of Sn(II) in the U.S. EPA medium and the simplified OECD mediuma. EPA OECD Metal pH predicted solid phase MINEQL solubility limit (M) MINTEQ solubility limit (M) PHREEQC solubility
limit (M) Metal pH predicted solid phase
MINEQL solubility limit (M) MINTEQ solubility limit (M) PHREEQC solubility limit (M)
Sn(II) 6 SnSO4 1.25E‐41 Sn(II) 6 SnSO4 2.56E‐41
10‐4 M 7 SnSO4 1.25E‐39 7 SnSO4 2.56E‐39
8 SnSO4 1.31E‐37 8 SnSO4 2.68E‐37
(ignore SnSO4) (ignore SnSO4)
6 Sn(OH)2 3.73E‐06 1.27E‐05 6 Sn(OH)2 3.73E‐06 1.27E‐05
7 Sn(OH)2 3.77E‐06 1.26E‐05 7 Sn(OH)2 3.77E‐06 1.26E‐05
8 Sn(OH)2 4.27E‐06 1.30E‐05 8 Sn(OH)2 4.28E‐06 1.30E‐05
(ignore Sn(OH)2) (ignore Sn(OH)2)
6 SnO 1.23E‐05 5.04E‐06 6 SnO 1.23E‐05 5.04E‐06
7 SnO 1.24E‐05 5.03E‐06 7 SnO 1.24E‐05 5.03E‐06
8 SnO 1.41E‐05 5.17E‐06 8 SnO 1.41E‐05 5.18E‐06
a Note that PHREEQC equilibrated with atmospheric O
Table 6: Comparison of predicted solubilities of Sn(IV) in the U.S. EPA medium and the simplified OECD medium. EPA OECD Metal pH predicted solid phase MINEQL solubility limit (M) MINTEQ solubility limit (M) PHREEQC solubility
limit (M) Metal pH predicted solid phase
MINEQL solubility limit (M) MINTEQ solubility limit (M) PHREEQC solubility limit (M) Sn(IV) 6 SnO2 / cassiterite 1.18E‐17 1.18E‐17 2.89E‐08 Sn(IV) 6 SnO2 1.25E‐17 1.25E‐17
10‐6 M 7 SnO2 / cassiterite 1.19E‐15 1.18E‐15 2.89E‐08 7 SnO2 1.25E‐15 1.25E‐15
8 SnO2 / cassiterite 1.21E‐13 1.21E‐13 2.89E‐08 8 SnO2 1.27E‐13 1.27E‐13
(ignore SnO2) (ignore SnO2)
6 H2Sn(OH)6 3.30E‐12 3.30E‐12 6 H2Sn(OH)6 3.49E‐12 3.49E‐12
7 H2Sn(OH)6 3.31E‐10 3.31E‐10 7 H2Sn(OH)6 3.50E‐10 3.50E‐10
8 H2Sn(OH)6 3.38E‐08 3.39E‐08 8 H2Sn(OH)6 3.55E‐08 3.55E‐08
(ignore SnO2 and H2Sn(OH)6) (ignore SnO2 and H2Sn(OH)6)
6 Sn(OH)4 5.85E‐11 5.84E‐11 6 Sn(OH)4 6.19E‐11 6.17E‐11
7 Sn(OH)4 5.86E‐09 5.85E‐09 7 Sn(OH)4 6.19E‐09 6.18E‐09
Table 7: Compilation of the solid phases judged the most likely to form under the conditions of a typical aquatic toxicity testa with Al(III), Fe(III), Pb(II), Sn(II) or Sn(IV).
Metal Suggested solid phase(s) Explanation/Comments
Aluminum ‐ Microcrystalline gibbsite or amorphous Al(OH)3 1. It is unlikely that any of the more crystalline phases (diaspore, boehmite, etc.) will form during the time span of a typical toxicity test.
Iron(III) ‐ Ferrihydrite (Fe(OH)3 1. See #1 above (hematite, goethite,...)
2. Normally ferrihydrite is the form of Fe(OH)3 that is initially formed on the oxidation of Fe(II) (Dzombak and Morel 1990). Lead ‐ chloropyromorphite (Pb5(PO4)3Cl) or hydroxylpyromorphite (Pb5(PO4)3OH) or Pb3(PO4)2 ‐ Pb(OH)2; Hydrocerrusite (Pb3(OH)2(CO3)2) or Cerrusite (PbCO3) 1. If the test medium contains phosphate, lead phosphate is predicted to precipitate first, followed by the hydroxide and hydroxo‐carbonate forms. 2. At low concentrations, Pb solubility is predicted to be controlled by one of the lead phosphates (arranged in column #2 in order of increasing solubility). 3. As the Pb concentration is increased, eventually virtually of all the phosphate is predicted to precipitate with Pb.b 4. Once the phosphate has precipitated, Pb solubility is will be controlled by the hydroxide and the hydroxo‐ carbonates. The choice among these phases will depend on how likely it is that the system is truly at equilibrium with the atmosphere (CO2). Some media could be undersaturated, others oversaturated with respect to atmospheric CO2. 5. The choice among these three solid phases is not too critical, since [Pb] at equilibrium is similar for all three. Tin(II) ‐ SnO or Sn(OH)2 1. The hydroxide form is likely formed first, followed by
water loss to yield the oxide. However, the choice between these two solid phases is not too critical, since [Sn] at equilibrium is reasonably similar for both phases. Note that MINEQL and MINTEQ seem to invert the stability sequence for the two phases.
Tin(IV) ‐ Sn(OH)4 1. Unlikely that the more crystalline phase (SnO2) will form during the time span of a typical toxicity test.
a Typical conditions = 25 oC; pH 6, 7 or 8; open to the atmosphere (O
2, CO2) – see Section 3.1 b The molar concentration of phosphate is 9.2 µM. If it is assumed that the form of lead phosphate
that precipitates is (Pb)3(PO4)2, then the precipitate could remove up to 3/2 x 9.2 = 13.8 µmoles Pb per litre (13.8 x 207 = 2860 µg/L).
Table 8a: Solubility simulations with complete OECD TG 201 medium (Al and Fe)a
MINEQL MINTEQ Metal pH predicted solid phase solubility limit (M) limit (µg/L) solubility solubility limit (M) limit (µg/L)solubility
Al 6 gibbsite 1.07E-07 2.9 2.91E-08 0.8
10-4 M 7 gibbsite 4.73E-08 1.3 7.27E-09 0.2
8 gibbsite 4.24E-07 11.4 5.88E-08 1.6
6 Al(OH)3 amorphous 8.82E-06 238 7.76E-06 209
7 Al(OH)3 amorphous 1.52E-05 410 8.31E-06 224
2 x 10⁻⁴ 8 Al(OH)3 amorphous 1.37E-04 3700 6.75E-05 1820
Fe(III) 6 ferrihydrite 3.08E-07 17.2 2.70E-07 15.1
10-4 M 7 ferrihydrite 1.35E-07 7.5 1.26E-07 7.0
8 ferrihydrite 1.61E-09 0.09 7.69E-10 0.04
a PHREEQC does not include EDTA, so it is not possible with the supplied
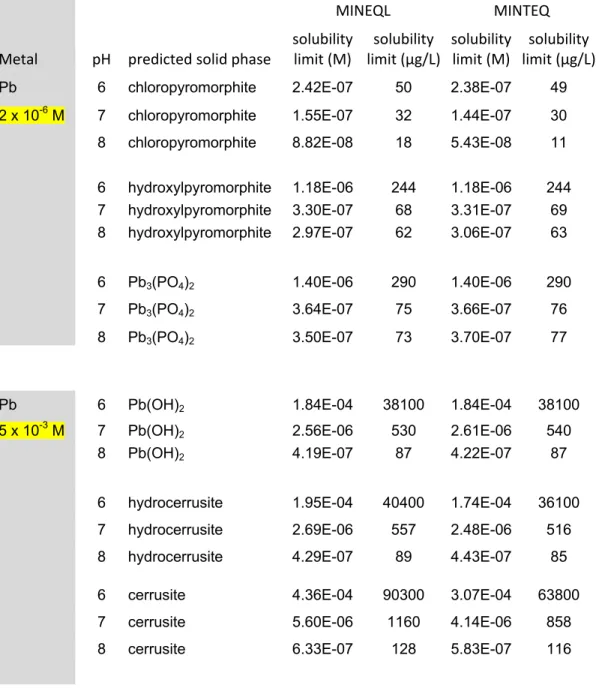
Table 8b: Solubility simulations with complete OECD TG 201 medium (Pb)a MINEQL MINTEQ Metal pH predicted solid phase solubility limit (M) solubility limit (µg/L) solubility limit (M) solubility limit (µg/L) Pb 6 chloropyromorphite 2.42E-07 50 2.38E-07 49 2 x 10⁻⁶ M 7 chloropyromorphite 1.55E-07 32 1.44E-07 30
8 chloropyromorphite 8.82E-08 18 5.43E-08 11
6 hydroxylpyromorphite 1.18E-06 244 1.18E-06 244 7 hydroxylpyromorphite 3.30E-07 68 3.31E-07 69 8 hydroxylpyromorphite 2.97E-07 62 3.06E-07 63
6 Pb3(PO4)2 1.40E-06 290 1.40E-06 290
7 Pb3(PO4)2 3.64E-07 75 3.66E-07 76
8 Pb3(PO4)2 3.50E-07 73 3.70E-07 77
Pb 6 Pb(OH)2 1.84E-04 38100 1.84E-04 38100
5 x 10⁻³ M 7 Pb(OH)2 2.56E-06 530 2.61E-06 540
8 Pb(OH)2 4.19E-07 87 4.22E-07 87
6 hydrocerrusite 1.95E-04 40400 1.74E-04 36100
7 hydrocerrusite 2.69E-06 557 2.48E-06 516
8 hydrocerrusite 4.29E-07 89 4.43E-07 85
6 cerrusite 4.36E-04 90300 3.07E-04 63800
7 cerrusite 5.60E-06 1160 4.14E-06 858
8 cerrusite 6.33E-07 128 5.83E-07 116
a PHREEQC does not include EDTA, so it is not possible with the supplied
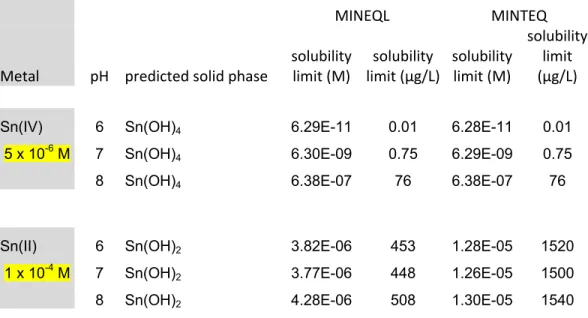
Table 8c: Solubility simulations with complete OECD TG 201 medium (Sn(II) and Sn(IV))a MINEQL MINTEQ Metal pH predicted solid phase solubility limit (M) solubility limit (µg/L) solubility limit (M) solubility limit (µg/L)
Sn(IV) 6 Sn(OH)4 6.29E-11 0.01 6.28E-11 0.01
5 x 10⁻⁶ M 7 Sn(OH)
4 6.30E-09 0.75 6.29E-09 0.75
8 Sn(OH)4 6.38E-07 76 6.38E-07 76
Sn(II) 6 Sn(OH)2 3.82E-06 453 1.28E-05 1520
1 x 10⁻⁴ M 7 Sn(OH)
2 3.77E-06 448 1.26E-05 1500
8 Sn(OH)2 4.28E-06 508 1.30E-05 1540
a PHREEQC does not include EDTA, so it is not possible with the supplied
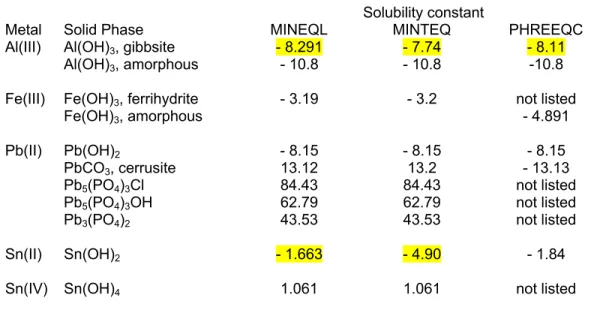
Table 9: Comparison of the default solubility constants in the MINEQL, MINTEQ and PHREEQC models for the solid phases retained for considerationa.
Solubility constant
Metal Solid Phase MINEQL MINTEQ PHREEQC
Al(III) Al(OH)3, gibbsite - 8.291 - 7.74 - 8.11
Al(OH)3, amorphous - 10.8 - 10.8 -10.8
Fe(III) Fe(OH)3, ferrihydrite - 3.19 - 3.2 not listed
Fe(OH)3, amorphous - 4.891
Pb(II) Pb(OH)2 - 8.15 - 8.15 - 8.15
PbCO3, cerrusite 13.12 13.2 - 13.13
Pb5(PO4)3Cl 84.43 84.43 not listed
Pb5(PO4)3OH 62.79 62.79 not listed
Pb3(PO4)2 43.53 43.53 not listed
Sn(II) Sn(OH)2 - 1.663 - 4.90 - 1.84
Sn(IV) Sn(OH)4 1.061 1.061 not listed
a According to the conventions used in MINEQL and MINTEQ, the formation of the precipitates is written in the
forward direction and thus the equilibrium constants for solids are written as the negative solubility constant (Allison et al. 1991; Schecher and McAvoy 2001). For precipitates involving anions other than HO-, the formation reaction is straightforward, e.g. Pb2+ + CO
32- PbCO3(s). However, for precipitates involving HO-,
both MINEQL and MINTEQ write the reaction involving the water molecule, e.g., Al3+ + 3 H2O Al(OH)3(s) +
8 Appendix
Table A-1: Comparison of some of the chemical equilibrium models commonly used to calculate metal speciation in aqueous solutions (e.g., natural waters. toxicity testing media)
Model Comments Reference MINEQL+ - thermodynamic database updated as of version
4.5
- inappropriate for media containing natural dissolved organic matter DOM
- thermodynamic database includes solid phases that are unlikely to form in a toxicity-testing medium
- expensive
Schecher and McAvoy (1992) (2001)
http://www.mineql.com
MINTEQA2 - original database was flawed, but has since been corrected
- less user-friendly than MINEQL+, but free-ware - inappropriate for media containing natural
dissolved organic matter DOM
Allison et al. (1991) Serkiz et al. (1996)
http://www.epa.gov/ceampubl/ mmedia/minteq/
Visual MINTEQ - Windows version of MINTEQA2 v.4; more user friendly than the original MINTEQ program - database updated with most recent NIST data - free-ware version available
- handles DOM in various ways, including natural DOM (e.g., Gaussian DOM, Stockholm Humic Model, or NICA-Donnan model)
http://www.lwr.kth.se/English/ OurSoftware/vminteq/ (The next version (3.0) will be a significantly enhanced version, rewritten entirely in the .NET environment and with a number of new features. A beta version was promised for October 2009.) GEOCHEM-PC
GEOCHEM-EZ - inappropriate for media containing natural dissolved organic matter DOM Parker et al. (1995)
http://abstracts.aspb.org/pb20 09/public/P40/P40006.html PHREEQC - program for speciation. batch-reactions,
one-dimensional transport. and inverse geochemical calculations
- organic matter is included as fulvate and humate - Windows version updated September 2008
Parkhurst and Appelo (1999) http://www.brr.cr.usgs.gov/proj ects/GWC_coupled/phreeqc/in dex.html