3D Viewpoint Optimization of Topological Relationships:
Application to 3D Cadastre for Visual Easement Validation
R. Neuville 1, *, J. Pouliot 2, R. Billen 1
1 Geomatics Unit, Université de Liège, Quartier Agora, 19 Allée du Six-Août, 4000 Liège, Belgium; [email protected], [email protected]
2 Department of Geomatics Sciences, Université Laval, Pavillon Louis-Jacques-Casault 1055, Avenue du Séminaire, Office 1315, Québec, QC G1V 5C8, Canada; [email protected]
Commission VI, WG VI/4
KEY WORDS: 3D Geovisualization; 3D Cadastre; 3D Viewpoint; Topological relationship; Easement; Camera; Occlusion;
ABSTRACT:
Offering optimum 3D viewpoint to user can be attractive in relieving occlusion in 3D scene. This could be much relevant for the visualization of 3D cadastral systems since they constitute complex datasets including both physical and legal objects while users are operating a number of visual tasks that require precise outlook. However, 3D viewpoint usability has yet to be evaluated to demonstrate its relevance in accomplishing given end user’s visual tasks. Hence, in this research project, the focus is set on visual identification of 3D topological relationships (disjoint and overlap) as it is one of the main users’ requirements in 3D cadastre. To this end, this paper addresses this issue using a virtual 3D model of the Planetarium Rio Tinto Alcan (Montreal city) in which property issues take place, especially regarding the easement validation procedure. Empirical tests have then been administrated in the form of interviews using an online questionnaire with university students who will specifically address such issues in their professional career. The results show that a 3D viewpoint that maximizes 3D disjoined or overlapped geometric objects’ view area within the viewport significantly outperforms traditional combined software points of view in visually identifying 3D topological relationship. This paper also suggests that user’s inexperience in 3D cadastre reduces visual task efficiency when visually identifying 3D topological relationship among overlapped geometric objects. Eventually, this study opens up new perspectives on 3D topological relationships modeling and visualization.
1. INTRODUCTION 1.1 Context & Problematics
Shifting to the third geometric dimension (i.e., with the addition of the objects’ height or Z coordinate) for visualizing overlapping situations (e.g., property units within a multi-story building, utilities networks above and under the ground) has been shown to be helpful in cadastre, especially to assess multi-levels properties (Pouliot et al., 2018). In this context, scientific studies have been conducted to establish visualization requirements for 3D cadastral systems along with providing suitable graphic design guidelines for given visual purposes (Pouliot et al., 2014; Shojaei et al., 2013; Wang et al., 2012). For instance, it has been pointed out that transparency can be used to visually assist property units demarcation and reduce occlusion at the same time (Wang et al., 2017). On this latter point, 3D cadastral visualization is challenging due to the great variety of geometric objects1 within the 3D scene. Beyond the boundaries of physical objects, 3D cadastre also requires legal objects and areas inside official urban planning documents (Aien et al., 2013; Pouliot, 2011).
For visualization purposes, this variety of data implies elaborating solutions that still guarantee the understanding of underlying information: e.g., comprehending ownership boundaries, retrieving ownership information, analyzing 3D spatial relationships. To this end, occlusion management and enhancement techniques are extremely suitable as they facilitate geospatial data exploration (Bazargan and Falquet, 2009;
* Corresponding author
1 In a 3D visualization context, geometric objects are defined as any
objects located in a 3D universe (x,y,z) and built from one of the
Elmqvist and Tsigas, 2007; Trapp et al., 2011). For example, transparency and 3D explosion probe can significantly improve the visual discovery of objects enclosed or contained within other objects (e.g., rooms inside buildings, pipes and electricity networks under the ground) (Assarsson et al., 2006; Coffin and Höllerer, 2006; Sonnet et al., 2004). On the other hand, the application of transparency reduces depth perception while 3D explosion probe does not preserve geometric objects’ location. Hence, visual spatial relationships evaluation is more complex. As a result, there is no easy solution to manage occlusion; it all depends on users’ requirements, especially in terms of targeted visual purposes.
Whilst current 3D viewers (e.g., PDF 3D, Sketchup) already provide visualization techniques (on both image and view spaces) to overcome visibility issues, we noted that effective camera management is still limited to default top, side and 45° software points of view; and according to the visual 3D model complexity (e.g., hidden faces), these viewpoints may not be suited to achieving user’s visual task (Dutagaci et al., 2010; Lee et al., 2005; Page et al., 2003; Plemenos, 2003; Polonsky et al., 2005; Vazquez et al., 2001). In 3D geovisualization, user is thus usually in charge of finding the most suitable point of view out that ensures the decision making. As a reminder, it consists in defining four components (Neuville et al., 2018): the camera position, orientation (i.e., the 3D viewing direction), the focal length (i.e., the distance between the projection center and projection plane) and the vision time (i.e., only required to produce a camera motion within the 3D scene). Yet, this process is far from being straightforward and may rise to a challenge with
geometric primitives (point, curve, surface, and volume) defined within the spatial schema ISO 19107:2003 (Pouliot et al., 2008).
ISPRS Annals of the Photogrammetry, Remote Sensing and Spatial Information Sciences, Volume VI-4/W1-2020, 2020 3rd BIM/GIS Integration Workshop and 15th 3D GeoInfo Conference, 7–11 September 2020, London, UK
high density areas that inevitably lead to visual clutter and occlusion (Andrienko et al., 2008; Elmqvist and Tudoreanu, 2007; Li and Zhu, 2009).
1.2 Research questions
From a semiotics perspective, the third dimension thus includes new design mechanisms, especially by turning the camera settings into vision variables (Jobst et al., 2008). For that matter, it is sufficient to emphasize that the OGC Web Terrain Service (compared to Web Map Service) demands users to go further in setting the view of 3D geospatial data, especially by defining the pitch (the angle between the viewer and the point of interest), the yaw (the azimuth angle) and the distance between the viewer and the point of interest (Open Geospatial Consortium, 2001). In this context, Rautenbach et al., (2015) indicates that the camera location may have a great impact on the visual selectivity purpose. This is also the conclusion of (Neuville et al., 2019a) who showed that a 3D viewpoint that maximizes 3D geometric objects’ view area within the viewport significantly improves visual counting accuracy and user’s certainty (compared to default software points of view). Although this study brings initial empirical evidence that supports the viewpoint usability in 3D geovisualization, it only considers visual counting (selectivity task).
On the basis of above, this paper aims to extend the knowledge base in 3D viewpoint usability for visual 3D topological relationships identification as it constitutes one of the main users’ requirements in 3D cadastral systems (Shojaei, 2014). The focus is set on disjoined and overlapped 3D objects as these relationships are particularly met when assessing Rights, Restrictions, and Responsibilities (RRR) conflicts. Then, three research questions are raised:
(1) Is a 3D viewpoint based on the maximization of 3Ddisjoined or overlapped geometric objects’ view area more accurate for visual 3D topological relationship identification compared to traditional combined software points of view?
(2) Does a 3D viewpoint based on the maximization of 3D
disjoined or overlapped geometric objects’ view area enhance user’s certainty when visually identifying 3D topological relationship compared to traditional combined software points of view?
(3) Do the user’s attributes (background training, grade,
experience in 3D cadastre, 3D visualization experience) influence the usability of a 3D viewpoint maximizing 3D disjoined or overlapped geometric objects’ view area?
As stated above, the retained optimization criterion is based on the maximization of 3D disjoined or overlapped geometric objects’ view area within the viewport. Basically, the algorithm consists in counting the number of visible pixels of a set of 3D geometric objects (that interact with each other) on a sample of 2D images (generated using different 3D points of view). The optimal 3D viewpoint is then defined as the point of view that maximizes the visible area of given geometric objects. This method is similar to (Neuville et al., 2019b) and we invite readers to refer to this study for a comprehensive understanding (technical specification) of how the algorithm works.
Then, two quality conditions – accuracy and user’s certainty – have been considered in this research; the former measures the effectiveness (i.e., how well users accomplish their objectives with the system) and the latter the satisfaction (i.e., users’
feelings about the use of the system) (Abran et al., 2003). Effectiveness and satisfaction are an integral part of the usability criterion, the most common variable for user-centred evaluation studies (Van Velsen et al., 2008). For that matter, it has already been employed in 3D cadastre-related studies (Oosterom et al., 2010; Shojaei et al., 2013; Wang et al., 2017). According to the ISO 9241-11, usability refers to the extent to which a system,
product or service can be used by specific users to achieve specified goals with effectiveness, efficiency, and satisfaction in a specified context of use. Note that efficiency (referring to the
resources used to accomplish the objectives) has not been assessed in this study.
The paper is structured as follows. Section 2 is related to the experimentation design and illustrates the case study. Section 3 statistically analyzes the results, whereas Section 4 discusses the outcomes, presents the research limitations and examines some perspectives.
2. EXPERIMENTATION 2.1 Introduction
Empirical studies have proven to be effective in assessing the suitability of visualization designs, especially when compared with simple introspection (Green, 1998). Besides, it is also a key feature in achieving user-centered solutions and thus meeting users’ visualization requirements (Wallach and Scholz, 2012). Similarly to Neuville et al., (2019a), this study has been carried out in the form of interviews using an online questionnaire. This approach benefits from the advantage of ensuring a better comprehension of the proposal (the former) and reaching a higher audience along with data recording automation (the latter). The next sections present in more detail the case study and the online questionnaire.
2.2 Case study
In June 2019, an open discussion, held with the Geomatics Division at Montreal (Mtl), reported visualization issues around a given place: the Planetarium Rio Tinto Alcan. Indeed, the city of Mtl has difficulty visually assessing RRR conflicts, especially between legal objects (easements) and physical objects (such as buildings and utility networks). With this in mind, we therefore designed and conducted a case study that aims to examine the 3D viewpoint usability to support the understanding of such conflicts, specifically through the visual topological relationships assessment among 3D objects that interact with each other. Figure 1 illustrates the 3D model wherein easements are graphically colored in yellow, buildings and urban facilities in brown, ground in grey and green spaces in green. Then, a (fictive) 3D object (in blue) is added to the initial model as an example of possible RRR conflict between an existing easement and a physical space in the planning phase (e.g., air conditioner unit, locker). Note that, as to rendering visualization techniques, the overall illumination consists of an ambient light and a directional light emitted from the camera location in the direction of the 3D model (which enhances lighting in the user’ viewing direction).
ISPRS Annals of the Photogrammetry, Remote Sensing and Spatial Information Sciences, Volume VI-4/W1-2020, 2020 3rd BIM/GIS Integration Workshop and 15th 3D GeoInfo Conference, 7–11 September 2020, London, UK
Figure 1: Virtual 3D model of the Planetarium Rio Tinto Alcan (Montreal city) in which easements are represented in yellow,
buildings and urban facilities in brown, ground in grey and green spaces in green. A 3D object (in blue) has been added as an example of RRR conflict with an existing easement (source:
Geomatics Division, Montreal City).
As stated above, the goal of the study is to visually identify the topological relationship between an object in blue (i.e., in the planning phase) and an easement in yellow. In Figure 1, the blue object overlaps the easement (in yellow). In total, a set of twelve fictive simulations have then been designed and visualized either from:
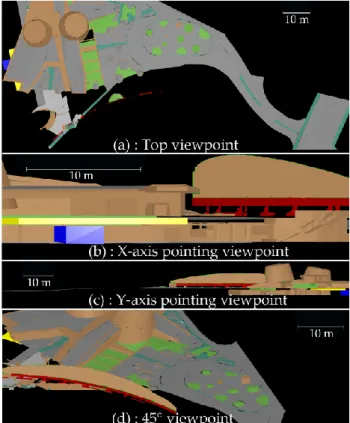
• the traditional combined software points of view (6 simulations out of 12): top-down (Figure 2a), pointing to the two planimetric axes (Figures 2b and 2c) and at 45 degrees (Figure 2d).
• Or a point of view that maximizes 3D disjoined or overlapped geometric objects’ view area inside the viewport (6 simulations out of 12) (Figure 3).
Note that simulations are independent (i.e., non-correlated) of each other, thus avoiding the carry-over effect: i.e., the effect that the knowledge of a previous experimental condition affects the participant’s performance in further tests. Eventually, the overall complexity among the two types of visual medium is kept as constant as possible since all six simulations (in each group) were equally divided into three overlapped and disjoined situations.
Figure 2: Virtual 3D model of the Planetarium Rio Tinto Alcan (Montreal city) visualized from the traditional combined points of view: top viewpoint (a), side viewpoints (b and c) and 45° viewpoint (d). Buildings and urban facilities are displayed in brown, ground in grey, green spaces in green and the easement in yellow. A 3D object (in blue) is added as an example of RRR
conflict with the easement.
Figure 3: Part of the virtual 3D model of the Planetarium Rio Tinto Alcan (Montreal city) visualized from a point of view that
maximizes 3D overlapped geometric objects’ view area inside the viewport. Buildings and urban facilities are displayed in brown, ground in grey, green spaces in green and the easement in yellow. A 3D object (in blue) is added as an example of RRR
conflict with the easement.
2.3 Online questionnaire
The online questionnaire was built as a website designed with Bootstrap, an open-source front-end framework. It used a MySQL server to automatically store participants’ profile and their answers. To sum up, the questionnaire was organized around three sections:
1. The first one is dedicated to the participant’s attributes, which includes four questions related to his/her training background, his/her grade, his/her experience in 3D
ISPRS Annals of the Photogrammetry, Remote Sensing and Spatial Information Sciences, Volume VI-4/W1-2020, 2020 3rd BIM/GIS Integration Workshop and 15th 3D GeoInfo Conference, 7–11 September 2020, London, UK
cadastre, his/her frequency of visualizing 3D building models, his/her potential color perception deficiency. 2. Then, the second section presents the 3D model, sets the
case study context and provides a practical demonstration (in order to get participants acquainted with the questions and the procedure for answering).
3. Finally, the third section is the test part. As a reminder, participants go through 12 independent simulations: the first six are visualized with the traditional combined software points of view and the last six with a point of view maximizing 3D disjoined or overlapped geometric objects’ view area inside the viewport.
For each simulation, two questions were systematically asked: • Does the geometric object (in blue) intersect the easement
(in yellow)? Possible options: Yes/No.
• What is the degree of certainty of your answer? Possible options: totally certain, quite certain, quite uncertain, and totally uncertain.
Note that the first question measures the accuracy, i.e., the participant’s capacity to visually identify the topological relationship between two 3D objects, while the second question measures user’s uncertainty.
3. RESULTS 3.1 Selection of participants
Participants are students from Université Laval (Canada) and Université de Liège (Belgium)2. They were selected on the basis of their future involvement in addressing land issues, such as easement compliance. Therefore, land surveyor, engineer and architect students took part in this experimental study, and from September to October 2019, 42 students completed the online questionnaire. Among these students, two suffered from color perception deficiency, which thus brings the number of participants to 40 with the following characteristics:
• Background training: 34 from geomatics sciences (land surveyor students), 3 from geomatics engineering, 2 from architecture and one from civil engineering.
• Grade: 2 in first grade, 2 in second grade, 5 in third grade and 31 in fourth grade.
• Experience in 3D cadastre: more than half of the participants (26 out of 40) had no experience in 3D cadastre while the rest only sporadically (i.e., less than ten times a year) make use of 3D cadastre.
• 3D visualization experience: More than half of the participants (29 out of 40) were used to visualizing 3D building models: 5 on a regular basis (i.e., more than ten times a year) and 24 occasionally (i.e., less than ten time a year). Note that the rest of participants (11 out of 40) had never visualized 3D building models.
3.2 Statistical analysis
The statistical analysis was performed with the software environment R. Two distinct statistical methods were applied to answer the research questions (of section 1.2): the exact binomial test (for the accuracy criterion) and the Chi-2 test (for the user’s certainty analysis).
2 We want to sincerely thank Prof. Dr. Marc Gervais (from Université
Laval) and Prof. Dr. Pierre Hallot (from Université de Liège) for their cooperation throughout this investigation.
3.2.1 Accuracy analysis of a 3D viewpoint that maximizes 3D disjoined or overlapped geometric objects’ view area for visual 3D topological relationship identification
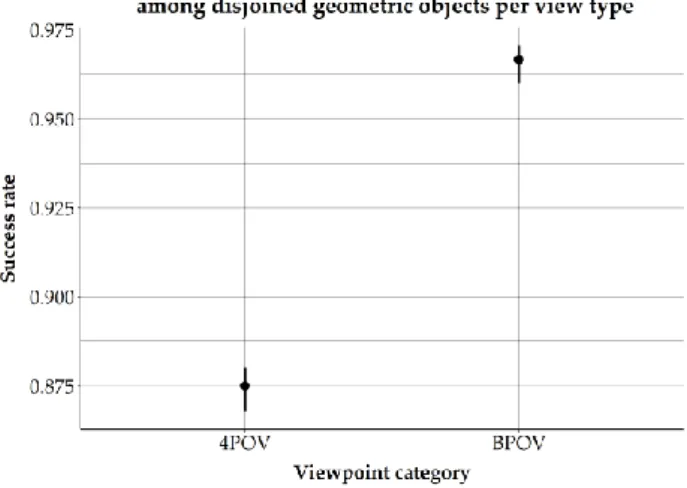
The exact binomial test shows that maximizing 3D disjoined or overlapped geometric objects’ view area inside the viewport significantly improves the success rate of visual 3D topological relation identification compared to traditional combined software points of view (Figures 4 and 5). The overall success rate is about 96.5% (for both disjoined and overlapped topological relationships) compared to 87,5% (disjoined geometric objects) and 79% (overlapped geometric objects) with traditional software points of view.
3.2.2 User’s certainty analysis of a 3D viewpoint that
maximizes 3D disjoined or overlapped geometric objects’ view area for visual 3D topological relationship identification
Prior to the statistical analysis, the initial measurement scale was reduced to two categories in order to meet the minimum number of observations per class (5). To achieve that, the frequencies associated to the totally uncertain, quite uncertain, and quite
certain classes were merged; the totally certain class was not
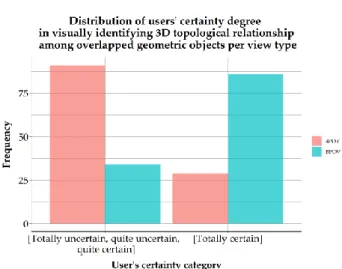
rearranged. Then, the Chi-2 test shows that maximizing 3D disjoined or overlapped geometric objects’ view area inside the viewport significantly improves the degree of certainty of participants when visually identifying 3D topological relationship: p-value of 9.22 × 10⁻¹⁰ (disjoined geometric objects) and 4.62 × 10⁻¹³ (overlapped geometric objects). As shown in Figures 6 and 7, participants are usually totally certain (category 3) when performing the visual task with a viewpoint maximizing 3D geometric objects’ view area.
Figure 4: Exact binomial test. Success rate of visual 3D topological relation identification among disjoined geometric objects per view type. 4POV: the traditional software
points of view; BPOV: the proposed optimum viewpoint.
ISPRS Annals of the Photogrammetry, Remote Sensing and Spatial Information Sciences, Volume VI-4/W1-2020, 2020 3rd BIM/GIS Integration Workshop and 15th 3D GeoInfo Conference, 7–11 September 2020, London, UK
Figure 5: Exact binomial test. Success rate of visual 3D topological relation identification among overlapped geometric objects per view type. 4POV: the traditional software
points of view; BPOV: the proposed optimum viewpoint.
Figure 6: Distribution of users’ certainty degree in visually identifying 3D topological relationship among disjoined geometric objects per view type; 4POV: the traditional software points of view; BPOV: the proposed optimum viewpoint. User’s certainty categories totally uncertain, quite uncertain and quite
certain have been merged to meet the minimum number of
observations per class (5).
Figure 7: Distribution of users’ certainty degree in visually identifying visual 3D topological relationship among overlapped
geometric objects per view type; 4POV: the traditional software points of view; BPOV: the proposed optimum viewpoint. User’s certainty categories totally uncertain, quite uncertain and quite certain have been merged to meet the minimum number of observations per class (5).
3.2.3 User’s attributes impact on the usability of a 3D viewpoint that maximizes 3D disjoined or overlapped geometric objects’ view area for visual 3D topological relationship identification
Since only one participant had a training background in civil engineering, this professional profile was not considered in the analysis. Then, the results show that students in higher grades (from second to fourth) outperforms first-year students when visually identifying overlapped 3D geometric objects (at the confidence level of 95%); the same is also true with participants having experience in 3D cadastre. Furthermore, land surveyor students better determine the relationship among disjoined geometric objects compared to geomatics engineer students. Eventually, the results show that experience in 3D visualization and cadastre has no significant effect on user’s certainty; the background training and grade could not be statistically analyzed because of a lack of observations by category.
4. DISCUSSION 4.1 Back to the research questions
On the basis of the above statistical analysis, the results showed that maximizing 3D disjoined or overlapped geometric objects’ view area outperforms visual topological relationships identification among disjoined and overlapped objects (compared to traditional software points of view). This statement has been demonstrated (at the confidence level of 95%) both for the accuracy and user’s certainty criteria. With the work of (Neuville et al., 2019a), this study brings thus further empirical evidence that supports the viewpoint value in achieving visual purposes. Once again, it points out that current default software points of view (despite their suitability in 3D modeling) show limitations in visualizing 3D geospatial data, especially when visualization is used for spatial analysis.
It also looks like that visual 3D topological identification efficiency among overlapped geometric objects is enhanced with 3D cadastral experience and in higher grades. Moreover, compared to geomatics engineer students, land surveyor students seem to better visualize the topological relationship among disjoined objects. Eventually, no significant effect could not be demonstrated with user’s certainty regarding their experience in 3D visualization and cadastre; other user’s attributes could not be demonstrated due to missing data.
4.2 Limitations and perspectives
First of all, only 40 people took part in this study and, while it has been shown that only five participants already detect 80% of usability issues (Virzi, 1992), it prevented from conducting some statistical analyses (specifically linked to user’s attributes). As such, the results should be interpreted with caution. This is, for instance, the case with user’s certainty where results only indicate that participants are usually more totally certain of their answer with a viewpoint that maximizes 3D geometric disjoined or overlapped objects’ view area. What about the transition from the uncertainty to certainty feeling? Additional data (i.e., participants) are therefore required to go further in the statistical analysis. Furthermore, the sample also needs to be more
ISPRS Annals of the Photogrammetry, Remote Sensing and Spatial Information Sciences, Volume VI-4/W1-2020, 2020 3rd BIM/GIS Integration Workshop and 15th 3D GeoInfo Conference, 7–11 September 2020, London, UK
representative since this study only focuses on a group of students from geomatics, architecture and civil engineering. Supplementary profiles and professional stakeholders should be considered to better support the results.
Then, this study only took RRR conflicts among existing easements and fictive 3D geometric objects into consideration. Real-world scenarios that deal with more complex overlapping situations (such as a multi-story building with multiple easements) should be examined in the future. The same is also true for the objects (e.g., 3D parcels) and their conflicts (i.e., topological relationships between them).
Afterwards, this study considered default software points of view as benchmark for evaluation purposes. This choice is not meaningless as they (all combined) guarantee a comprehensive 3D model overview. In practice, however, users usually go beyond these static viewpoints and navigate into the 3D scene. In the future, it would thus be better to consider interactive user’s experience as a second benchmark. It will also extend the usability analysis: e.g., time spent in navigating in the 3D scene, spatial proximity of user’s point of view with a precomputed point of view… Thereby, design guidelines for suitable camera settings could be provided (on the same basis as mapping and rendering techniques). Nevertheless, this new benchmark induces a carry-over effect if performed on the same 3D model. Special attention should thus be addressed to perform such tests on multiple 3D datasets.
Eventually, this study also brings new research opportunities to enhance the initial 3D viewpoint management algorithm of (Neuville et al., 2019b). At the present time, the algorithm only maximizes 3D disjoined or overlapped geometric objects’ view area and, although this descriptor is tenable for selectivity purpose, it should be reviewed when visualizing 3D topological relationships. Indeed, the visual focus is more on the disjoined or overlapped section (than 3D geometric objects themselves). This brings however new research questions into play: e.g., how to model (especially with disjoined geometric objects) and visualize (e.g., mapping techniques) topological relationships? Note that solutions for automatic 3D topological relationships detection can already be found in (Zhang & Hu, 2011). Furthermore, dynamic transparency (Elmqvist et al., 2007) could also be a promising solution. Finally, note that additional topological relationships could also be investigated in the future in order to extent the initial scope this paper.
5. CONCLUSION
This paper describes the design and results of an online questionnaire to assess the viewpoint usability in 3D cadastre visualization. Applied to visual 3D topological relationships identification among disjoined and overlapped geometric objects (both physical and legal), this study shows that maximizing 3D disjoined or overlapped geometric objects’ view area within the viewport significantly outperforms traditional software points of view in visual task accuracy and user’s certainty. These findings thus provide additional evidence that supports camera settings as vision variables in assisting visual decision-making, especially for easement validation in 3D cadastre since we could not find such a proposal in the scientific literature or practices. Furthermore, this paper also suggests that user’s inexperience in 3D cadastre affects visual task efficiency for overlapped objects, which emphasizes the importance of including end-users when implementing 3D visualization design.
The outcomes of this work have also some limitations, in particular because of the small number of participants (40). Moreover, this research only considered traditional combined software points of view as benchmark. Extensive studies could thus be conducted to take the interactive user’s experience into account (as a second benchmark). Hence, the viewpoint usability analysis could be extended: e.g., time spent in navigating in the 3D scene for achieving visual tasks, spatial proximity of user’s point of view with a precomputed point of view… Finally, this study also brings new research questions for visual 3D topological relationships identification (both in 3D modeling and visualization).
ACKNOWLEDGEMENTS
Funding: Part of this project was funded by CRSNG RGPIN-2015-05514 and the Merit scholarship program for foreign students provided by the FRQNT.
The authors would like to thank Ordnance Survey GB (https://www.ordnancesurvey.co.uk) and 1Spatial (https://1spatial.com/) for sponsoring the publication of this paper.
The authors also want to sincerely thank Richard Mongeau and Simon Vidal (from the City of Montreal) for providing the 3D model of the Planetarium Rio Tinto Alcan as well as their cooperation during this study.
Finally, the authors are also grateful to Prof. Dr. Marc Gervais (from Université Laval) and Prof. Dr. Pierre Hallot (from Université de Liège) along with their students for their cooperation and involvement in this investigation.
REFERENCES
Abran, A., Khelifi, A., Suryn, W., 2003. Usability Meanings and Interpretations in ISO Standards. Softw. Qual. J. 11, 325–338. Aien, A., Kalantari, M., Rajabifard, A., Williamson, I., Wallace, J., 2013. Towards integration of 3D legal and physical objects in cadastral data models. Land Use Policy 35, 140–154. https://doi.org/10.1016/j.landusepol.2013.05.014
Andrienko, G., Andrienko, N., Dykes, J., Fabrikant, S.I., Wachowicz, M., 2008. Geovisualization of Dynamics, Movement and Change: Key Issues and Developing Approaches in Visualization Research. Inf. Vis. 7, 173–180. https://doi.org/10.1057/IVS.2008.23
Assarsson, U., Elmqvist, N., Tsigas, P., 2006. Image-Space Dynamic Transparency for Improved Object Discovery in 3D Environments (Technical Report 2006:10). Chalmers University of Technology, 18.
Bazargan, K., Falquet, G., 2009. Specifying the representation of non-geometric information in 3D virtual environments. International Conference on Human-Computer Interaction.
Springer, 773–782.
Coffin, C., Höllerer, T., 2006. Interactive Perspective Cut-away Views for General 3D Scenes. Proceedings of the IEEE
Symposium on 3D User Interfaces 2006, 25–28.
Dutagaci, H., Cheung, C.P., Godil, A., 2010. A benchmark for best view selection of 3D objects. Proceedings of the ACM
ISPRS Annals of the Photogrammetry, Remote Sensing and Spatial Information Sciences, Volume VI-4/W1-2020, 2020 3rd BIM/GIS Integration Workshop and 15th 3D GeoInfo Conference, 7–11 September 2020, London, UK
Workshop on 3D Object Retrieval - 3DOR ’10. Presented at the
the ACM workshop, ACM Press, Firenze, Italy, 45–50. https://doi.org/10.1145/1877808.1877819
Elmqvist, N., Assarsson, U., Tsigas, P., 2007. Employing dynamic transparency for 3D occlusion management: Design issues and evaluation. IFIP Conference on Human-Computer Interaction. Springer, 532–545.
Elmqvist, N., Tsigas, P., 2007. A taxonomy of 3D occlusion management techniques. Virtual Reality Conference, 2007. VR’07. IEEE, 51–58.
Elmqvist, N., Tudoreanu, M.E., 2007. Occlusion Management in Immersive and Desktop 3D Virtual Environments: Theory and Evaluation. International Journal of Virtual Reality 6(13), 13. Green, M., 1998. Toward a Perceptual Science of Multidimensional Data Visualization: Bertin and Beyond.
ERGOGERO Hum. Factors Sci. 8, 1–30.
Jobst, M., Kyprianidis, J.E., Döllner, J., 2008. Mechanisms on Graphical Core Variables in the Design of Cartographic 3D City Presentations. Geospatial Vision. Springer Berlin Heidelberg, Berlin, Heidelberg, 45–59.
Lee, C.H., Varshney, A., Jacobs, D.W., 2005. Mesh saliency.
ACM Trans. Graph. 24, 656–659.
Li, X., Zhu, H., 2009. Modeling and Visualization of Underground Structures. J. Comput. Civ. Eng., 7.
Neuville, R., Pouliot, J., Poux, F., De Rudder, L., Billen, R., 2018. A Formalized 3D Geovisualization Illustrated to Selectivity Purpose of Virtual 3D City Model. ISPRS Int. J.
Geo-Inf. 9(7), 24.
Neuville, R., Pouliot, J., Billen, R., 2019a. Identification of the Best 3D Viewpoint within the BIM Model: Application to Visual Tasks Related to Facility Management. Buildings 9(7), 18. https://doi.org/10.3390/buildings9070167
Neuville, R., Pouliot, J., Poux, F., Billen, R., 2019b. 3D Viewpoint Management and Navigation in Urban Planning: Application to the Exploratory Phase. Remote Sens. 11(3), 21. https://doi.org/10.3390/rs11030236
Oosterom, P.V., Stoter, J., Ploeger, H., Thompson, R., Karki, S., 2010. World-wide Inventory of the Status of 3D Cadastres in 2010 and Expectations for 2014. Presented at the FIG working week 2011, Marrakech, Morocco, 21.
Open Geospatial Consortium, 2001. Web Terrain Server (WTS). Page, D.L., Koschan, A.F., Sukumar, S.R., Roui-Abidi, B., Abidi, M.A., 2003. Shape analysis algorithm based on information theory. Proceedings 2003 International Conference
on Image Processing (Cat. No.03CH37429). Presented at the
International Conference on Image Processing, IEEE, Barcelona, Spain, I-229–32. https://doi.org/10.1109/ICIP.2003.1246940 Plemenos, D., 2003. Exploring virtual worlds: current techniques and future issues. International Conference GraphiCon., 5–10. Polonsky, O., Patané, G., Biasotti, S., Gotsman, C., Spagnuolo, M., 2005. What’s in an image?: Towards the computation of the
“best” view of an object. Vis. Comput. 21, 840–847. https://doi.org/10.1007/s00371-005-0326-y
Pouliot, J., 2011. Visualization, Distribution and Delivery of 3D Parcels Position Paper 4. Presented at the 2nd International Workshop on 3D Cadastres, Delft, The Netherlands, 13. Pouliot, J., Badard, T., Desgagné, E., Bédard, K., Thomas, V., 2008. Development of a Web Geological Feature Server (WGFS) for sharing and querying of 3D objects. Advances in 3D
Geoinformation Systems. Springer Berlin Heidelberg, Berlin,
Heidelberg, 115–130. https://doi.org/10.1007/978-3-540-72135-2_7
Pouliot, J., Ellul, C., Hubert, F., Wang, C., Rajabifard, A., Kalantari, M., Shojaei, D., Atazadeh, B., Van Oosterom, P., De Vries, M., Ying, S., 2018. Visualization and New Opportunities.
Best Practices 3D Cadastre. Peter van Oosterom, 77.
Pouliot, J., Wang, C., Hubert, F., Fuchs, V., 2014. Empirical Assessment of the Suitability of Visual Variables to Achieve Notarial Tasks Established from 3D Condominium Models.
Innovations in 3D Geo-Information Sciences, Lecture Notes in Geoinformation and Cartography. Springer International
Publishing, 195–210. https://doi.org/10.1007/978-3-319-00515-7_12
Rautenbach, V., Coetzee, S., Schiewe, J., Çöltekin, A., 2015. An Assessment of Visual Variables for the Cartographic Design of 3D Informal Settlement Models. Proceedings of the 27th
International Cartographic Conference. Presented at the
Proceedings of the 27th International Cartographic Conference, Rio de Janeiro, Brazil, 15.
Shojaei, D., 2014. 3D Cadastral Visualisation: Understanding Users’ Requirements (PhD Thesis). Infrastructure Engineering Department, The University of Melbourne, Australia.
Shojaei, D., Kalantari, M., Bishop, I.D., Rajabifard, A., Aien, A., 2013. Visualization requirements for 3D cadastral systems.
Comput. Environ. Urban Syst. 41, 39–54.
https://doi.org/10.1016/j.compenvurbsys.2013.04.003
Sonnet, H., Carpendale, S., Strothotte, T., 2004. Integrating expanding annotations with a 3D explosion probe, Proceedings
of the Working Conference on Advanced Visual Interfaces - AVI ’04. Presented at the the working conference, ACM Press,
Gallipoli, Italy, 63. https://doi.org/10.1145/989863.989871 Trapp, M., Beesk, C., Pasewaldt, S., Döllner, J., 2011. Interactive Rendering Techniques for Highlighting in 3D Geovirtual Environments. Advances in 3D Geo-Information Sciences,
Lecture Notes in Geoinformation and Cartography. Springer
Berlin Heidelberg, 197–210. https://doi.org/10.1007/978-3-642-12670-3_12
Van Velsen, L., Van Der Geest, T., Klaassen, R., Steehouder, M., 2008. User-centered evaluation of adaptive and adaptable systems: a literature review. Knowl. Eng. Rev., 23(3), 261-281. https://doi.org/10.1017/S0269888908001379
Vazquez, P.-P., Feixas, M., Sbert, M., Heidrich, W., 2001. Viewpoint Selection using Viewpoint Entropy. Proceedings of
the Vision Modeling and Visualization Conference. Aka GlbH,
273–280.
ISPRS Annals of the Photogrammetry, Remote Sensing and Spatial Information Sciences, Volume VI-4/W1-2020, 2020 3rd BIM/GIS Integration Workshop and 15th 3D GeoInfo Conference, 7–11 September 2020, London, UK
Virzi, R., 1992. Refining the test phase of usability evaluation: How many subjects is enough? Hum. Factors 34, 457–468. Wallach, D., Scholz, S.C., 2012. User-Centered Design: Why and How to Put Users First in Software Development. Software for
People. Springer Berlin Heidelberg, Berlin, Heidelberg, 11–38.
https://doi.org/10.1007/978-3-642-31371-4_2
Wang, C., Pouliot, J., Hubert, F., 2012. Visualization Principles in 3D Cadastre: A First Assessment of Visual Variables. Presented at the 3rd International Workshop on 3D Cadastres, Shenzhen, 309-324.
Wang, C., Pouliot, J., Hubert, F., 2017. How users perceive transparency in the 3D visualization of cadastre: testing its usability in an online questionnaire. GeoInformatica 21, 599– 618. https://doi.org/10.1007/s10707-016-0281-y
Zhang, J.P., Hu, Z.Z., 2011. BIM- and 4D-based integrated solution of analysis and management for conflicts and structural safety problems during construction.: 1. Principles and methodologies. Autom. Constr. 20, 155–166. https://doi.org/10.1016/j.autcon.2010.09.013
Revised July 2020
ISPRS Annals of the Photogrammetry, Remote Sensing and Spatial Information Sciences, Volume VI-4/W1-2020, 2020 3rd BIM/GIS Integration Workshop and 15th 3D GeoInfo Conference, 7–11 September 2020, London, UK