Aalborg Universitet
CLIMA 2016 - proceedings of the 12th REHVA World Congress
Heiselberg, Per Kvols
Publication date: 2016
Document Version
Publisher's PDF, also known as Version of record
Link to publication from Aalborg University
Citation for published version (APA):
Heiselberg, P. K. (Ed.) (2016). CLIMA 2016 - proceedings of the 12th REHVA World Congress: volume 10. Aalborg: Aalborg University, Department of Civil Engineering.
General rights
Copyright and moral rights for the publications made accessible in the public portal are retained by the authors and/or other copyright owners and it is a condition of accessing publications that users recognise and abide by the legal requirements associated with these rights. ? Users may download and print one copy of any publication from the public portal for the purpose of private study or research. ? You may not further distribute the material or use it for any profit-making activity or commercial gain
? You may freely distribute the URL identifying the publication in the public portal ?
Take down policy
If you believe that this document breaches copyright please contact us at [email protected] providing details, and we will remove access to the work immediately and investigate your claim.
Analysis of HVAC indoor terminal units
by using T-Q diagram: An experimental study
Youness Ajaji
#1, Philippe André
#2#Department of Environmental Sciences and Management, University of Liège
185 Avenue de Longwy 6700 Arlon Belgium
Abstract
The T-Q diagram is a widely used tool in the industry to optimize the design and the number of heat exchangers in a process. The principle consists in minimizing the quantity ∫TdQ in WK called entransy dissipation. We performed an experimental study in climatic chamber in order to apply the T-Q diagram method for the choice of the best indoor terminal device in an office submitted to a summer climate in Brussels and for the choice of the operating parameters water flow rate and water temperature. We tested four terminal units coupled to a cooling water tank by using a reversible air-water chiller: a mixing ventilation, a displacement ventilation, the mixing ventilation combined with a low inertia hydronic radiant floor, the displacement ventilation combined with the low inertia hydronic radiant floor. The tests were performed under stationary conditions. We plot the T-Q diagram and we assessed the entransy dissipations for each system and various operating parameters. We measured thermal comfort within the climatic chamber. Tests showed that air systems were less efficient than ventilation combined with radiant floor and that the combination of displacement ventilation with radiant floor was the best system. The study also showed that entransy dissipation values represented the real quality of the indoor terminal units.
Keywords - T-Q diagram; hydronic radiant floor; mixing ventilation; displacement ventilation
1.
IntroductionSubtasks A and B of the IEA EBC Annex 59 project [1,2] clearly show that indoor environment is more efficiently conditioned by using radiant panels than by using air systems. The sub-task B report shows that it is the most suitable terminal unit for low temperature heating and high temperature cooling. This is due to the large exchange area between the panels and the indoor environment and to the radiation transfer. However the radiant floor can only remove sensitive loads. It has to be coupled with a ventilation system that will remove latent loads and provide the necessary air quality. For a radiant floor, in heating mode, the heat transfer coefficient between the floor surface and a reference location within the room is 11W/m2K. This heat transfer coefficient takes into account the radiation and the free convection. In cooling mode it is 7W/m2K. The gap between both values comes from the free convection. If the free convection is forced, for example by using a displacement ventilation that supplies air very close to the floor then the heat transfer coefficient could be increased, particularly
in heating mode since the temperature difference between the supply air and the floor surface is relatively large. On the other hand, displacement ventilation affects only a part of the volume of the room: the occupation zone, while mixing ventilation affects the entire volume of the room, regardless to the mode: cooling or heating; so we can also expect energy savings from that point of view.
We performed an experimental study in climatic chamber in order to apply the T-Q diagram method for the choice of the best indoor terminal device in an office submitted to a summer climate like this of Brussels, and for the choice of the operating parameters water flow rate and water temperature. The T-Q diagram is a widely used tool in the industry to optimize the design and the number of heat exchangers in a process. The innovation produced by the IEA EBC annex 59 project – High temperature cooling and low temperature heating in buildings – is to use this tool for HVAC systems analysis in the design phase and for the choice of indoor terminal units. The subtask A of annex 59 project explains the theoretical aspects underlying this diagram and its application for HVAC systems analysis [1,2]. In [3] authors develop the physical principle of entransy from the analogy between heat and electrical conduction and show that this concept is a good description of the heat transfer ability in a process. They define an equivalent thermal resistance from the entransy concept and apply it to multi-dimensional conduction problems. In [4] the concept of entransy dissipation theory is applied to heat convection. In [5] the thermal resistance based on entransy theory is applied to thermal radiation. In [6,7,8] authors apply the theory of entransy to analyze heat exchanger performance. [6,7,8] show that the minimum thermal resistance based on the entransy theory always corresponds to the best performance of heat exchangers. They “bridge a
gap between the heat exchanger irreversibility and its effectiveness. The monotonic decrease of the effectiveness with increasing the thermal resistance shows that the heat exchanger irreversibility can be described by its thermal resistance when evaluated from the transport process viewpoint” (entransy dissipation) [6]. In fact, an HVAC
system constitutes a set of exchangers. That’s why, [9] apply the concept of entransy dissipation and the T-Q diagram to HVAC systems for the Xi’an airport [9]. They show that for indoor cooling, reducing entransy dissipation will increase chilled water temperature. The principle consists in minimizing the quantity Td Q
in WK called entransy dissipation. It is represented by the area located below the curve which expresses the fluid temperature as a function of the power-heat transferred in a heat exchanger or in a fluid mixture within the HVAC system. This entransy dissipation quantifies the irreversibility of heat transfer, thus the global performance of the set of heat exchangers that constitute the HVAC system. As for industry, the goal is to reduce this area, thus reducing the temperature differences between heat sources and heat sinks.We tested four terminal units coupled to a water tank cooled by using a reversible air-water chiller. The four indoor terminal devices are: a mixing ventilation, a displacement ventilation, the mixing ventilation combined with a low inertia hydronic cooling radiant floor, the displacement ventilation combined with the low inertia hydronic radiant floor. In an office building in Brussels, in summer or in mid-season,
cooling is often necessary to remove internal and solar gains even if the outside temperature is lower than the indoor one. The tests were performed under stationary conditions in cooling mode. We analyzed flow rates and temperature levels in order to plot the T-Q diagram and to assess entransy dissipations for each system and various operating parameters. We measured thermal comfort within the climatic chamber and the temperature stratification. We verified that the stratification due to radiant floor and displacement ventilation met the international Standard ISO 7730 [10]. Then we assessed the COP of the chiller for the different cases.
1. Methods
All the measurements were performed in the climatic chamber of the laboratory located in Arlon in the south of Belgium (figure 1).
Fig. 1 Tests were performed in the climatic chamber in the center of the building. An extreme Brussels summer climate was imposed in the buffer zone.
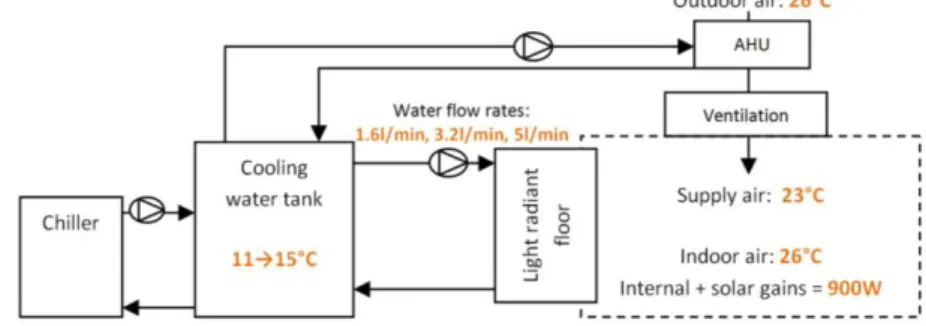
The tested HVAC system (figure 2) is composed of:
- Production loop: a reversible 10kW air-water chiller + a 500l storage tank for the cooling.
- Distribution loop and emission: the distribution pipes + a light radiant cooling floor.
- Air loop: An air-handling unit (100 to 800m3/h), cooling coil (sensible cooling power =1.3kW, total cooling power = 3.6kW), a mixing ventilation diffuser or a displacement air diffuser. Terminals used in this study case are: a displacement diffuser, a mixing ventilation diffuser and a light radiant floor.
Fig. 2 The system has been tested in a climatic chamber under stationary conditions. The values indicated in the figure are the values corresponding to the second experimentations.
Experimentation 1. This test was performed in cooling mode to cool the climatic
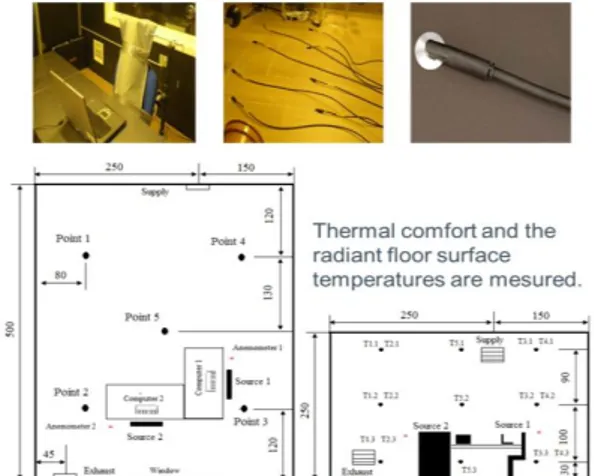
chamber using the light radiant floor and the mixing ventilation. We maintained the buffer zone at 30°C using a resistor controlled by a PID controller. Inside the climatic chamber 2 electrical carpets (240W) and 2 computers were used to represent the presence of two people working in an office. A third electrical carpet was used to emulate solar gains (300W). The experimentation was performed for steady state for 7h30 in October 2014. The operative temperature in the chamber is maintained at 24°C and the temperature in the storage tank is fixed at 11°C. The control of the operative temperature in the chamber is performed by a 2 inlets and one outlet flow mixer. For this experimentation the flow rate in the radiant floor is maintained at 5.2l/min. Comfort parameters inside the chamber are measured: globe temperatures and air temperatures at 16 locations, surface temperatures at 10 locations and air velocity at 2 locations near the people emulators heads. Figure 3 represents the configuration inside the chamber and sensors locations. Table 1 summarizes test conditions. Temperatures and flow rates are measured at the distribution loop of the system. All measurements are recorded every 5 minutes.
Fig. 3 Location of the probes inside the climatic chamber, thermal sources and mixing ventilation terminals. The two last photos show the surface temperature sensors.
The chamber is also cooled by AHU where the air is recirculated and cooled to 21°C through a cooling coil fed by cold water coming from the tank. Air temperature is also measured at exhaust and supply. The air flow rate is maintained at 200m3/h (4-1 which means category I of the standards EN15251 [11]). Surface temperatures are measured using a thermistor designed for measuring the back of PV module temperature because it is the same range of temperature as the radiant floor and PV are covered by a polymer which thermal conductivity is close to that of a wooden floor: 0.18W/m. The aluminum disk promotes heat transfer from surfaces and the link between the sensor and the surface is strong. The maker guaranties a precision of +/- 0.2°C.
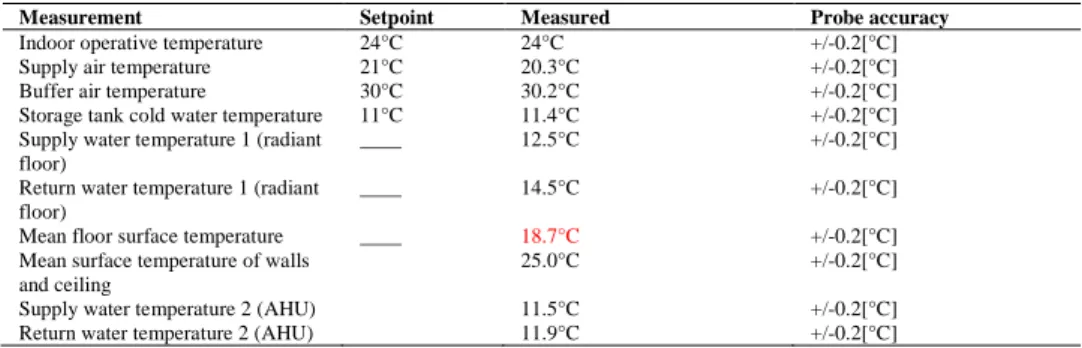
Table 1. Set points for chamber indoor environment and measured average temperatures Measurement Setpoint Measured Probe accuracy Indoor operative temperature 24°C 24°C +/-0.2[°C] Supply air temperature 21°C 20.3°C +/-0.2[°C] Buffer air temperature 30°C 30.2°C +/-0.2[°C] Storage tank cold water temperature 11°C 11.4°C +/-0.2[°C] Supply water temperature 1 (radiant
floor)
____ 12.5°C +/-0.2[°C]
Return water temperature 1 (radiant floor)
____ 14.5°C +/-0.2[°C]
Mean floor surface temperature ____ 18.7°C +/-0.2[°C] Mean surface temperature of walls
and ceiling
25.0°C +/-0.2[°C]
Supply water temperature 2 (AHU) 11.5°C +/-0.2[°C] Return water temperature 2 (AHU) 11.9°C +/-0.2[°C]
Experimentations 2. We performed the same tests but we modified some of the
experimental conditions. Tests were performed in December 2014 and May 2015. Each test is performed for 18 hours. In these tests we vary the water flow rate of the radiant cooling floor and the water temperature of the tank. We test the light radiant floor combined with mixing ventilation, the light radiant floor combined with displacement ventilation, the mixing ventilation, the displacement ventilation. We maintained the buffer zone at 26°C. Inside the climatic chamber 2 electrical carpets (240W) and 2 computers were used to represent the presence of two people working in an office. Three other electrical carpets were used to emulate solar gains (100W+100W+150W). The experimentation was performed for steady state. The operative temperature set point in the chamber is 26°C. The chamber is also cooled by AHU where the air is recirculated and cooled to 23°C through a cooling coil fed by cold water coming from the tank for all tests except the tests 6 and 7 where the air is cooled to 15.8°C and 15.1°C in order to meet the thermal comfort conditions. The air flow rate is maintained at 200m3/h (category 1 in terms of indoor air quality according to standards EN 15251) for all the tests. Table 2 summarizes test conditions.
Table 2. Configuration, measured average temperatures, and water flow rate in the radiant cooling floor. The indoor operative temperatures are measured 1m above the floor.
Test Configuration Water flow rate Storage tank cold water temperature Supply air temperature Mean floor surface temperature Measured indoor op. temp. Transf. coef. Water- indoor environment 1 Rad. floor /disp. vent. 4.9l/min 13.9°C 23°C 21.3°C 25.5°C 3.2W/m2
2 Rad. floor /disp. vent. 3.2l/min 14.5°C 23°C 22.2°C 26.3°C 2.8W/m2
3 Rad. floor /disp. vent. 3.2l/min 12.5°C 23°C 21.1°C 25.7°C 2.8W/m2
4 Rad. floor / mix. vent. 3.2l/min 14.6°C 23°C 22.4°C 27.1°C 2.5W/m2
5 Rad. floor / mix. vent. 1.6l/min 12.8°C 23°C 21.8°C 27.5°C 1.8W/m2
6 Disp. ventilation --- 11.6°C 15.8°C --- 27°C --- 7 Mixing ventilation --- 10.8°C 15.1°C --- 27°C ---
2. Results and discussion
Entransy dissipations are calculated from the first experimentation and an analysis is done in order to detect and locate entransy dissipations. Then we analyze the thermal comfort from the experimentations 2 and entransy and energy analysises are done in order to compare the 4 indoor terminal units. Entransy analysis. From the measured temperatures and the measured flow rates of the experimentation 1 we calculate
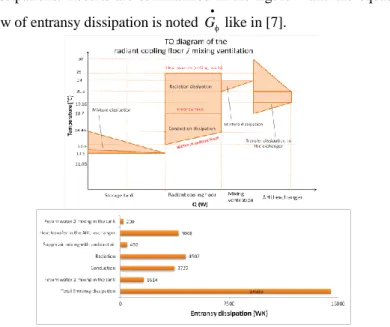
entransy dissipations. Results are summarized in the figure 4 and the equations (1) to (6). The flow of entransy dissipation is noted G
like in [7].
Fig. 4 Entransy analysis for the combination of the radiant cooling floor with mixing ventilation in an office.
The part of the distribution loop to the radiant floor is written by using the index “1” while the part of the distribution loop to the AHU is written by using the index “2” in the figure 4 and in the equations. T means temperature, Cp means the specific heat capacity, m means the mass flow. The indexes w, s, r, t, a, s, o, i, surf, mean respectively: water, supply, return, tank, air, outdoor, indoor, surface. Tmcw is the mean
temperature of the ceiling and the walls of the climatic chamber. The entransy dissipation flows from the return water 2 mixing in the tank, the heat transfer in the AHU, the supply air mixing with indoor air, the radiation, the conduction, the return water 1 mixing in the tank are respectively described by the following equations:
w2 MT 2 w sw2 rw2 wt rw2 1 G m Cp T T T T 2 . (1) 2 2 a w2 a AHU a sa oa w sw2 rw2 a sa oa sa rw2 1 1 G m Cp T T m Cp T T m Cp T T T T 2 2 . (2)
2 a MA a sa ia 1 G m Cp T T 2 . (3)
w1 R w sw1 rw1 mcw surf G m Cp T T T T . (4)
w1 C w sw1 rw1 surf rw1 sw1 1 G m Cp T T 2T T T 2 . (5)
w1 MT 1 w sw1 rw1 wt rw1 1 G m Cp T T T T 2 . (6)The total entransy dissipation flow is 14503WK for conditioning a 20m2 office. This first test had been performed for an extreme climate. The greatest entransy dissipation flow values come from the heat transfer in the AHU, from the radiation between the floor surface and the other indoor environment surfaces and from the heat transfer by conduction in the radiant floor. The two last ones can be decreased by increasing the cooling water temperature while the first one depends principally on the efficiency of the terminal ventilation unit and the AHU exchanger.
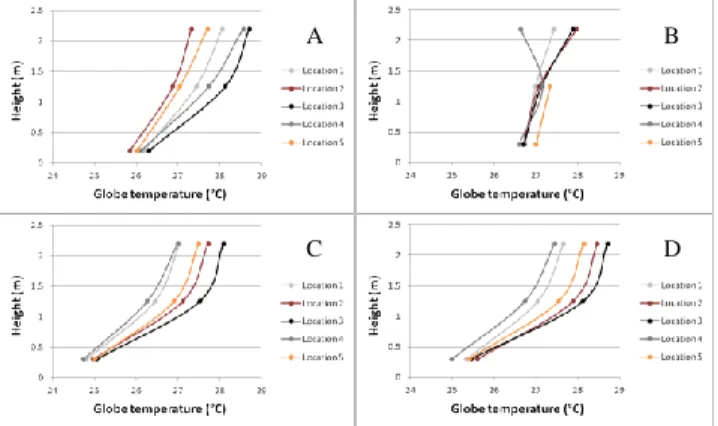
From the experimentations 2 we compared the indoor terminal units in terms of thermal comfort, entransy dissipation and energy efficiency. Thermal comfort analysis. The figure 5 describes the temperature stratification within the climatic chamber produced by the 4 indoor terminal units.
Fig. 5 Temperature stratification within the climatic chamber. A) Radiant floor 3.2l/min + mixing ventilation (test 4). B) Mixing ventilation (test 7). C) Radiant floor 3.2l/min + displacement ventilation (test 2). D) Displacement ventilation (test 6). For the different tested indoor terminal units see table 2. For the locations
of the probes see figure 5.
In the table 2 operative temperatures are measured 1m above the floor because in an office people are most of the time sitting. In this case we note that mixing and displacement ventilations never meet thermal comfort conditions even if the tank water temperature is low (10.8°C and 11.6°C) and the supply air temperature decreases to about 15°C. Note that the air flow rate is maintained to hygienic flow rate that corresponds to the first category according to standards EN 15251. It shows that the combination of ventilation with radiant floor is more efficient than a total air system. If the mixing ventilation is combined with the radiant floor the comfort set point is not met while the set point is met in the case of the combination of radiant floor with displacement ventilation because the displacement ventilation affects only one part of the total volume of the room. Let consider the local discomfort caused by vertical air temperature difference. If the chamber is cooled by only using mixing ventilation then the vertical air temperature difference does not exceed 1°C. If the mixing ventilation is combined with the low inertia radiant floor then the vertical air temperature difference can reach 2.2°C at location 3 above the plume created by occupants, it means that PD (percentage of dissatisfied) is less than 10% according to standards ISO7730-2005
A ) B ) C ) D )
(category B). Now if the chamber is cooled by using displacement ventilation or displacement ventilation combined with the radiant floor then the stratification is a little bit more important: the vertical air temperature difference can reach 3°C above the plume created by occupants but PD remains lower than 10% which corresponds to category B according to standards ISO7730-2005.
Entransy analysis. The T-Q diagram is the same as that of figure 4. Results are
summarized in the 3 entransy diagrams of figures 6, 7 and 8. The forth diagram is just a synthesis of the three first ones. We suppose an activity equivalent to 1.2met and a clothing ensemble equivalent to 0.7clo
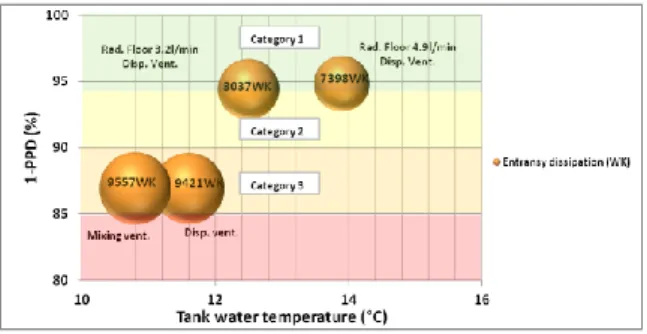
Fig. 6 Comparison of displacement ventilation combined with radiant floor, with mixing ventilation combined with radiant floor. If both systems run with the same tank water temperature (about 14.5°) and
the same water flow rate (3.2l/min) then the thermal comfort provided by the displacement ventilation (category 2 according to EN 15251) combined with radiant floor is better than that provided by mixing ventilation combined with radiant floor (category 3). If the chamber is only cooled by the ventilation then
entransy dissipation is much more important and tank water temperature is lower.
Fig. 7 Displacement ventilation combined with radiant floor. If we increase the water flow rate in the radiant floor then tank water temperature increases by 1.4°C from 12.5°C to 13.9°C while thermal comfort is maintained. Tank water temperature is well correlated with entransy dissipation. This figure also shows that ventilation when combined with radiant floor is better than ventilation alone in terms of entransy dissipation
and thermal comfort.
Category 1
Category 2 Category 3
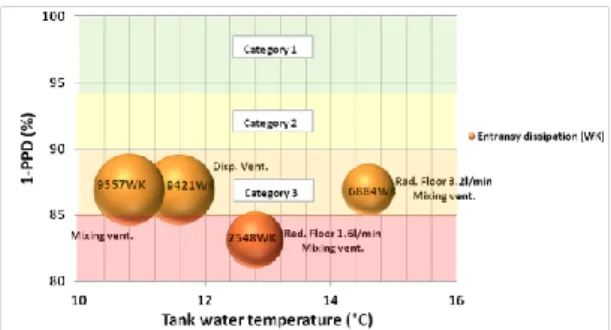
Fig. 8 Mixing ventilation combined with radiant floor: if the water flow rate increases from 1.6l/min to 3.2l/min then tank water temperature increases from by 1.8°C from 12.8°C to 14.6°C and thermal comfort
is better. Low water flow rate cannot be able to provide a thermal comfort respecting the standards even if the tank water temperature is lower. Entransy dissipation reflects the efficiency of the system and the compromise between thermal comfort and tank water temperature (energy consumption) if we suppose that pump consumption does not vary a lot. But this assumption will depend on the efficiency of the water pump
and in general of the size of the system.
Fig. 9 Displacement ventilation combined with radiant floor seems to be the best system in terms of entransy dissipation and thermal comfort. If we consider this combination then the best compromise between thermal comfort and energy consumption is the couple [3.2l/min; 14.5°C] because it provides a comfort equivalent to that of category 2 according to EN 15251 but less energy from production (tank water temperature) and
pump electricity consumption (water flow rate) is consumed than using other parameters.
Thermal comfort analysis and entransy analysis show that the best system is the combination of radiant floor with displacement ventilation. A good compromise is to run the system with a medium water flow rate and a high water temperature. Entransy dissipation seems to be a good indicator of the compromise cooling water tank temperature – water flow rate. Using only ventilation to cool the chamber is less efficient than using the combination of radiant floor with ventilation. A very low water flow rate cannot be able to meet a good thermal comfort because of the limitation of the emission and the low transfer coefficient between water and indoor environment as we can see in table 2.
Energy analysis. We applied a polynomial model to the chiller of the laboratory,
the CONSOCLIM model which had been developed by the Mines Paris Tech School [12]. We determined the model parameters from tests that were conducted in 2011 and
2012 on the reversible chiller of the laboratory [13,14]. This model is valid for a full load steady state. It assesses the COP of the machine depending on the cooling water temperature at the evaporator outlet and the outdoor air temperature at the condenser inlet. The model is described by the equation (7):
n 1 2 3 COP C C T C T COP . (7)
Where COPn is the nominal COP of the chiller and oa oa
evw evw n T T T T T . By using
results of tests [13,14] we found:
. . . 3 75 COP 1 7 5 T 77 1 T . (8)
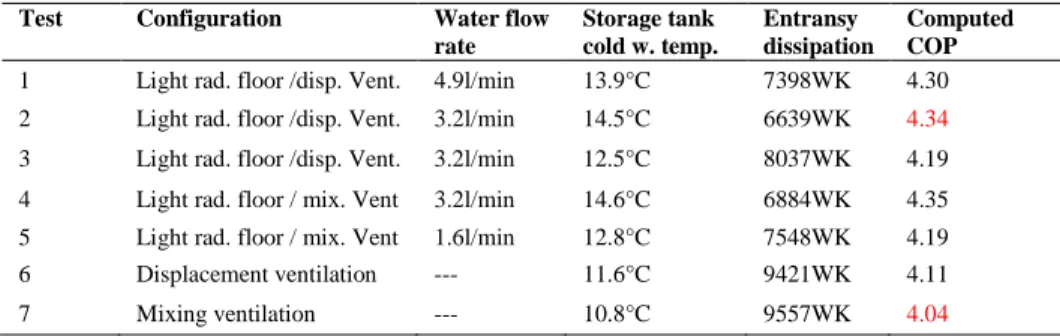
Table 3. Computed COP depending on cooling water temperature
Test Configuration Water flow
rate Storage tank cold w. temp. Entransy dissipation Computed COP
1 Light rad. floor /disp. Vent. 4.9l/min 13.9°C 7398WK 4.30 2 Light rad. floor /disp. Vent. 3.2l/min 14.5°C 6639WK 4.34
3 Light rad. floor /disp. Vent. 3.2l/min 12.5°C 8037WK 4.19 4 Light rad. floor / mix. Vent 3.2l/min 14.6°C 6884WK 4.35 5 Light rad. floor / mix. Vent 1.6l/min 12.8°C 7548WK 4.19
6 Displacement ventilation --- 11.6°C 9421WK 4.11
7 Mixing ventilation --- 10.8°C 9557WK 4.04
According to the CONSOCLIM model the COP of the chiller when combined with the mixing ventilation is 4.04 while the COP of the chiller when combined with the cooling radiant floor and the displacement ventilation in the second configuration is 4.34 which means an increase of 7.4%. Furthermore thermal comfort is increased from category 3 to category 2 according to Standards EN 15251. Entransy dissipation seems to be correlated with the compromise energy efficiency – thermal comfort.
3. Conclusion
We evaluated seven HVAC terminal units for an office and their operating parameters temperature and water flow rate in cooling mode by analyzing the thermal comfort and the entransy dissipation which is represented by the T-Q diagram. The study showed that the combination of the displacement ventilation with the radiant cooling floor running with a medium water flow rate is the most efficient system. Tests also showed that the minimum entransy dissipation corresponded to the optimum thermal comfort – energy efficiency. Thus the T-Q diagram seems to be an interesting tool for the choice of HVAC terminal units and their design. This early work was
performed in cooling mode and the extension of this study would be to conduct experiments in heating mode.
Acknowledgment
The Walloon Region is gratefully acknowledged for funding this research which is a part of the IEA EBC Annex 59 project.
References
[1] Jiang Y. Final report, I. Guide book of new analysis method for HVAC system. Low temperature heating and high temperature cooling. International Energy Agency IEA ECB Annex 59, Subtask 1, December 2015.
[2] Olesen B. W. Final report, II. Demand and novel design of indoor terminals in high temperature cooling and low temperature heating system. Low temperature heating and high temperature cooling. International Energy Agency IEA ECB Annex 59, Subtask 2, December 2015.
[3] Guo Z.Y., Zhu H.Y., Liang X.G. Entransy – A physical quantity describing heat transfer ability. International Journal of Heat and Mass Transfer 50 (2007) 2545-2556.
[4] Xu M., Guo J., Cheng L. Application of entransy dissipation theory in heat convection. Front. Energy Power Eng. China 2009, 3(4): 402-405.
[5] Wu J., Cheng X. Generalized thermal resistance and its application to thermal radiation based on entransy theory. International Journal of Heat and Mass Transfer 58 (2013) 375-381.
[6] Guo Z.Y., Liu X.B., Tao W.Q., Shah R.K. Effectiveness-thermal resistance method for heat exchanger design and analysis. International Journal of Heat and Mass Transfer 53 (2010) 2877-2884.
[7] Qian X., Li Z. Analysis of entransy dissipation in heat exchangers. International Journal of Thermal Sciences 50 (2011) 608-614.
[8] Cheng X., Zhang Q., Liang X. Analyses of entransy dissipation, entropy generation and entransy – dissipation-based thermal resistance on heat exchanger optimization. Applied Thermal Engineering 38 (2012) 31-39.
[9] Zhang L., Liu X., Jiang Y. Application of entransy in the analysis of HVAC systems in buildings. Energy 53 (2013) 332-342.
[10] Standard ISO 7730. 2005. Ergonomics of the Thermal Environment – Analytical Determination and Interpretation of Thermal Comfort using Calculation of PMV and PPD indices and Local Thermal Comfort Criteria.
[11] Standard EN 15251. 2007. Critères d’Ambiance Intérieure pour la Conception et Evaluation de la performance Energétique des Bâtiments couvrant la Qualité de l’Air Intérieur, la Thermique, l’Eclairage et l’Acoustique.
[12] Rivière P. Performances saisonnières de groupes de production d’eau glacée. Phd thesis Mines Paris Tech School (2010) 67-68.
[13] P.Y. Franck, S. Thomas, P. André. Analyse des données enregistrées entre le 1 octobre 2010 et le 30 avril 2011, sur la pompe à chaleur reversible Zubadan Mitsubishi installée dans la maison J. Geelen du campus d’Arlon de l’ULG. Internal report: BEMS-ULG (2011).
[14] S. Thomas. Analysis of solar air conditioning systems and their integration in buildings. Phd thesis ULG (2013) 194-196.