HAL Id: hal-00734895
https://hal.archives-ouvertes.fr/hal-00734895
Submitted on 24 Sep 2012
HAL is a multi-disciplinary open access
archive for the deposit and dissemination of sci-entific research documents, whether they are pub-lished or not. The documents may come from teaching and research institutions in France or abroad, or from public or private research centers.
L’archive ouverte pluridisciplinaire HAL, est destinée au dépôt et à la diffusion de documents scientifiques de niveau recherche, publiés ou non, émanant des établissements d’enseignement et de recherche français ou étrangers, des laboratoires publics ou privés.
Cardiopulmonary Activity Monitoring with Contactless
Microwave Sensor
Dany Obeid, Gheorghe Zaharia, Sawsan Sadek, Ghaïs El Zein
To cite this version:
Dany Obeid, Gheorghe Zaharia, Sawsan Sadek, Ghaïs El Zein. Cardiopulmonary Activity Monitoring with Contactless Microwave Sensor. Mediterranean Microwave Symposium 2012, Sep 2012, Istanbul, Turkey. pp.1-4. �hal-00734895�
Cardiopulmonary Activity Monitoring with
Contactless Microwave Sensor
Dany Obeid1, Sawsan Sadek2, Gheorghe Zaharia3, and Ghais El Zein3 1Kaptalia Monitoring, Prisme 2 - PIBS, 56000 Vannes, France
2IUT-Saida, Lebanese University
3IETR-INSA, UMR CNRS 6164, 20 Avenue des Buttes de Coësmes, CS 70839, 35708 Rennes Cedex 7, France d.obeid@kaptalia.com
Abstract— The aim of this paper is to provide a contactless
microwave sensor allowing continual remote monitoring of the heartbeat and respiratory rates. This work provides a comparative study to signal detection of heartbeat, considering different frequencies and transmission powers. In addition, a model based on cardiorespiratory measure is presented. This determines the most accurate signal processing technique for the lowest possible signal to noise ratio (SNR) values. This practical approach is a necessary step before dealing with the hardware implementation and system integration.
Keywords; microwave sensors; contactless monitoring; heart rate variability;
I. INTRODUCTION
The measurement of heart and breathing rates may be practiced often in emergency or clinical situations. The rates extraction of heartbeat and breathing gives information at several levels [1-3]. The use of Doppler radar is an important tool for such applications. Indeed, a moving target reflects the transmitted signal with a phase shift, which depends on the position of the target [4, 5]. Therefore, the signal reflected from the chest of a person contains information about the movement of the chest due to heartbeat and respiration. Initially, a life sign signal can be identified. This is useful, for example, for detecting movements under rubble after an earthquake. Another important parameter is the change in heartbeat rate, namely Heart Rate Variability (HRV). HRV can predict disease states and beat-to-beat measurements can be evaluated to determine the presence of cardiac abnormalities.
This paper presents a microwave system for the detection of cardio-respiratory activities. The proposed system allows the detection of heart beat signal at a distance of 1 m, using multiple operating frequencies: 2.4, 5.8, 10, 16 and 60 GHz, and for several transmitted power between 0 and -27 dBm. Based on measurements, a model representing the cardiopulmonary activity is proposed.
The rest of this paper is organized as follows: section 2 describes the proposed system and the obtained results. Section 3 shows the detection of heart rate changes. Section 4 deals with the cardiopulmonary modeling (heart beat and breathing). Finally, a summary of the work is presented in section 5.
II. MEASUREMENTS AND OBTAINED RESULTS
The proposed system uses a vector network analyzer (VNA) and two horn antennas. The installation of this system is simple and fast as presented in Fig. 1.
Figure 1. Schematic of the proposed system.
In order to achieve a signal frequency of 60 GHz, an up-conversion and down-up-conversion techniques are used respectively at the transmission and reception. The 3.5 GHz signal provided by the network analyzer is converted at 60 GHz with a mixture of a local oscillator signal of 56.5 GHz. The system operating at 60 GHz is shown in Fig. 2 [6]. At a distance of 1 m from a person with a total transmitted power (including antenna gain) of -10 dBm, our system was used at different frequencies: 2.4, 5.8, 10, 16, and 60 GHz.
Figure 2. Design of the system operating at 60 GHz.
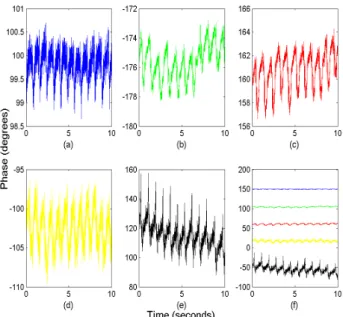
Fig. 3 shows the phase variation of the parameter S21 at several
The authors acknowledge CEDRE (project reference number: 08SciF6/L4), AUF (project reference number: G3-110/1649), and “Région Bretagne” for partially funding this work.
frequencies due to the heart beating. It can be noticed that the phase variation increases as the frequency increases. Thus, a greater sensitivity to small displacements is obtained at higher frequencies. This will reduce the effect of noise and increase the detection precision of signal peaks. In addition to the frequency parameter, the minimum transmitted power is an important parameter to be determined. Indeed, it is safer for patients and medical staff to be subject to as low emission levels as possible. For a fixed frequency (2.4 GHz), measurements were performed for different power levels: -2 dBm, -7 dBm, -12 dBm, -17 dBm, -22 dBm, and -27 dBm.
Figure 3. Phase variations due to heartbeat detected at: (a) 2.4 GHz (b) 5.8 GHz, (c) 10 GHz, (d) 16 GHz, (e) 60 GHz and (f) with all frequencies.
Fig. 4 shows the phase variations due to heartbeats obtained for different transmission powers. One can notice that the reduction in transmit power makes the peaks of the measured signal more noisy. This makes the extraction of the heartbeat rate changes less accurate.
Figure 4. Phase variations due to heartbeat detected at 2.4 GHz for the different transmission powers: (a) - 2 dBm, (b) - 7 dBm, (c) -12 dBm, (d) -17
dBm, (e) -22 dBm and (f) -27 dBm.
III. HEART RATE VARIABILITY
Extracting heartbeat rate can be determined by the application of the FFT (Fast Fourier Transform). This gives a frequency corresponding to an average heartbeat rate. However, the average frequency does not provide the temporal variation of the cardiac rhythm HRV that is a measure of changes in the duration between two successive beats (this is equivalent to the RR-interval of the ECG signal). This HRV parameter is considered as an activity monitor autonomous regulation of circulatory function. Its extraction requires a maximum detection in the time domain. A simple example of information extraction in the time domain is the calculation of standard deviation of the beat-to-beat intervals.
Fig. 5 shows the signal detected at 16 GHz with a total transmit power of -25 dBm and shows the peaks detected with the implementation of the Peak Detection Method (PDM). This technique is based on detecting the maximum value in a sliding window [6].
A smoothing technique, based on a sliding averaging, is used to reduce the noise [6]. During the period of 10 seconds of each experiment, the heartbeat rate is calculated for both the original signal and the smoothed signal. However, the difference between heartbeat rate extracted from the original signal and that obtained from the smoothed signal is low. The HRV is extracted both from the original signal and the smoothed signal.
Figure 5. Beats of the heart detected at 16 GHz for a transmit power of -25 dBm.
Fig. 6 (a-e) shows the HRV signals detected at 2.4, 5.8, 10, 16, and 60 GHz, for a total transmit power of -10 dBm.
Figure 6. Heart rate variability at: (a) 2.4 GHz; (b) 5.8 GHz; (c) 10 GHz; (d) 16 GHz and (e) 60 GHz.
It can be seen from this figure that the difference between the HRV obtained from the measured signal and the HRV signal obtained after smoothing, increases with decreasing frequency. This effect is due to the amplitude of the phase variation, which is directly proportional to the transmission frequency.
Similarly, Fig. 7 (a-f) shows the HRV detected at -2 dBm, -7 dBm, -12 dBm, -17 dBm, -22 dBm and -27 dBm, for a frequency of 2.4 GHz. As the SNR increases, the transmit power increases and the signal becomes less noisy; this reduces the effect of smoothing. One can notice the difference between the HRV of the original signal (blue) and the smoothed signal (red) for several transmission powers.
Figure 7. Heart rate variability for measurements performed at 2.4 GHz for the transmission powers: (a) 2 dBm, (b) 7 dBm, (c) 12 dBm, (d) 17 dBm, (e)
-22 dBm and (f) -27 dBm.
IV. MEASUREMENT-BASED CARDIOPULMONARY
MODELING
In order to reduce the measurement campaigns that can be cumbersome and costly, a cardio respiratory activity modeling is necessary. This helps determining the appropriate signal processing method. Triangular waves with variable frequency and amplitude are modeled to represent the cardio respiratory signal. The signal is modeled according to the following relationships: ) ( ) ( ) (X A k X B k Y = u + u for :
[Xu(i)+ Xd(i)]≤ X ≤ Xu(k)+ [Xu(i)+ Xd(i)]
i=1 k−1
∑
i=1 k−1∑
and ( ) d( ) d( ) Y X =A k X B k+ for:Xu(k)+ [Xu(i)+ Xd(i)]≤ X ≤ Xu(k)+ [Xu(i)+ Xd(i)] i=1 k
∑
i=1 k−1∑
where Au and Bu represent the coefficients of the rising part of
the curve. Ad and Bd represent the coefficients of the falling
portion of the curve. Xu and Xd represent respectively the
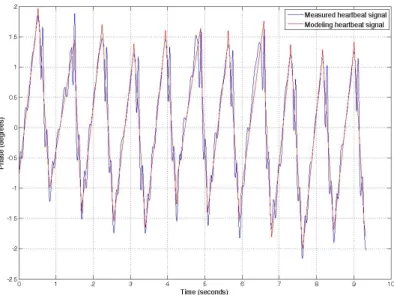
durations of these two parts of the pulse. The sum of these two times is the duration of the pulse. In the above relationships, k is the number of pulses. Compared to the measured signal, the proposed model shows an accuracy of 100% in terms of heartbeat rate, while it shows a mean relative error of 0,12% in terms of HRV.
The heartbeat signal and the measured signal modeling are presented in Fig. 8.
Figure 8. Comparison between the measured heartbeat signal at 5.8 GHz and the proposed modeled signal.
The separation of heartbeat and breathing signals is done using different techniques. Thus, the application of an FFT to extract the heart rate showed a mean relative error of 1% for an SNR between 0 and -20 dB, whereas with the PDM method applied after a Chebyshev filter, this error is approximately 9.1%. The application of the PDM for the extraction of heartbeat rate after wavelet filtering shows a 100% accuracy. The application of the PDM to the filtered signal with wavelet shows a measurement accuracy of heartbeat rate of 100%. On the other hand, the wavelet transform shows the possibility to extract the HRV with a mean relative error of about 4.5%. Fig. 9 shows the mean relative error to extract the HRV from the modeled signal after applying the wavelet transform to SNR values between 0 and -20 dB.
[5] Figure 9. Average relative error for the extraction of HRV after applying the
wavelet transform to modeled cardio respiratory signals.
V. CONCLUSION
A contactless measuring system for the cardio-pulmonary activity, using the propagation of electromagnetic waves and
microwave Doppler effect, is proposed. At a distance of 1 meter, our system is tested for several different frequencies and transmitted powers, with and without breathing. The originality of the proposed system is the ability to vary the operating frequency and the transmitted power with the same hardware. This is necessary to conduct a detailed parametric study. Experiments were performed at several frequencies: 2.4, 5.8, 10, 16, and 60 GHz. For a fixed frequency of 2.4 GHz, measurements were also performed at different power levels: -2, -7, -1-2, -17, -2-2, and -27 dBm. A second part of the study deals with the modeling of cardiopulmonary signals and with the application of advanced methods for processing modeled signals. Thus, several techniques have been implemented for the separation of cardiopulmonary signals such as the use of filtering or the wavelet transform.
REFERENCES
[1] Lubecke O. B., et al., "10 GHz Doppler Radar Sensing of Respiration
and Heart Movement," Proceedings of the IEEE 28th Annual Northeast
Conference, Bioengineering Conference, 2002.
[2] H. R. Chuang, Y. F. Chen, and K. M. Chen, "Microprocessor-controlled automatic clutter-cancellation circuits for microwave systems to sense remotely Physiological nib-through the rubble," in Instrumentation and Measurement Technology Conference, 1990, p. 177-181.
[3] J. Lin, J. Kiernicki, Kiernicki M., and P. Wollschlaeger, "Microwave
apexcardiography," Microwave Theory and Techniques, IEEE
Transactions on, vol. 27, no. 6, p. 618-620, Jun. 1979.
[4] Y. Xiao, J. Lin, O. B. Lubecke, and V. M. Lubecke, "Frequency tuning technology for remote detection of heartbeat and respiration using low-power bouble-sideband transmission in Ka-band," IEEE Trans. Microw. Theory Tech., Vol. 54, no. 5, p. 2023-2032, May 2006.
Q. Zhou, J. Liu, A. H. Madsen, O. B. Lubecke, and V. Lubecke,
"Detection of multiple heartbeats using Doppler radar," in International
Conference on Acoustics, Speech, and Signal Processing, vol. 2, 2006, p. 1160-1163.
[6] D. Obeid, S. Sadek, G. Zaharia, and G. El Zein, "Multi-tunable
Microwave System for Touch-less Heartbeat Detection and Heart Rate Variability Extraction," Microwave and Optical Technol. Letters, Vol.