HAL Id: hal-01076285
https://hal.archives-ouvertes.fr/hal-01076285
Submitted on 4 Nov 2014
HAL is a multi-disciplinary open access
archive for the deposit and dissemination of
sci-entific research documents, whether they are
pub-lished or not. The documents may come from
teaching and research institutions in France or
abroad, or from public or private research centers.
L’archive ouverte pluridisciplinaire HAL, est
destinée au dépôt et à la diffusion de documents
scientifiques de niveau recherche, publiés ou non,
émanant des établissements d’enseignement et de
recherche français ou étrangers, des laboratoires
publics ou privés.
Characterization of Few Mode Fibers by OLCI
Technique
R. Gabet, Elodie Le Cren, C. Jin, Michel Gadonna, B. Ung, Yves Jaouën,
Monique Thual, Sophie La Rochelle
To cite this version:
R. Gabet, Elodie Le Cren, C. Jin, Michel Gadonna, B. Ung, et al.. Characterization of Few Mode
Fibers by OLCI Technique. 40th European Conference on Optical Communication (ECOC 2014), Sep
2014, Cannes, France. �10.1109/ECOC.2014.6963921�. �hal-01076285�
Characterization of Few Mode Fibers by OLCI Technique
R. Gabet(1), E. Le Cren(2), C. Jin(3), M. Gadonna(2), B. Ung(3), Y. Jaouën(1), M. Thual(2), S. LaRochelle(3)
(1)
Institut Télécom / Télécom ParisTech, CNRS/LTCI UMR5141, 46 rue Barrault, Paris, France.
renaud.gabet@telecom-paristech.fr
(2)
Université Européenne de Bretagne, CNRS/UMR 6082 Foton, 6 rue de Kérampont 22300, Lannion, France. elodie.lecren@enssat.fr
(3)
Centre d'optique, photonique et laser, ECE Department, Université Laval, Québec, QC G1V 0A6, Canada. sophie.larochelle@gel.ulaval.ca
Abstract : All LP modes of a few mode fiber are simultaneously characterized using phase-sensitive
optical low-coherence interferometry. The differential modal group delay and absolute chromatic dispersion values of each mode are retrieved from a single measurement without spatial mode transformers.
Introduction
In recent years, advanced modulation formats with coherent detection have resulted in a remarkable capacity increase of optical communication links, enabling 100 Gbit/s and 400 Gbit/s per channel transmissions. Despite these significant advances, the capacity of optical fibers is expected to reach its limit unless other multiplexing strategies, such as mode division multiplexing (MDM) with multiple-input multiple-output (MIMO) digital signal processing, are considered [1]. Performance optimization of MDM transmissions requires management of channel parameters [3] for which precise knowledge of the LP mode characteristics, including their group delay (GD), dispersion (GVD) and mode-dependent loss, is particularly important.
Different methods have been proposed to characterize LP modes of few mode fibers (FMF). The well-known phase shift method is well suited for characterizing each mode individually. Other methods that can characterize FMF, without mode converters, include interferometric techniques with either RF or spectral measurements [5]. The main drawback with most of these approaches is that the measurement only extracts the dispersion of each mode relative to the fundamental mode. Moreover, these methods can fail if the group delays of the modes are too close.
In this paper, we show that the OLCI technique, in combination with a numerical method called "time-wavelength mapping" [7], can retrieve the mode properties of FMF without mode converters, irrespective of the relative power level of each mode and even if their group indices are close. We will compare these results with the well-known S² method [8].
Experimental setup
The OLCI is a Mach-Zehnder interferometer, illuminated by a broadband source, with a
scanning reference mirror in one arm and the FMF under test in the other (Fig. 1). An Er3+ superfluorescent source with a flat-top spectrum allows characterizing device-under-test (DUT) over the entire C+L band (i.e., 1525-1605nm). The interferogram is obtained by scanning the optical path difference between the two arms at a constant velocity (~1.0mm/s).
The interferometric signal is detected using a low-noise balanced photodetector. Interference only occurs when the optical path difference is less than the coherence length of the OLCI broadband source. In order to keep track of the absolute position of the reference mirror, the zero-crossing of a coherent interferometric signal at 632.8nm is used to trigger sampling of the optical path difference with a ~80nm period. The interferogram I() can be expressed as function of the optical path difference expressed in time domain as:
(1) Fig. 1: OLCI Experimental setup
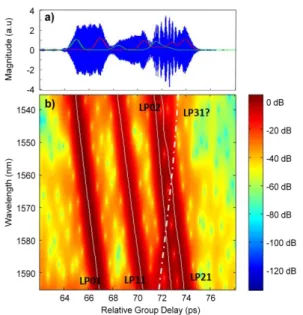
where S() and are the power spectrum of the OLCI source and the complex transmission coefficient of the DUT, respectively. It is therefore possible to deduce the GD by extraction and derivation of the wavelength dependent phase function [9]. However, major difficulties can occur whenever the group indices of the different LP modes are sufficiently close to induce overlapping signals in the interferogram thus producing beating in the measured GD evolution, e.g. in Fig.2.a (blue trace) between 70-74ps relative GD. This beating makes identifying each LP mode on the interferogram difficult and sometimes impossible. To overcome modal overlapping issues, a numerical method called "time-wavelength mapping" has been proposed to extract GD properties of each mode independently [7]. Having access to the complete interferogram signal, we numerically apply a sliding-wavelength filter in the spectral domain. The Gaussian filter bandwidth (~few nm) is chosen as a trade-off between source coherence and expected DUT dispersion to optimize the spatial resolution. Finally, after inverse Fourier transform of the filtered signal, we obtain the wavelength dependent modulus of the interferogram. The result is the 3D graph shown in Fig. 2b. This method is more versatile than the one presented in [6] which need mode converter to treat each mode separately.
Results and comments
Fig. 2.a. presents two “cuts” of the interferogram of a 778mm of the characterized fiber reconstructed after numerical filtering with a 10nm 3dB-bandwidth (BW) filter centered at
1535nm (in green) and at 1595nm (in red). Note that a ~10nm filter allows maximizing resolution in terms of GD evolution.
Unlike previously published work [8], this time, the fiber is analyzed in a transmission configuration (OLCI). This was found to be necessary in order to remove partial mode coupling resulting from reflection at the output fiber end. This mode coupling multiplies the number of possible optical path per round trip and creates confusion in the data interpretation. The ”time-wavelength mapping" of the recorded interferogram is shown in Fig. 2.b. It then becomes easy to numerically extract the position of each mode with respect to wavelength (white solid lines) and to deduce GD evolution. In the present case, we can clearly identify four LP modes: LP01, LP11, LP21
and LP02. On this short length of fiber, we also
observe a LP31 mode that is very close to cut-off
in the simulations and is not analyzed further (dot-dash line in Fig. 2).
In Fig.3, we plot the corresponding differential modal group delay (DMGD) of each mode (solid lines) with respect to the LP01 mode (Fig. 3).
The interferogram is analyzed with reference to the modes predicted by numerical simulations performed with a commercial mode solver (Optifiber). Calculations are done using a step index profile (NA=0.17,
core=15 m) withparameters based on the fiber specifications and measurements done using a refracted near-field analyzer (Exfo NR-9200HR, refractive index resolution of 1.10-4, spatial resolution of 0.1µm). The main benefit of the simulation is to provide a sound framework to identify the modes and we observe a generally good agreement between experiment (solid lines in Fig. 3) and simulations (dashed lines in Fig. 3). To validate these measurements, we compare the extented OLCI with the well-known S² method (points with error bars in Fig.3). The 3Fig. 2: a) Recorded interferogram (blue), interferogram
after 10nm BW numerical filtering at 1535/1595nm
(green/red). b) Corresponding time-wavelength
mapping. White solid lines, GD fit of LP01, LP11, LP21 and
LP02; dot-dash white line, possible LP31.
Fig. 3: Differential modal group delay of each mode with
respect to LP01 mode. Solid lines: experiment. Dashed lines: simulations. Points with error-bars : S² method.
latter technique is based on a spatially resolved measurement of the spectral interference between coherent modes propagating with different group delays in the DUT [8]. The S² measurement method gives the intensity and group delay of higher order modes with respect to the LP01 mode at a given central wavelength.
This method requires that the power injected in the fundamental mode be dominant.
Fig.4 shows an example of the measurement centered at a wavelength of 1550nm. The resolution is 0.04ps/m. On this figure we can see that LP02 mode appears over a certain
range of group delays referred to as LP02 min
and LP02 max. DMGD of each mode are
reported in Fig. 3 for five different wavelengths from 1550 to 1590nm. Note that for the S2 method, the group delay and dispersion of the fundamental mode are deduced by numerical simulations or needs to be measured by another technique. The results obtained with S2 technique confirm those obtained by OLCI.
Fig. 5 presents the dispersion of each LP mode, calculated from group delay curves measured by OLCI. We see that three modes (LP01, LP11
and LP21) are dominated by material dispersion
(20-25 ps/nm/km), which is not the case of the LP02 mode that presents a lower dispersion,
around 10 ps/nm/km. It is important to note that the OLCI technique allows to extract absolute dispersion values of each mode whereas S2 technique gives access only to the value of relative dispersion compared to the fundamental mode, which is determined in this case by simulation [8]. These results are in agreement with each other and validate the OLCI technique. Also, wavelength-dependent losses
of each mode can be extracted but in this case, no significant variations were observed over the measured spectral range.
Conclusion
We demonstrated that the OLCI method, in a transmission configuration, combined to numeri-cal spectral filtering, is a powerful method to rapidly characterize few modes fibers over the whole C+L band. Absolute values of group delay and dispersion of each mode are obtained in a single scan without mode converters. These results are confirmed by S2 method and numerical simulations.
References
[1] R.J. Essiambre et al., “Capacity limits of optical
networks,“ J. Light. Tech., vol. 28, n°4, p.662 (2012).
[2] P. Winzer, “MIMO capacities and outage probabilities in
spatially multiplexed optical transport networks”, Optic Exp., 19, p. 1680 (2011)
[3] P. Sillard et al., “A review of Few-Mode Fibers for
Space-Division Multiplexed Transmissions,” Proc ECOC, Mo.3.A.1, London (2013).
[4] J.W. Nicholson et al., “Electrical Spectrum
Measurements of Dispersion in Higher Order Mode Fiber,” Photon. Tech. Lett. , Vol. 15, no. 6, p. 831 (2003).
[5] D. Menashe et al., “Interferometric technique for
measuring dispersion of High order modes in optical fibres,” Elec. Lett. Vol. 37, no. 24, p. 1439 (2001).
[6] D. N. Schimpf et al., “Optical low-coherence
interferometry for reconstruction of the modal-content in few-mode fibers,” Proc. CLEO CFM6, Baltimore (2011). [7] R. Gabet et al., “Versatile Characterization of Specialty
Fibers Using the Phase-Sensitive Optical Low-Coherence Reflectometry Technique,” J. Light. Tech., Vol. 27, no. 15, p. 3021 (2009).
[8] D.M. Nguyen et al., “Modal decomposition technique for multimode fibers,“ Ap. Opt, Vol. 51, no. 4, p.450, (2012). [9] P. Hamel et al., “Optical low-coherence reflectometry for
complete chromatic dispersion characterization of few-mode fibers”, Optics Lett., Vol. 32, no 9, p1029 (2007).
Fig. 5: Dispersion of each mode: solid lines: experiments,
dashed lines: simulations. Points with error-bars : S² method.
Fig. 4: Intensity and group delay of each mode with
respect to LP01 mode with associated transverse intensity profiles obtained with S² method (wavelength: 1550 nm).