HAL Id: hal-01234315
https://hal.archives-ouvertes.fr/hal-01234315
Submitted on 1 Dec 2015HAL is a multi-disciplinary open access archive for the deposit and dissemination of sci-entific research documents, whether they are pub-lished or not. The documents may come from teaching and research institutions in France or abroad, or from public or private research centers.
L’archive ouverte pluridisciplinaire HAL, est destinée au dépôt et à la diffusion de documents scientifiques de niveau recherche, publiés ou non, émanant des établissements d’enseignement et de recherche français ou étrangers, des laboratoires publics ou privés.
Visible And Near Infrared Spectroscopy For PSE-Like
Zones Classification At Different Post Mortem Times
Thierry Lhommeau, Antoine Vautier, Jean-Marc Goujon, Ronan Le Page
To cite this version:
Thierry Lhommeau, Antoine Vautier, Jean-Marc Goujon, Ronan Le Page. Visible And Near Infrared Spectroscopy For PSE-Like Zones Classification At Different Post Mortem Times. 61st International Congress of Meat Science & Technology (ICOMST 2015), Aug 2015, Clermont-Ferrand, France. �hal-01234315�
VISIBLE AND NEAR INFRARED SPECTROSCOPY FOR PSE-LIKE
ZONES CLASSIFICATION AT DIFFERENT POST MORTEM TIMES
T. Lhommeau
1, A. Vautier
1, J-M. Goujon
2and R. Le Page
21 Ifip - Institut du Porc, La Motte au Vicomte, 35651 Le Rheu, France 2 CNRS, UMR Foton, Université de Rennes 1, ENSSAT, F-22305 Lannion, France.
Abstract – The ability of visible and near infrared spectroscopy (VIS-NIRS) to predict PSE-like zone classification was examined on 150 deboned hams at 5 post mortem times (12, 16, 20, 24 and 36 h pm). Four probes were used to investigate the accuracy. Two of our probes were prototypes. Partial Least Squares Discriminant Analysis (PLSDA) was used to determine the prediction models from spectrums recorded on semimembranosus muscle. Surface probes gave better results than inserted probes. The best probe showed moreover a good accuracy whatever the pm times was when measuring (78 to 86 % good prediction in external validation as the 24 h pm model was used). Its false negative/false positive ratios were favorable at the early pm times (12 to 20 h pm). So an early PSE-like zones prediction is possible using VIS-NIRS.
The prototype probe inserted showed good results (82,9% good prediction in external validation) and would deserve additional validation on bone-in hams, as industrials need.
Key Words – VIS-NIR spectroscopy, prototype probes, pork meat, PSE-like zones, PLSDA.
I. INTRODUCTION
PSE-like zones result in a loose of muscle fiber structure and pale color in ham meat [1]. It is characterized by a disorganization of the myofiber alignment, disrupted fibers and an increased extracellular space [2, 3]. SHG microscopy showed that there is no proteolysis in PSE-like zones, as found in control [4]. This defect is a major cause of slicing losses in the French “jambon supérieur” cooked ham process. Industrials need therefore to sort raw meats especially because recipes become less and less salted. VIS-NIR spectroscopy is now known as a reference method for meat composition assessments and for predicting the meat quality parameters such as ultimate pH, color, texture, or drip loss [5]. The aim of this study was to
investigate the NIRS ability to predict PSE-like class of deboned hams at different post mortem times. The use of new probes was planned in order to improve the prediction models.
II. MATERIALS AND METHODS
150 hams were randomly selected at a slaughterhouse and deboned. VIS-NIRS measurements were performed with an ASDI spectrometer Labspec 4 at 12, 16, 20, 24 and 36 h post mortem times. Four probes were used, 2 from ASDI company (named BTS, BTP in this text, fig.1) and 2 probes were specially designed for this application (named FOS, FOP in this text, fig 2). BTS and FOS probes were applied on the surface of the semimembranosus muscle (center of internal face). BTP and FOP probes were inserted in semimembranosus from the outer side of the muscle to a point at 1 or 2 cm from the surface measurement site. The FOS probe uses the interactance mode, while the 3 others probes (BTS, BTP, and FOP) use the reflexion mode. PSE-like zone quotation (PSE–like zone IFIP scale [6]), meat color (L*a*b*, Minolta CR 300), and pH (Sydel pH-meter equipped with a Mettler Toledo and lot 406 electrode) were recorded at each time of NIRS measurement. In order to preserve hams from discoloration and deshydratation, a polyethylene film (8 μm) was laid on the meat between measurements. PSE-like classes 1 and 2 were grouped, as classes 3 and 4 for the prediction model determination. One in four wavelengths in the 350-1800 nm range was kept and used to determine PLSDA prediction models. The ‘crossplsda’ and ‘basic plsda’ procedures of the toolbox Saisir of Matlab® were used for model
determination. The calibration sets were composed of one hundred hams randomly chosen, and external validation sets were composed of the 50 remaining hams. During the calibration/cross
validation procedure the calibration sets were randomly divided in a 66 hams population for model determination while 33 hams served for cross validation. Cross validation were run one hundred times with PLS component numbers varying from 1 to 20 (figure 3). The PLS component number that was used for the prediction model determination corresponded to the first minimum of mean of false classification rate in cross validation.
Figure 1. BTS probe (left) and BTP probe (right).
Figure 2. FOP probe (left) and FOS probe (right).
Figure 3. Cross validation procedure, 100 times, BTP probe, 24 h pm, n=100 hams. …..mean of good prediction rate in calibration; ---- mean of false
prediction rate in cross validation.
The prediction model were finally determined using the “plsda” procedure with the appropriate PLS component numbers. External validations of models were run on the external validation sets (50 hams).
III. RESULTS AND DISCUSSION
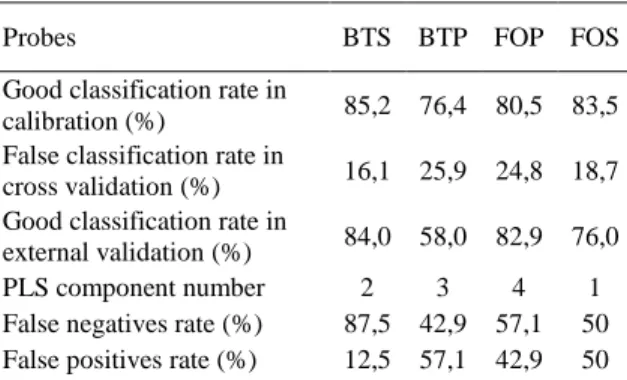
Table 1 shows performances of prediction models performed with the four probes at 24 h pm. The prediction models developed with the BTS and FOS probes showed better levels of good classification in calibration compared to the BTP and FOP probes (respectively 85,2 and 83,5 vs 76,4 and 80,5). These levels of performance were in accordance with errors of prediction obtained in cross validation (respectively 16,1 and 18,7 vs 25,9 and 24,8).
Table 1 Prediction accuracy of the four probes at 24 h pm,
Probes BTS BTP FOP FOS
Good classification rate in
calibration (%) 85,2 76,4 80,5 83,5 False classification rate in
cross validation (%) 16,1 25,9 24,8 18,7 Good classification rate in
external validation (%) 84,0 58,0 82,9 76,0
PLS component number 2 3 4 1
False negatives rate (%) 87,5 42,9 57,1 50 False positives rate (%) 12,5 57,1 42,9 50 In Table 1, BTS probe showed a better level of accuracy in external validation than FOS probe (respectively 84% vs 76% of good classification) but it had more false negatives than the FOS probe : the BTS model seemed not able to detect a large part of PSE-like zones. The FOP probe showed a good level of performance in external validation (83 %).
Table 2 Effect of post mortem time on the prediction accuracy of the BTS probe.
Post mortem times 12 16 20 24 36 Good classification rate
in calibration (%) 84,0 82,4 83,8 85,2 79,7 False classification rate
in cross validation (%) 16,4 17,9 17,2 16,1 20,8 Good classification rate
in external validation (%) 86 78 82 84 80 0 10 20 30 40 50 60 70 80 90 100 1 2 3 4 5 6 7 8 9 10 11 12 13 14 15 16 17 18 19 20 % PLS component number
PLS component number 1 1 1 2 1 False negatives rate (%) 71,4 63,6 66,7 87,5 60 False positives rate (%) 28,6 36,4 33,7 12,5 40 The performance of the BTS probe was not affected by post mortem time between 12 and 24 h pm, table 2. We noted however a degradation of its accuracy at 36 h pm. These good levels of performance were confirmed in external validation (78 to 86 % good classification) but the false negatives/false positives ratio remained unfavorable at every pm times. These results showed however that it was possible to predict PSE-like class at 12 h pm with this probe.
Table 3 Effect of post mortem time on the prediction accuracy of the FOS probe.
Post mortem times 12 16 20 24 36 Good classification rate
in calibration (%) 83,4 81,3 80,3 83,5 78,3 False classification rate
in cross validation (%) 18,6 19,9 20,1 18,7 23,3 Good classification rate
in external validation (%) 74 80 74 76 74 PLS component number 1 2 1 1 1 False negatives rate (%) 30,8 50 38,5 50 15,4 False positives rate (%) 69,2 50 61,5 50 84,6 In table 3 we observed a similar effect of the pm time on the BTS probe in the calibration results of the FOS probe. Prediction performances were stable between 12 and 24 h pm but decreased at 36 h pm. The level of performance in calibration of the FOS probe was globally comparable to the BTS probe one but 1 or 2 points below. This was confirmed in external validation because the FOS probe showed 6 points lower results in average than the BTS probe. However its ratio of false negatives/false positives was more well-balanced than the BTS probe and for each pm times.
Table 4 Effect of post mortem time on the prediction accuracy of the BTP probe.
Post mortem times 12 16 20 24 36
Good classification rate
in calibration (%) 74,2 81,8 74,5 76,4 74,0 False classification rate 32,1 25,3 34,5 25,9 30,3
in cross validation (%) Good classification rate
in external validation (%) 76 68 74 58 66 PLS component number 3 5 4 3 3 False negatives rate (%) 66,7 62,5 53,8 42,9 52,9 False positives rate (%) 33,3 37,5 46,2 57,1 47,1 As seen in table 1, performances of the probes inserted in meat were lower than those used on the surface, table 4. The results of the BTP probe were the lowest of this study in calibration. Performances in external validation of the BTP probe were 68 % good classification in average. It’s not enough for industrial purpose.
Table 5 Effect of post mortem time on the prediction accuracy of the FOP probe.
Post mortem times 12 16 20 24 36
Good classification rate
in calibration (%) 80,3 79,8 87,0 80,5 77,9 False classification rate
in cross validation (%) 20,7 20,8 21,1 24,8 24,5 Good classification rate
in external validation (%) 75,6 78,0 73,2 82,9 73,2 PLS component number 1 1 5 4 1 False negatives rate (%) 40 66,7 54,5 57,1 63,6 False positives rate (%) 60 33,3 45,5 42,9 36,4 The FOP probe showed intermediate results between probes used on the surface of meat (BTS and FOS) and the BTP, table 5. The levels of good classification are stable between 12 to 36 h pm: from 78 to 87 % of good classification in calibration and from 21 to 25 % of false classification rate in cross validation. This is confirmed in external validation by a 77% rate of good prediction in average. The false negatives/false positives ratio is moreover well-balanced. This probe should be interestingly tested on bone-in hams.
Table 6 Test for a use of a single equation (BTS probe, 24 h pm) on the spectrums recorded at others
pm times
Post mortem times 12 16 20 24 36
Good classification rate in external validation of the 24 h pm quotation (%)
84 78 86 84 82
tested
False negatives rate (%) 50 45,5 57,1 87,5 77,8 False positives rate (%) 50 54,5 42,9 12,5 22,2 As the PSE-like zone quotation of the 150 hams did not differ in average during the duration of the experiment (α=5 %, data not shown), an attempt for predicting PSE-like class of hams at all pm times has been made, table 6. The prediction model calculated with 24 h pm BTS spectrums showed good accuracy whatever the pm time was (from 78 to 86 % good prediction). Its false negatives/false positives ratios were favorable for the 12, 16 and 20 h pm times. This equation was therefore preferable to the equations calculated at each pm time.
IV. CONCLUSION
In this study we showed that previously tested PSE –like classification by VIS-NIRS [7] can produce good results at different pm times (from 12 to 36 h pm). A prediction model made with 24 h pm BTS surface spectrums was stable and kept good accuracy whatever the pm time was (from 78 to 86 % good prediction). The false negative/false positive ratios were favorable between 12 and 20 h pm.
FOP probe (specially designed to be inserted in meat) gave us a good level of performance (82,9% good prediction in external validation). This probe should be tested for bone-in hams PSE-like zone classification, as industrials need.
ACKNOWLEDGEMENTS
Authors thank the food industry competition cluster “Valorial” for its financial support.
REFERENCES
1. Franck M., Bénard G., Fernandez X., Barbry S., Durand P., Lagant H., Monin G., Legault C. (1999). Observations préliminaires sur le jambon déstructuré. Description du phénomène et étude de quelques facteurs de variation. Journées de la recherche porcine, 31: 331-338.
2. Minvielle, B. & Le Strat, P. (2001). Viandes déstructurées, situation dans cinq abattoirs de l’Ouest de la France : facteurs de risque et proposition d’un modèle, caractérisation colorimétrique, biochimique et histologique.
Journées de la Recherche Porcine en France, 33, 95-101.
3. Laville E., Sayd T., Santé-Lhoutellier V., Morzel M., Labas R., Franck M., Chambon C., Monin G. (2005) Characterisation of PSE zones in semimembranosus pig muscle. Meat Science 70: 167–172.
4. Vautier A., Le Lay A., Lhommeau T., Tiaho F. (2013). Second Harmonic Generation microscopy of PSE-like zones from pork semimembranosus. In proceedings 59th International Congress of Meat Science and Technology, 18-23rd august 2013,
Izmir, Turkey.
5. Prieto N., Roehe R., Lavin P., Batten G., Andrés S. (2009). Application of near infrared reflectance spectroscopy to predict meat and meat products quality: A review. Meat Science 83 : 175–186.
6. Ifip, (2005). Grille de notation du défaut “déstructuré » des muscles de la cuisse de porc.
7. Vautier A., Lhommeau T., Daumas G. (2013). « A feasibility study of the prediction of the technological quality of ham with NIR Spectroscopy ». In proceedings 64th annual meeting
of the European federation of animal science, EAAP, 26-30th august, 2013, Nantes, France.