HAL Id: hal-02169245
https://hal-mines-albi.archives-ouvertes.fr/hal-02169245
Submitted on 10 Jul 2019
HAL is a multi-disciplinary open access archive for the deposit and dissemination of sci-entific research documents, whether they are pub-lished or not. The documents may come from teaching and research institutions in France or abroad, or from public or private research centers.
L’archive ouverte pluridisciplinaire HAL, est destinée au dépôt et à la diffusion de documents scientifiques de niveau recherche, publiés ou non, émanant des établissements d’enseignement et de recherche français ou étrangers, des laboratoires publics ou privés.
Determination of drug-polymer solubility from
supersaturated spray-dried amorphous solid dispersions:
a case study with Efavirenz and Soluplus®
B.L.A. Costa, Martial Sauceau, Sylvie del Confetto, Romain Sescousse,
Maria-Inês Ré
To cite this version:
B.L.A. Costa, Martial Sauceau, Sylvie del Confetto, Romain Sescousse, Maria-Inês Ré. Determination of drug-polymer solubility from supersaturated spray-dried amorphous solid dispersions: a case study with Efavirenz and Soluplus®. European Journal of Pharmaceutics and Biopharmaceutics, Elsevier, 2019, 142, pp.300-306. �10.1016/j.ejpb.2019.06.028�. �hal-02169245�
Determination of drug-polymer solubility from supersaturated spray-dried
amorphous solid dispersions: A case study with Efavirenz and Soluplus®
B.L.A. Costa
⁎, M. Sauceau, S. Del Confetto, R. Sescousse, M.I. Ré
Université de Toulouse, Ecole des Mines d’Albi, UMR CNRS 5302, Centre RAPSODEE, F-81013 Albi, France
Keywords:
Amorphous solid dispersions Recrystallization method Spray drying Solubility Phase diagram Efavirenz Soluplus® A B S T R A C T
Amorphous solid dispersions (ASDs) are found to be a well-established strategy for overcoming limited aqueous solubility and poor oral bioavailability of active pharmaceutical ingredients (APIs). One of the main parameters affecting ASDs physical stability is the API solubility in the carrier, because this value determines the maximal API load without a risk of phase separation and recrystallization. Phase-diagrams can be experimentally obtained by following the recrystallization of the API from a supersaturated homogeneous API-polymer solid solution, commonly produced by processes as solvent casting or comilling, which are very time-consuming (hours). The work deals with the construction of a temperature-composition EFV-Soluplus® phase diagram, from a thermal study of recrystallization of a supersaturated solid solution (85 wt% in EFV) generated by spray drying. This supersaturated solution is kept at a given annealing temperature to reach the equilibrium state and the amount that still remains dispersed in the polymer carrier at this equilibrium temperature is determined by means of the new glass transition temperature of the binary mixture. From our knowledge, this is the first study employing a fast process (spray drying) to prepare a supersaturated solid solution of an API in a polymer aiming to determine a temperature-composition phase diagram. The EFV solubility in Soluplus ranges from 20 wt% at 25 °C to 30 wt % at 40 °C. It can be a very useful preformulation tool for researchers studying amorphous solid dispersions of Efavirenz in Soluplus, to assist for predicting the stability of EFV-Soluplus ASDs at different EFV loadings and under different thermal conditions.
1. Introduction
One of the biggest challenges facing the pharmaceutical world today is the poor aqueous solubility of many drugs. When a drug is ad-ministered orally, if the clinical dose of the drug cannot be dissolved in the available volume of gastrointestinal fluids, the drug will show a poor oral absorption, which leads to a weak bioavailability[1].
The crystalline form of a drug offers the advantage of high purity and physical or chemical stability. However, a large amount of external energy is required to break the drug crystal lattice in dissolution. The amorphous state, on the other hand, exhibits a disordered structure in comparison to the crystalline form and possesses higher free energy (thermodynamic driving force), which consequently is reflected by higher apparent water solubility, dissolution rate, and oral absorption. However, due to a lower thermodynamic stability, the main challenge of amorphous form is evidenced: stabilization against drug re-crystallization tendency both on in vivo dissolution and storage [2,3]. To retain the solubility advantage of the amorphous state, amorphous solid dispersions (ASDs) have been proposed as an effective strategy to
“kinetically stabilize” amorphous drugs[4]. ASDs refer to drug - carrier systems, where the drug is dispersed at a molecular level in the carrier, usually an amorphous polymer[5,6]. ASDs can be produced by several processes such as freeze-drying[7,8], hot-melt extrusion[9,10], rotary solvent evaporation [11]; ball milling [12]; cryo-milling [13]; super-cooling[14] and spray drying [6,15,16].
The choice of the carrier is a critical parameter for ASDs because it impacts several factors such as molecular mobility, preparation methods and the physical/chemical stability of the amorphous form. To stabilize an ASD thermodynamically, it is of great importance to dis-perse molecularly the drug in the carrier because, if the drug is mole-cularly dispersed in the carrier at concentrations below the drug solu-bility in the carrier at a fixed temperature, this system is, in theory, thermodynamically stable. Consequently, for the rational development of ASDs, it is essential to know the solubility of the drug in the carrier because this value determines the maximal drug load without a risk of phase separation and recrystallization[17,18].
However, measuring the API solubility in polymers is still a chal-lenge due to the high polymers viscosity that hampers the solubility ⁎Corresponding author.
E-mail address:bhianca.lins_de_azevedo_costa@mines-albi.fr (B.L.A. Costa).
equilibrium achievement (equilibrium between a crystalline solute and its solution), and makes difficult the experimental construction of so-lubility curves in a low time consuming[9]. For this reason, different methods have been developed to determine the solubility of APIs in polymeric carriers: estimation of the solubility of a API in a polymer from the solubility of the API in a low molecular weight liquid, che-mically analogue to the polymer [19]; methods based on thermal analysis such as the melting point depression method [20] and the dissolution end point method[21].
Theoretically, melting of a crystalline API occurs at the temperature (Tm) when the chemical potential of the crystalline API equals to the
chemical potential of the molten API. The melting point depression method explores the depressed melting point of the API in the presence of a miscible polymer[19]. Assuming that the amorphous API behaves as a solvent and thus by extending the equations presented by Flory-Huggins systems, it is possible to relate solubility of a API in an amorphous polymer to melting point depression of the API [22]. The onset of the melting endotherm is considered as the equilibrium solu-bility temperature of the given composition. The choice of the melting onset eliminates the impact on Tm of particle size and preparation
method of the physical mixtures. However, the onset only marks the beginning of the API dissolution in the polymer but does not provide information concerning the amount of API in the binary mixture that can be dissolved at that respective temperature [19]. Progressing the protocol for thermal analysis, the cryomilling of the physical mixtures was proposed in order to compensate the slow dissolution kinetics by reducing the size crystals prior to DSC experiments [5]. However, cryomilling is a longstanding process and have some limitations to control and to standardize particle characteristics such as size, mor-phology, shape and surface properties[23]. In contrast, the dissolution endpoint method enables the measurement of the endpoint of the dis-solution step and thus might be more accurate [24]. The end point value represents the melting point of the final composition, assuming complete mixing has occurred. The disadvantage of this method is its strong dependence on the particle size. If the particle size is not suffi-ciently small, the melt is not able to reach its equilibrium state during heating. This may result in a higher dissolution end point, leading to underestimation of the API-polymer solubility.
The mentioned methods follow the dissolution kinetics of APIs into polymers at under saturated concentration solutions. Another way to determine the API-polymer solubility is to reach faster the equilibrium solubility by following the recrystallization (recrystallization method) of the API from a supersaturated homogeneous API-polymer solid so-lution [13,19]. The demixing kinetics of APIs from supersaturated systems is expected to be much faster than the dissolution kinetics of APIs into under saturated systems. This difference arises directly from the molecular mobility in the polymer matrix, which is higher in su-persaturated API-polymer solutions than in under saturated ones.
The supersaturation of the API into the polymer can be obtained from a physical mixture of crystalline API and polymer carrier by dif-ferent techniques such as film casting method [19] and comilling [13,24] that forces the miscibility of the two compounds to reach su-persaturation. The supersaturated glass solution is then loaded in a DSC analyzer and annealed above itsTg during a sufficient time to complete
the demixing process: release the excess of API in the mixture and reach the equilibrium solution concentration at the annealing temperature.
We propose here to prepare supersaturated API-polymer solid lutions by spray drying as an alternative to determine API-carrier so-lubility from demixing, because it is a fast process (some seconds) compared to other ones commonly used as solvent casting or comilling, which are very time-consuming (hours)[25]. From our knowledge, this is the first study employing spray drying to prepare a supersaturated solid solution of an API in a polymer aiming to determine a tempera-ture-composition phase diagram by following the recrystallization of the API from a supersaturated homogeneous API-polymer solid solu-tion. The binary mixture case-control study is Efavirenz-Soluplus®. The
chosen API, Efavirenz (EFV), is classified as class II API according to the biopharmaceutical classification system (BCS) [26] with high perme-ability and poor-water solubility water (below 10 µg/mL) in its crys-talline form[27]. EFV is recommended by the World Health Organiza-tion [28] as a first-line anti-HIV API, largely used as a non-nucleoside reverse transcriptase inhibitor as part of antiretroviral therapies. However, it exhibits low oral bioavailability (40–45 %) [29,30]. Am-phiphilic polymers have gained much attention in recent studies to inhibit recrystallization in ASDs. Composed by a hydrophilic unit (contact with aqueous media) and a hydrophobic unit (contact with the API), Soluplus® (SOL) is an example of amphiphilic polymer[8]. 2. Experimental section
2.1. Materials
Efavirenz, EFV, ((S)-6-chloro-4-(cyclopropylethynyl)-1,4-dihydro-4-(trifluoromethyl)-2H-3,1-benzoxazin-2-one,Fig. 4) was kindly provided by Cristalia Ltd (Itapira, Brazil). Soluplus®, SOL, (polyvinyl capro-lactam-polyvynil acetate-polyethylene glycol graft copolymer/PCL-PVAc-PEG, Fig. 4) was provided by BASF corporation (Ludwigshafen, Germany). Ethanol used as organic solvent in the preparation of solid dispersions was purchased from Carlo ERBA Reagent (Italy). For the purpose of analysis, distilled and purified water (conductivity of 18.2 MΩ.cm at 23 °C) was obtained by the purification system Milli-Q (classic Purelab DI, MK2, E3lga, UK). Physicochemical characteristics of API and polymer are summarized inTable 1.
2.2. Supersaturated EFV ASD 2.2.1. Preparation
A supersaturated amorphous solid dispersion (SD) EFV: SOL was prepared by spray drying with a drug load proportion of 85:15 wt%.
A Buchi B-290 mini spray dryer (Buchi Labortechnik AG, Flawil, Switzerland) equipped with Inert Loop B-295 and an integrated two-fluid 0.7 mm nozzle was used to produce the ASD samples.
Solvent choice is an essential step in the spray dryer process, and it was based on high solubility of API and polymer, generation of a feed solution with acceptable viscosity, low toxicity and high volatility to be easily evaporated during the drying of the liquid droplets. Ethanol re-spects these specifications and was thus used as the common solvent. The feeding solution was prepared by dissolving EFV in a 10 % (w/w) solution of SOL in absolute ethanol 99 %.
Compressed nitrogen was used as the drying/carrying gas with a flow rate of 600 L/h. The solution feed rate was ranged from 50 to 117 kg/h, the inlet air temperature was set to 80 ± 2 °C and the re-sultant outlet temperature (59 ± 2 °C) was determined by the inlet temperature and relative factors such as air and liquid flow rates. Ethanol was continuously condensed in the process for further disposal. The dry powder was recovered in a cyclone.
2.2.2. Solid state characterization
2.2.2.1. Thermal analysis (DSC). Thermal analyses were performed by using a DSC Q200 with the base module and mDSC (TA instruments, USA). On this, it was used a RCS90 cooling system which explains that we can precisely control the cooling rate. Nitrogen was used as the purging gas at 50 mL/min, the analysis was made in non-hermetic
Table 1
Physico-chemical properties of products[31,32].
Molecular weight (g/mol) Melting point (°C) Density (g/cm3)*
Efavirenz 315.68 136–141 1.39 Soluplus® 90,000–140,000 – 1.18
aluminum pans, indium standards were used for enthalpy and temperature calibration and an empty aluminum pan was used as a blank. Concerning mDSC, sapphire was used to calibrate inCP. Samples
were heated with a rate of 2 °C/min. To obtain endothermic peaks and analyze the apparent API-polymer miscibility, samples were heated from 10 to 150 °C.
Moreover, experiments were also done on modulated-DSC to de-termine glass transition temperatures of SOL, EFV and their mixture. In these analyzes, the samples were heated at 2 °C/min from 10 to 150 °C, with a modulation period of 40 s and an amplitude of 0.2 °C.
2.2.2.2. Cristallinity studies (PXRD). Powder X-ray diffraction patterns were obtained by X’Pert Panalytical X-ray diffractometer (Philips, USA) using CuKα radiation, putting 40 mA of current and 45 kV of voltage. The recording spectral range was set at 7–50° with a measuring step (angular deviation between 2 consecutives points) of 0.0167° and an acquisition time of 100 s per point. In addition, the powder was rotated in its sample holder (1 s/revolution) during the acquisition of the results.
2.2.2.3. Fourier transform infrared spectroscopy (FTIR). FTIR investigations were realized on a Thermo Scientific Nicolet 5700 spectrometer. The samples were premixed with KBr using mortar and pestle at 10 % of the samples in KBr and the discs were produced by compressing the powders at a working pressure of 1 t. The scanning range was 4000–400 cm−1 with a 4 cm−1resolution.
2.2.2.4. Surface morphology studies (SEM). SEM images of pure SOL, pure EFV and solid dispersions were obtained using a scanning electron microscope Philips XL30 ESEM-FEG (Philips, USA) with acceleration voltage of 20 kV. Samples were fixed on a support using a double-sided adhesive and covered with platinum using a high-resolution SEM coated spray Polaron SC7640 (Quorom Technologies, England).
2.2.2.5. Raman mapping. Raman mapping was performed using a Raman confocal microscope 300AR Alpha-AFM (Witec, Germany), equipped with a laser at a wavelength of 532 nm and the analyses were conducted at room temperature. Samples were analyzed by a 50× objective with a lateral resolution of 432 nm and an axial resolution of 1320 nm. A surface (10 × 10μm) and deep mapping (12 × 10 μm) were used to predict drug and polymer distribution. Images obtained in 3D representing special distribution of the chemical species present in the sample.
2.2.3. API-polymer solubility determination by recrystallization
The supersaturated SD was loaded into the DSC analyzer and an-nealed at different temperatures below theTm (melting point) of the
API under investigation (EFV) for 2–28 h to recrystallize the excess of drug in the mixture and to reach equilibrium solubility. After annealing, the sample was cooled to 10 °C and ramped at a rate of 2 °C/min to determine theTg (glass transition temperature) of the annealed mate-rial.
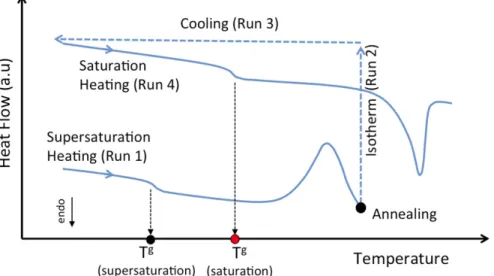
The recrystallization method is illustrated in Fig. 1 that presents a schema of DSC running. Run 1 (first heat cycle) represents a change in the solid state evidenced by an unique glass transition temperature of the binary mixture, followed by an exothermic phenomenon (re-crystallization). Run 2 (isotherm) aims to reach the equilibrium state for the sample at a given annealing temperature. In turn, Run 3 is the cooling step. Finishing the cycle, Run 4 (second heat cycle) gives the new glass transition temperature of the binary mixture, corresponding to the API amount that still remains dispersed in the polymer carrier at the equilibrium temperature, which corresponds to the melting tem-perature of this mixtureTMIXm .
Annealing temperature and annealing time are essentials para-meters and play an important role in the recrystallization method. At lower annealing temperatures, a longer time is required to reach the
equilibrium state. The reason is probably a slower demixing kinetics due to an insufficient molecular mobility, leading consequently to slower API diffusion in the polymer matrix [13]. Completing the DSC analysis, the new equilibrium dissolution concentration of the API re-maining dispersed in the polymer was calculated using the Gordon-Taylor equation [33,34].
2.3. Theoretical considerations
2.3.1. Prediction of the amorphous solid dispersion glass transition temperature (TMIXg )
Gordon-Taylor equation is used to estimate the theoretical glass transition temperature of the mixtureTMIXg . It is calculated based on the individual contributions of weight fraction and glass transition tem-perature of each component in the binary mixture, without considering the intermolecular interactions between them. Applying Gordon-Taylor equation, theTMIXg is described by Eq. (1).
= ++ −−
TMIXg W TPA.WPA KK. (1. (1 WW )).T g
PA POg
PA PA (1)
TPAg andTPOg are the API and polymer glass transition temperatures, respectively. WPA is the API mass fraction in the mixture. K can be defined as a parameter characterizing the intermolecular interactions between both components resulting in the curvature of the evolution and is defined by Eq. (2) [33]. A value of 1 for K means that the in-teractions between both components are similar to the ones of the pure components. = K T ρ T ρ . . PAg PA POg PO (2)
Densities of the drug and polymer, ρPA and, ρPO respectively, are defined inTable 1.
2.3.2. Solubility curve fitting
Flory-Huggins modeling was used to construct the solubility curve, which can estimate API solubility at a range of annealing temperatures (see Table 2). The calculated data (Eq. (3)) were compared to the
Fig. 1. Principle of DSC analysis for recrystallization method.
Table 2
Glass transition temperatures of solid dispersion and pure components de-termined by DSC and Gordon-Taylor equation.
WPA TMIXg (°C) ± 2 °C
Gordon Taylor equation DSC
0.00 – 79.9
0.40 62.8 62.2
0.70 49.6 47.1
0.85 47.2 36.7
experimental results obtained with the DSC protocol.
Binary interactions between polymer and API are commonly de-scribed by Flory-Huggins parameter (χ) obtained from the solubility curve. Immiscibility between the components is represented by a po-sitiveχ, while miscibility is indicated by a negative χ [13,35,36].
⎜ − = − ⎛ ⎝ ⎜ +⎛⎝ − ⎞⎠⎟ + ⎞ ⎠ ⎟ TMIXm1 T1PAm ∆HRPAm . lnνPA 1 1λ νPO χ ν. PO 2 (3)
TMIXm is the mixture melting temperature (in our case annealing
temperature at which equilibrium is measured),TPAm is the melting point
of the pure API,∆HPAm is the melting heat of the pure API, R is the ideal
gas constant, λ is the molar volume ratio of the polymer and the API, νPA and νPoare the volume fractions of the API and the polymer,
re-spectively. The volume fractionsνi can be calculated according Eq.(4):
= + − ν W W W i ρ ρPA 1 ρ PA i PA PO i (4) 3. Results and discussions
3.1. Supersaturated ASD characteristics
Solid states of samples were characterized by XRD analysis. The XRD patterns obtained for pure SOL, unprocessed EFV crystals and SD sample were depicted in Fig. 2. As expected, SOL is completely amor-phous in nature (absence of any peaks on its diffractogram). Un-processed EFV crystals exhibit principal sharp diffraction peaks at 2θ of 12.20°, 17.50°, 21.35° and 30.00° which represents characteristic peaks for crystalline nature of EFV in accordance to the literature [37]. SD sample did not show peaks of Bragg’s, which confirmed that it became amorphous during spray-drying process.
The Raman spectra of the individual components (SOL and EFV) and SD EFV were carried out to understand the drug distribution inside polymer matrix (Fig. 3). SOL spectrum showed characteristic peaks around 2987 cm−1 and 2900 cm−1 due to CeH stretching bands. For
EFV spectrum, characteristic peaks at a wavelength around 3100 cm−1
and 2250 cm−1 due to amine group NeH and CeC triple bond
re-spectively, were identified. SD Raman spectrum revealed all EFV and SOL vibrations bands in the binary mixture. Still in Fig. 3, 3D images represent a scan of the characteristic peak of each component in a SD sample region (10 µm × 10μm). It confirms the presence of SOL and EFV and their good distribution with however a better uniformity for SOL. In fact, the drug concentration in SD corresponds to a super-saturated state of EFV in SOL and this EFV excess might be distributed in amorphous clusters in the sample as suggested by EFV spot (yellow
area observed in 3D Raman imaging of EFV peak inFig. 3).
FTIR spectra for EFV, SOL and SD are exhibited inFig. 4. Pure SOL spectra shows distinctive peaks in accordance to the literature [38]: around 3675 cm−1 due to the hydrogen bonds O-H group, 2987 cm−1
and 2900 cm−1 due to CeH stretching bands, 1735 cm−1 and
1635 cm−1 corresponding to carbonyl bonds C]O group and
1406 cm−1 to CeOeC stretching vibrations. In turn, the characteristic
peaks previously reported for EFV [37] were also identified here: around 3320 cm−1, 1600 cm−1, 2250 cm−1, 1750 cm−1 and
1250 cm−1due to the amine group NeH, CeC triple bond, C]C bond
and CeF stretching vibrations, respectively. The spectral analysis of SD confirmed that the characteristic peaks for the pure components were present in the binary mixture, without modifications like shifts or dis-appearance of peaks that could suggest specific interactions between EFV and SOL components.
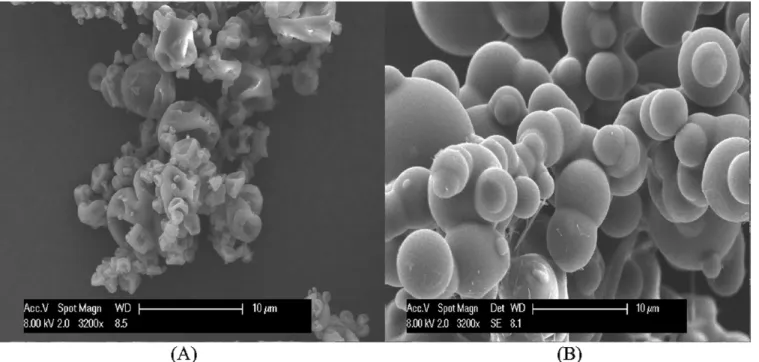
Microstructure morphologies of the spray-dried SOL and SD are represented inFig. 5. Spray-dried amorphous EFV were not observed by SEM because, during production, the dry powder remained adhered to the column wall due to the lowTg (T
PAg = 36.1 °C) of amorphous pure EFV. SOL spray-dried particles took a nearly spherical shape and had a wrinkled appearance (Fig. 5A). In comparison, the “wrinkled collapsed morphology” of SOL spray-dried particles was completely affected by the presence of EFV (Fig. 5B). Indeed, SD particles are mostly spherical with seemingly smooth surfaces without surface discontinuities, which suggests a good mixture between the two amorphous components. SD particles are constituted by some fused interconnected particles, which could be explained by a still lowTg since this sample contains a ma-jority of the API that has a very lowTg. Besides composition, the feed concentration plays an important role in defining spray-dried mor-phology [37]. Spray-dried SOL particles were generated from a feed concentration of about 10 % (w/w). In this case, the solid concentration is low and then, through the evaporation process, the droplet surface remained wet for a longer time creating hollow particles with a thin solid skin that could deflate resulting in a wrinkled morphology. With the API incorporation in the SOL solution, SD were generated from a feed concentration of about 43 % (w/w), what leads the droplets to dry faster, developing a dried hard surface and preventing subsequent de-flation and shrinkage.
3.1.1. API-polymer solubility determination by recrystallization
As proposed here, a supersaturated EFV-SOL solution with 85 wt% EFV (SD) was successfully prepared by spray drying. The glass transi-tion temperatures of SD sample and pure components were determined by DSC (Table 3). SD revealed a single and distinctive mixture glass transition temperature (TMIXg ) in the reversing heat flow signals, which indicates a single relaxation process, homogeneity and mixing at mo-lecular level between the components in the supersaturated EFV-SOL solution produced by spray-drying. DSC results are in good agreement with XRD, Raman microscopy and FTIR results already presented[39]. The experimental TMIXg is compared (Table 2) with the theoretical value calculated by the Gordon-Taylor equation previously detailed. The parameter K is determined from Eq.(2)with the data fromTable 2 and an apparent linear variation ofTg is achieved with a K close to 1
(1.03). The gap between experimental and theoretical (Gordon-Taylor)
Tg values increased with the increase of the EFV loading in the solid
dispersions. For the sample with 85 wt% of EFV, this difference is even more significant. This could be explained by the large amount of EFV in the sample, which is possibly responsible for disturbing the measure of
TMIXg due to the low value ofΔCP (0.16 J/g/K).
The high API load SD produced by spray drying was annealed from 90 °C until 130 °C to promote the recrystallization of excess EFV amount. The choice of this temperature range was based on the mole-cular mobility in the mixture, which became slower for the lowest temperature and for the melting point of pure API. For instance, the mDSC corresponding to 120 °C showed a mixture glass transition (TMIXg )
in Run 1 at 36.7 ± 3 °C followed by a recrystallization which starts at
about 90 °C and continues until 120 °C. In Run 2 (isotherm), the sample is heated during 2 h at 120 °C and then, it is cooled (Run 3). The step 2 is essential, because it favors the recrystallization of the remaining excess EFV in order to reach the equilibrium state.
Once reached the equilibrium state, the sample was rescanned (Run 4) in the same conditions as the first cycle. It is detected a higher second mixture glass transition (TMIXg = 51.2 ± 3 °C) by a decrease in ∆Cp
(0.32 J/g/K for Run 1 and 0.16 J/g/K for Run 4). This increase in the
TMIXg value and the smaller amplitude of∆Cpis expected to be due to the
reduction of amorphous API amount in the SD that recrystallized in comparison with the Run 1.
The new EFV composition can be determined from Gordon-Taylor equation. Table 3 regroups the saturated EFV concentrations at equi-librium obtained for all annealing temperatures.
In the case of lower temperature than 110 °C, 2 h wasn’t enough to reach the saturation equilibrium because of the slower kinetic of de-mixing. In that case, the time required to reach the saturation equili-brium had to be increased to 28 h.
Flory-Huggins model (Eq.(3)) was used to estimate theχ parameter by lowering of theTg mixture temperature. The Eq.(3)is expressed in a
linear form for whichχ is the slope of the obtained line (Fig. 6A). The full line represents the linear regression of the data obtained with the
Fig. 3. 3D images and spectra from Raman spectroscopy of EFV, SOL and SD.
least squares method and the dashed lines, in the same figure, re-presents the limit of the 95 % confidence interval (CI95%) for the slope.
The number of data used for the regression was decreased until all used data are in this confidence interval. Finally, theχ parameter of Flory-Huggins obtained is −1.165 with CI95%= [−1.70;−0.63]. A negative
χ parameter represents attractive API-polymer interaction [9].Fig. 6B presents the best fit of Flory-Huggins model with the corresponding limits ofχ confidence interval, as represented inFig. 6A. To refine these results, a polynomial fitting is also represented. The two fitting models are in good agreement between them for low temperatures and give the solubility curve of EFV in SOL. Thanks to these plots, it is possible to identify regions of kinetic and thermodynamic stability. For example, approximately 20 wt% (Flory-Huggins model) of EFV is soluble in SOL at room temperature (25 °C). It means that a thermodynamic stability should be achieved at room temperature for API loads lower than 20 wt %. In contrast, a high API load SD with 85 wt% of EFV might be phase separate and eventually recrystallize at 25 °C.
The lower temperature, the more difficult the determination of the solubility curve, since the time required to reach the saturation equi-librium is relevant due to slow kinectic of demixing. Although there is no thermodynamic stability, the sample was still stable from the kinetic point of view. As showed inTable 3, below 110 °C, the slow molecular mobility makes the demixing process slower and then, a longer time was required to reach the saturation equilibrium (28 h in our experi-ments).
This method can not be applied for the lowest temperature given by the crossing point between the solubility and Gordon-Taylor curves. In our case, the crossing point for the Flory-Huggins model is 63.4 °C, what means that, if the annealing is done under this temperature, it would result in an abrupt reduction of molecular mobility and consequently of the demixing process avoiding the reach of saturation equilibrium[13].
Fig. 5. SEM images of SOL (A) and SD (B). Table 3
Equilibrium saturated concentration of EFV in SOL at different temperatures (W )PA
Annealing temperature (°C) Annealing time (h) TMIXg during Run 4
(°C) WPA 90 28 55.0 0.58 100 28 54.9 0.58 110 2 52.2 0.64 120 2 51.2 0.66 125 2 47.1 0.75 130 2 45.9 0.78 137 – – 1.00
Fig. 6. (A) Estimation of Flory-Huggins parameterχ by linear regression (B) Phase diagram of EFV-SOL.
4. Conclusion
Spray drying is one of the main processes capable of being scaled-up into large manufacturing scale to produce ASDs but it could be de-monstrated in this work that this process also represent an interesting alternative to produce supersaturated solid solutions, from which API-polymer solubility is determined from demixing, because it is a fast process compared to other ones commonly used to produce super-saturated solid solutions as solvent casting or comilling.
A supersaturated solid solution containing high API load (85 wt% Efavirenz) in Soluplus® was generated by spray drying, in only few seconds, and then exposed to a recrystallization protocol. The phase diagram of Efavirenz (EFV)-Soluplus (SOL) obtained from this work can be used to predict the stability of EFV-SOL ASDs at different EFV loadings and under different thermal conditions. For example, samples are stressed under different temperature conditions from room to 40 °C in order to investigate physical stability. The EFV solubility in Soluplus ranges from 20 wt% (25 °C) to 30 wt% (40 °C). Amorphous solid dis-persions of EFV in Soluplus containing more than 30 wt% of EFV in mass are supersaturated and their stability should be monitored over storage from room to accelerated (40 °C) temperature conditions. Acknowledgements
The authors are grateful to Cristalia (Brazil) for providing Efavirenz and to V. Nallet, L. Haurie and C. Rolland from Rapsodee Center for respectively DRX, Raman and SEM analyses. Gala® platform/Rapsodee Center also provided technical facilities.
References
[1] H.Ç. Arca, L.I. Mosquera-Giraldo, D. Dahal, L.S. Taylor, K.J. Edgar, Multidrug, Anti-HIV amorphous solid dispersions: nature and mechanisms of impacts of drugs on each other’s solution concentrations, Mol. Pharm. 14 (11) (Nov. 2017) 3617–3627. [2] A. Singh, G. Van den Mooter, Spray drying formulation of amorphous solid
dis-persions, Adv. Drug Deliv. Rev. 100 (May 2016) 27–50.
[3] S. Baghel, H. Cathcart, N.J. O’Reilly, Polymeric amorphous solid dispersions: a review of amorphization, crystallization, stabilization, solid-state characterization, and aqueous solubilization of biopharmaceutical classification system class II drugs, J. Pharm. Sci. 105 (9) (Sep. 2016) 2527–2544.
[4] B.B. Patel, J.K. Patel, S. Chakraborty, D. Shukla, Revealing facts behind spray dried solid dispersion technology used for solubility enhancement, Saudi Pharm. J. 23 (4) (Sep. 2015) 352–365.
[5] Y. Sun, J. Tao, G.G.Z. Zhang, L. Yu, Solubilities of crystalline drugs in polymers: an improved analytical method and comparison of solubilities of indomethacin and nifedipine in PVP, PVP/VA, and PVAc, J. Pharm. Sci. 99 (9) (Sep. 2010) 4023–4031.
[6] K. Wlodarski, W. Sawicki, A. Kozyra, L. Tajber, Physical stability of solid dispersions with respect to thermodynamic solubility of tadalafil in PVP-VA, Eur. J. Pharm. Biopharm. Off. J. Arbeitsgemeinschaft Pharm. Verfahrenstechnik EV 96 (2015) 237–246.
[7] J. Ihli, A.N. Kulak, F.C. Meldrum, Freeze-drying yields stable and pure amorphous calcium carbonate (ACC), Chem. Commun. Camb. Engl. 49 (30) (Apr. 2013) 3134–3136.
[8] Y. Kojo, S. Matsunaga, H. Suzuki, H. Sato, Y. Seto, S. Onoue, Improved oral ab-sorption profile of itraconazole in hypochlorhydria by self-micellizing solid dis-persion approach, Eur. J. Pharm. Sci. Off. J. Eur. Fed. Pharm. Sci. 97 (Jan. 2017) 55–61.
[9] S.O. Kyeremateng, M. Pudlas, G.H. Woehrle, A fast and reliable empirical approach for estimating solubility of crystalline drugs in polymers for hot melt extrusion formulations, J. Pharm. Sci. 103 (9) (Sep. 2014) 2847–2858.
[10] J. Thiry, et al., Continuous production of itraconazole-based solid dispersions by hot melt extrusion: Preformulation, optimization and design space determination, Int. J. Pharm. 515 (1–2) (Dec. 2016) 114–124.
[11] T. Xie, L.S. Taylor, Dissolution performance of high drug loading celecoxib amor-phous solid dispersions formulated with polymer combinations, Pharm. Res. 33 (3) (Mar. 2016) 739–750.
[12] V. Caron, et al., Amorphous solid dispersions of sulfonamide/soluplus® and
sulfonamide/PVP prepared by ball milling, AAPS PharmSciTech 14 (1) (Mar. 2013) 464–474.
[13] A. Mahieu, J.-F. Willart, E. Dudognon, F. Danède, M. Descamps, A new protocol to determine the solubility of drugs into polymer matrixes, Mol. Pharm. 10 (2) (Feb. 2013) 560–566.
[14] K. Semjonov, et al., The formation and physical stability of two-phase solid dis-persion systems of indomethacin in supercooled molten mixtures with different matrix formers, Eur. J. Pharm. Sci. Off. J. Eur. Fed. Pharm. Sci. 97 (Jan. 2017) 237–246.
[15] J.N. Pawar, et al., Development of amorphous dispersions of artemether with hy-drophilic polymers via spray drying: physicochemical and in silico studies, Asian J. Pharm. Sci. 11 (3) (Jun. 2016) 385–395.
[16] R. Ghanavati, A. Taheri, A. Homayouni, Anomalous dissolution behavior of cel-ecoxib in PVP/Isomalt solid dispersions prepared using spray drier, Mater. Sci. Eng. C 72 (Mar. 2017) 501–511.
[17] S.B. Murdande, M.J. Pikal, R.M. Shanker, R.H. Bogner, Aqueous solubility of crystalline and amorphous drugs: Challenges in measurement, Pharm. Dev. Technol. 16 (3) (Jun. 2011) 187–200.
[18] N. Shah, H. Sandhu, D.S. Choi, H. Chokshi, A.W. Malick, Amorphous Solid Dispersions: Theory and Practice, Springer, 2014.
[19] M.M. Knopp, et al., Comparative study of different methods for the prediction of drug-polymer solubility, Mol. Pharm. 12 (9) (Sep. 2015) 3408–3419.
[20] P.J. Marsac, S.L. Shamblin, L.S. Taylor, Theoretical and practical approaches for prediction of drug-polymer miscibility and solubility, Pharm. Res. 23 (10) (Oct. 2006) 2417–2426.
[21] J. Tao, Y. Sun, G.G.Z. Zhang, L. Yu, Solubility of small-molecule crystals in poly-mers: d-Mannitol in PVP, Indomethacin in PVP/VA, and Nifedipine in PVP/VA, Pharm. Res. 26 (4) (Dec. 2008) 855–864.
[22] K. Lehmkemper, S.O. Kyeremateng, O. Heinzerling, M. Degenhardt, G. Sadowski, Long-term physical stability of PVP- and PVPVA-amorphous solid dispersions, Mol. Pharm. 14 (1) (Jan. 2017) 157–171.
[23] N. Kumar, K. Biswas, Cryomilling: an environment friendly approach of preparation large quantity ultra refined pure aluminium nanoparticles, J. Mater. Res. Technol. (2017).
[24] Z. Yang, K. Nollenberger, J. Albers, S. Qi, Molecular implications of drug-polymer solubility in understanding the destabilization of solid dispersions by milling, Mol. Pharm. 11 (7) (Jul. 2014) 2453–2465.
[25] A. Sosnik, K.P. Seremeta, Advantages and challenges of the spray-drying technology for the production of pure drug particles and drug-loaded polymeric carriers, Adv. Colloid Interface Sci. 223 (Sep. 2015) 40–54.
[26] R.N. Kamble, P.P. Mehta, A. Kumar, Efavirenz self-nano-emulsifying drug delivery system. in vitro and in vivo evaluation, AAPS PharmSciTech 17 (5) (Oct. 2016) 1240–1247.
[27] D.A. Chiappetta, C. Hocht, C. Taira, A. Sosnik, Efavirenz-loaded polymeric micelles for pediatric anti-HIV pharmacotherapy with significantly higher oral bioavail-ability, Nanomed 5 (1) (Dec. 2009) 11–23.
[28] ‘HIV/AIDS’, World Health Organization. [Online]. Available:http://www.who.int/ news-room/fact-sheets/detail/hiv-aids. (accessed: 29-May-2018).
[29] C.R.D. Hoffmeister, et al., Efavirenz dissolution enhancement III: Colloid milling, pharmacokinetics and electronic tongue evaluation, Eur. J. Pharm. Sci. Off. J. Eur. Fed. Pharm. Sci. 99 (Mar. 2017) 310–317.
[30] S.K. Sathigari, V.K. Radhakrishnan, V.A. Davis, D.L. Parsons, R.J. Babu,
Amorphous-state characterization of efavirenz—polymer hot-melt extrusion sys-tems for dissolution enhancement, J. Pharm. Sci. 101 (9) (Sep. 2012) 3456–3464. [31] ‘Efavirenz | C14H9ClF3NO2 - PubChem’. [Online]. Available:https://pubchem.
ncbi.nlm.nih.gov/compound/64139. (accessed: 08-Jun-2018).
[32] ‘Soluplus - For better solubility & bioavailability’. [Online]. Available:https:// pharmaceutical.basf.com/en/Drug-Formulation/Soluplus.html. (accessed: 08-Jun-2018).
[33] J.A. Baird, L.S. Taylor, Evaluation of amorphous solid dispersion properties using thermal analysis techniques, Adv. Drug Deliv. Rev. 64 (5) (Apr. 2012) 396–421. [34] R. Fule, P. Amin, Development and evaluation of lafutidine solid dispersion via hot
melt extrusion: investigating drug-polymer miscibility with advanced character-isation, Asian J. Pharm. Sci. 9 (2) (Apr. 2014) 92–106.
[35] F. Meng, V. Dave, H. Chauhan, Qualitative and quantitative methods to determine miscibility in amorphous drug-polymer systems, Eur. J. Pharm. Sci. Off. J. Eur. Fed. Pharm. Sci. 77 (Sep. 2015) 106–111.
[36] C. Donnelly, Y. Tian, C. Potter, D.S. Jones, G.P. Andrews, Probing the effects of experimental conditions on the character of drug-polymer phase diagrams con-structed using Flory-Huggins theory, Pharm. Res. 32 (1) (Jan. 2015) 167–179. [37] Z.M.M. Lavra, D. Pereira de Santana, M.I. Ré, Solubility and dissolution
perfor-mances of spray-dried solid dispersion of Efavirenz in Soluplus, Drug Dev. Ind. Pharm. 43 (1) (Jan. 2017) 42–54.
[38] Yidan Lan, Shaukat Ali, N. Langley, Characterization of Soluplus® by FTIR and Raman Spectroscopy, 2010.
[39] F. Qian, et al., Is a distinctive single Tg a reliable indicator for the homogeneity of amorphous solid dispersion? Int. J. Pharm. 395 (1–2) (Aug. 2010) 232–235.