HAL Id: hal-02072483
https://hal.archives-ouvertes.fr/hal-02072483
Submitted on 19 Mar 2019
HAL is a multi-disciplinary open access
archive for the deposit and dissemination of
sci-entific research documents, whether they are
pub-lished or not. The documents may come from
teaching and research institutions in France or
abroad, or from public or private research centers.
L’archive ouverte pluridisciplinaire HAL, est
destinée au dépôt et à la diffusion de documents
scientifiques de niveau recherche, publiés ou non,
émanant des établissements d’enseignement et de
recherche français ou étrangers, des laboratoires
publics ou privés.
Web Browsing Measurements: An Above-The-Fold
Browser-Based Technique
Antoine Saverimoutou, Bertrand Mathieu, Sandrine Vaton
To cite this version:
Antoine Saverimoutou, Bertrand Mathieu, Sandrine Vaton. Web Browsing Measurements: An
Above-The-Fold Browser-Based Technique. ICDCS 2018 : 38th International Conference on Distributed
Computing Systems, Jul 2018, Vienne, Austria. �10.1109/ICDCS.2018.00184�. �hal-02072483�
Web Browsing Measurements: An Above-The-Fold
Browser-Based Technique
Antoine Saverimoutou, Bertrand Mathieu
Orange Labs Lannion, France
Email: {antoine.saverimoutou,bertrand2.mathieu}@orange.com
Sandrine Vaton
Institut Mines Telecom Atlantique Brest, France
Email: [email protected]
Abstract—Web browsing is the most important Internet ser-vice, and offering the best performance to end-users is of prime importance. The World Wide Web Consortium (W3C) has brought along the Page Load Time (PLT) metric as a QoE (Quality of Experience) and QoS (Quality of Service) benchmarking indicator, which is nowadays the de facto web metric used by researchers, large service companies and web developers. Although alternative web metrics have been intro-duced to measure part of the loading process, the techniques used need additional computing power and timings are not offered in real-time. In order to provide real-time fined-grained timings during web browsing measurement campaigns, we present in this paper the TFVR (Time for Full Visual Rendering), a technique being browser-based to calculate the Above-The-Fold (ATF) offering the loading time of the visible portion at first glance of a web page. The TFVR exposes fine-grained timings such as networking and processing time for every downloaded resource. Based on a measurement campaign on top 10,000 Alexa websites, we have been able to better quantify and identify web page loading inefficiencies through a tool we have designed, namely, MORIS (Measuring and Observing Representative Information on webSites).
Keywords— Web metrics, Web browsing, Performance, QoE, QoS
I. INTRODUCTION
Web browsing needs to offer optimal experience during end-users’ web navigation process. The Web was originally meant to deliver static contents being mainly texts and images, but evolved drastically towards dynamic web pages, composed of various types of objects (images, scripts, audio, video, etc.) delivered by CDNs (Content Delivery Networks) by a plethora of web servers. Through time proxy-based networking architectures as well as new transport protocols, HTTP/2 [1] and QUIC (Quick UDP Internet Connections) [2] have been in-troduced in the whole process. In order to benchmark QoE and QoS, the W3C has brought along the PLT (Page Load Time). This de facto used web metric by researchers or industries has nevertherless started being put into question lately as it offers overall loading times during web browsing measurements and is inadequate to measure dynamic web pages, particularly when benchmarking QoE. In order to measure web pages’ loading, the ATF, SpeedIndex, RUM (Real User Monitoring) or Paint Timing API have been introduced, but there still exists inefficiencies either regarding the techniques used to calculate these metrics limiting real-time measurements or not
universely implemented by web browsers. In order to ease the calculation of these aforementioned techniques, we present in this paper an ATF-browser based metric, namely the TFVR (Time for Full Visual Rendering) which measures the needed time to load the visible portion of a web page, being browser and web page type (static or dynamic) independent, calculated in real-time by using the browser’s DOM (Document Object Model). Futhermore, through the browser’s exposed network-ing logs, the TFVR offers rich information regardnetwork-ing the DNS, request, response and processing time as an overall timing or in a unit-wise manner for each downloaded and processed resource in this time gap.
This paper is structured as follows: We first remind in sec-tion II the existing web metrics and related works meant to measure web page load timings. Then we present in section III the identified limits of these web metrics and in section IV we present how the TFVR works, its implementation and how is exposed the rich-information. In section V we expose the results obtained when using the TFVR to benchmark QoE and QoS and finally conclude in section VI.
II. BACKGROUND ANDRELATEDWORK
Every browser uses distinct processing algorithms and poli-cies to render web pages and standardization bodies such as the W3C or large services companies have brought along a set of web metrics to better qualify and quantify web browsing.
The PLT [3] is the time between the start of navigation until the load event (onLoad) kicks in, meaning, as defined, that the web page has been entirely loaded. The Performance Timeline [4] provides a unifying interface with Navigation Timing exposing timings regarding web page navigation and load events while the Resource Timing provides information regarding the collected resources such as the protocol used, initiator or networking information (which may be null if a distant server does not provide a Time-Allow-Origin HTTP header). The Paint Timing API [5] exposes the First Paint (FP) which is the moment when anything being different prior to the navigation process appears on the screen. The web measurement community and large services companies have brought along the ATF [6] exposing the needed time to respectively load the visible surface area of a web page at first glance without scrolling. The Speed Index exposes a score representing the visible surface area occupancy of
(a) Page Load Time (b) Visible portion of web page
Fig. 1: PLT vs Browser window sizes
a web page. The RUM (Real User Monitoring) uses the Resource Timing and browser’s DOM information to calculate the corresponding SpeedIndex.
Previous work on web browsing measurement is mostly dealt at investigating the performance of internet protocols on specific websites, trusting the PLT offered by the browser. Cook and al. [7] studied the impact of using different internet protocols with regards to network conditions (wifi, ADSL or mobile networks) and measured the perceived QoE. Megyesi and al. [8] compared the performance of internet protocols, with respect to web pages being different in size and number of objects. Other research work [9], [10], [11], [12], [13] compared the performance of internet protocols and their cor-responding adoption rate, looking into the resultant bandwidth and impact of adblockers or advertisements on end-users’ QoE. These studies do trust the PLT offered by the browser although websites have been changing their inner structure and only an overall loading time as a whole is offered. But additional studies did start to question the versatility and objectiveness of the PLT to measure end-user’s QoE [14], [15], [16] putting emphasis that what the user really sees should be measured in order to better benchmark QoE and QoS and thus demystify web page abandonment.
III. IDENTIFICATION OF ACTUAL WEB METRICS INEFFICIENCIES
Automated web measurement campaigns have been con-ducted over a 4 months period over the top 10,000 Alexa1 web-sites through a tool, that we have designed, namely MORIS which is a user-orientated measurement tool to better qualify and understand the perceived QoE and QoS. We present in this section the inefficiencies observed from 25 different web pages (each having an average number of 527 measurements)
1https://www.alexa.com/
which are static or dynamic, representative of the different types of websites belonging to different categories (e.g News, Recreation, Kids and Teens, Science, Sports, etc.).
A. The Page Load Time
While smartphones, tablets, laptops or desktop screens all come in different sizes, we have been measuring the PLT timings with respect to different screen sizes as per Fig. 1. The Fig. 1a shows the mean PLT of 10 websites over a set of browser window sizes. Fig. 1b on the other end shows that as per the end-user’s browser window size and corresponding web page overall surface area, the visible portion (visible surface area at first glance without scrolling) of the website itself increases proportionally. Unfortunately the PLT does not take into account this fact as the web metric is defined to measure the overall loading process. The PLT as measured is constant over time, except some fluctuations due to networking conditions. When trying to measure finely end-user’s QoE, the PLT does not evolve as much through the eyes of the end-user. B. The Above-the-Fold
Through our tool, we have been measuring the ATF, as proposed in the literature, i.e by performing a recording of the web browsing session in different video formats, extracted the screenshots and analyzed the changes in pixels, leading to the visible loading time. We have also implemented the process of ATF estimation by retrieving the screenshots automatically performed by the Google-Chrome browser (since chrome v.60 and exposed through chrome devtools [17]) to lift up the burden of making video recordings. An analysis of these two methods did bring some irregularities:
Processing time: To detect accurately the pixels change from screenshots, the higher the video quality illustrating the loading process, the more accurate the pixels’ comparison will be, which firstly requires external tools for video recording
(a) Dynamic youtube.com (b) Dynamic forgeofempires.com (c) Static w3schools.com
Fig. 2: ATF vs PLT
and secondly more computing requirements, resulting in an increased computing time of 12%. If the screenshots are directly extracted from the Google-Chrome browser, chrome devtools can not be simply accessed from the console and a chrome extension is needed to retrieve them which increases the computing time by 7%. In both cases, these extra process-ings impact the collected measurements and do not represent the native end-user environment.
ATF under and over estimation: The estimation process needs to firstly classify pixels as being static or dynamic ones in order to obtain the ATF cut-off [6], which may be subjective on the long run and dependent on the quality of the screenshots.
Types of web pages: Web pages on the other hand can be static or dynamic. Fig. 2 depicts the mean web page loading times through a Google-Chrome browser with window size 1920x1080, where Fig. 2c (namely w3schools.com) represents a static website mainly composed of texts and static images and Fig. 2a and 2b dynamic websites. We compared the ATF estimated timings obtained by comparing screenshots from video (frame rate 30 and libx264 codec) and screenshots retrieved from the chrome devtools which bring along close estimations. As per Fig. 2c, where all events are fired before the onLoad event, the ATF estimation represents in the case of using an adblocker 63% of the PLT and 76% of the overall web page is visible at first glance to the end-user. The Fig.2a (namely youtube.com) represents a dynamic web page where all events are fired before the onLoad event, composed of texts, images and scripts. When retrieving screenshots from chrome devtools, we simply take into consideration the onLoad event exposed by the browser but in the case of extracting screenshots from a video, 45 seconds of additional video was taken due to the presence of dynamic advertising fields. The Fig. 2b (namely forgeofempires.com) represents a dynamic web page where events are fired after the onLoad event, with a permanent web page visible portion of 100%. While the exposed browser-PLT is 700 ms, this timing only
exposes the time needed to download a main asynchronous javascript (identified through the browser’s HTTP Archive). C. The Real User Monitoring
The RUM main aim is to calculate the SpeedIndex but can also be used for the ATF estimation by making use of the browser-exposed DOM information. During our measurement campaign, we have also used the RUM and in the case where we had static websites or dynamic websites having all events fired before the onLoad event, the estimations only had an average difference of 10% compared to the classical ATF estimation technique. But the RUM uses the Resource Timing API (resources downloaded in the PLT gap time) to identify the list of resources to be looked into the DOM information and in the case that events are fired after the onLoad event, the estimation is totally innacurate. When performing web browsing measurements for ryanair.com, the RUM exposes an ATF estimation of 400 ms for the web page, not taking into account resources downloaded after the onLoad event and rendered in the visible portion of the web page.
IV. TFVR: TIME FORFULLVISUALRENDERING
We present in this section how our proposed technique yields more representative timings and its implementation details. To calculate the TFVR, our tool through Selenium [18] drives real on-market browsers where a simple javascript code is sent to the browser’s command line during a web browsing session. We first retrieve the FP timing, indicating the starting time of the visible rendering process. We then calculate in real-time on-the-fly the visible portion of the web page as per the end-user’s browser window size (innerWidth and innerHeight) versus the web page scrollable size (scrollWidth and scrollHeight) which represents the surface area where all objects are to be visually rendered. The entire list of resources downloaded during the navigation session for the web page is obtained from the browser’s networking logs
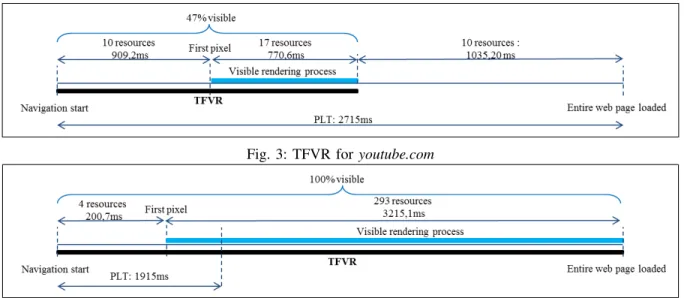
Fig. 3: TFVR for youtube.com
Fig. 4: TFVR for forgeofempires.com
through chrome.devtools.network.getHAR() for the Google-Chrome browser and extensions.netmonitor.har for the Mozilla-Firefox browser taking into consideration all events fired before and after the onLoad event (we purposely do not use the Resource Timing API which only exposes events loaded before the onLoad). The main web page code is then parsed to retrieve the needed resources on the webpage (since resources may also be downloaded for further navigation process being stored in the browser’s cache and unnecessary on the first instance [19]). We then retrieve the DOM browser-exposed information through getElementsByTagName("*"). By crossmatching the resources’ uri from the networking logs and web page code, we obtain a precise list of resources to be rendered by the browser for the entire web page.
Images Each object to be painted is referenced with its url name baseURI, width (innerWidth), height (innerHeight) and (x,y) coordinates through offsetTop and offsetWidth. The coordinates together with the object width and height brings along a rectangle which can be assessed if being in the visible surface area. We thus obtain through time the rendering times for each resource to be displayed in the visible portion of the browser window.
Texts and scripts These resources are not rendered visually, so we retrieve their processing time through the devtools Performance tab where each resource is referenced by its url name baseURI.
By adding this processing time information to exposed network logs offered by the browser, we obtain the neworking and processing time for all the resources needed to render the visible portion of the web page. The TFVR calculation process only represents a mean extra computational time of 0,156 seconds and processing time of 0,014%. The TFVR calculation is totally opaque to the end-user and has no incidence on the web browsing measurement process
since no external tool or storage capabilities is needed. Furthermore, the TFVR provides networking time as well as processing time for each resource thus improving QoE and QoS benchmarking and allows troubleshooting.
V. RESULTS
We expose in this section the results covering 47,291 measurements representing automated web browsing of 25 distinct websites through our tool MORIS in headless mode, where all cookies are deleted and cache emptied at the start of every measurement. These web browsing measurements have been conducted in Lannion (France) all day round, with or without adblocker (Adblock Plus v3.27), with different window sizes (360x640, 962x620, 1600x900 and 1920x1080), using HTTP/1.1, HTTP/2 or QUIC protocol, different network access (ADSL, Wifi and Fiber), collected by three different machines with Intel Core i5 and 8Go RAM. Our tool MORIS written in python is driven by chromedriver2 v2.37,
gecko-driver3 v0.19, Chrome v64, Firefox v58 and Selenium v3.4.
A. The TFVR
The Fig. 3 and 4 represent the web browsing loading times for youtube.com and forgeofempires.com made with the Google-Chrome browser, window size 962x901, using Ad-Block Plus, preferred internet protocol being QUIC (fallback to HTTP/1.1 or HTTP/2 is allowed if a distant host can not reply in QUIC) and fiber network access (96,7Mb/s down, 84,9Mb/s up).
Events before onLoad. As depicted in Fig. 3, the PLT covers all events triggered before the onLoad event, and the FP is 909,2 ms where 10 resources (1 html, 2 css, 1 xml and 6 images) are downloaded in this time interval. An end-user sees at first glance without scrolling the web page 47% of its contents which is visually rendered in 770,6 ms (17 resources
2https://sites.google.com/a/chromium.org/chromedriver/ 3https://github.com/mozilla/geckodriver
(a) TFVR (b) PLT
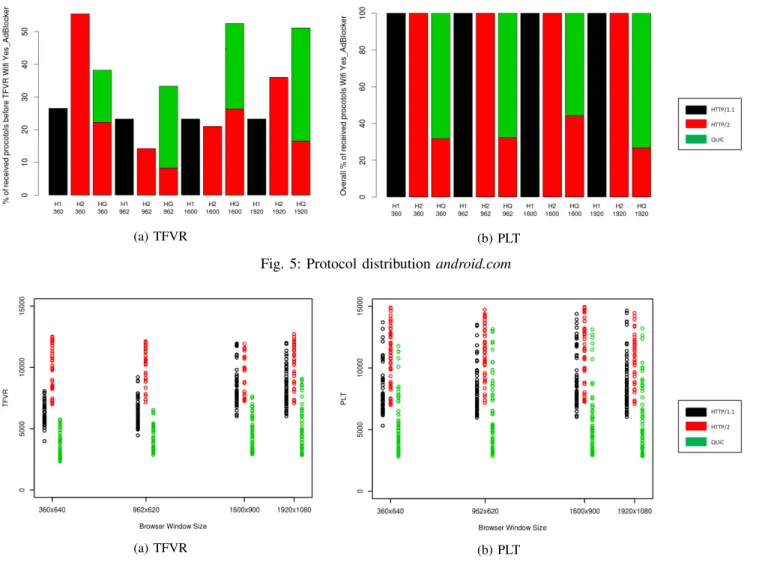
Fig. 5: Protocol distribution android.com
(a) TFVR (b) PLT
Fig. 6: Measurements facenama.com
downloaded in 416,5 ms namely 4 in HTTP/2 and 13 in QUIC and have a processing time of 354,1 ms). The overall TFVR time is 1679,8 ms which represents 61,9% of the PLT time. Events after onLoad. As depicted in Fig. 4, the PLT offered by the browser is not representative since the PLT is exposed as being 1915 ms, where 4 resources compose the FP of 200,7 ms (1 html, 1 css, 1 xml and 1 javascript). The javascript downloads 3 more resources in the FP-PLT lapse of time (1 image and 2 asynchronous javascripts) and these asynchronous javascripts are fired after the onLoad event. By comparing the network logs from devtools, we easily identify that more resources are needed by the browser so that visible portion of the website is rendered. In this case, the PLT is 43,9% short and does not take into consideration the additional download of 290 resources (networking time of 938,6 ms and processing time of 562,2 ms) needed to fully render the visible portion of the website. Through our measurements, we could easily identify other websites (e.g adidas.co.uk, ryanair.com, blog.me, etc.) where the PLT timing is inacurate and where the TFVR provides representative timings.
B. Internet protocols distribution
When performing web browsing measurements, it is impor-tant to take into account the internet protocols being used since some large service companies firewalls or network operators do block some internet protocols (e.g QUIC on UDP). We have thus conducted experiments based on HTTP/1.1 (deactivating HTTP/2 and QUIC), HTTP/2 (deactiving QUIC) and QUIC, by allowing a fallback to a subsequent internet protocol if a distant content server can not dialogue in a specific protocol (e.g activating QUIC allows a fallback to HTTP/2 and HTTP/1.1). Fig. 5 shows the internet protocols through which the resources are downloaded on Google-Chrome when calculating the TFVR and PLT for the website android.com with a wifi network access (15,7Mb/s down, 1.1Mb/s up). The Fig.5a shows the internet protocols through which the resources are delivered during the TFVR time lapse and further helps to understand the obtained timings when multiplexing, pipelining of the resources or delivery through TCP or UDP happen. The Fig. 5b shows as a whole the resources delivery through specific internet protocol during the PLT lapse of time. We have also been able to identify through the TFVR timings
that following the end-user’s network access (namely fiber access), extra resources can be downloaded by the browser, stored in the cache for further web browsing on the same domain.
C. Impact of internet protocols on QoE
When measuring the QoE of end-users, it is important to be able to detect bottlenecks during web page loading. As depicted in Fig. 6 the preferred internet protocol has an impact on the end-user’s QoE. This measurement has been performed on the website facenama.com with an ADSL network access (20,1Mb/s down,2,7Mb/s up), involving 529 distinct measure-ments (after removing the 5th and 95th percentile). When
taking the average TFVR (Fig. 6a) into consideration, the offered timing is 2252,4 ms (when preferred protocol QUIC, 1% H1, 2% H2 and 47% HQ for the 35 downloaded resources) and the mean PLT (Fig. 6b) is 8264,6 ms (when preffered protocol is QUIC, 10% H1, 4.29% H2 and 85,71% HQ for the 70 downloaded resources) with window size 1600x900. The contents are delivered over 5 different content servers (with same authoritative servers) located in Asia, and allows QUIC to perform better due to a 1-RTT (First requests are always performed in HTTP/2). Thanks to the TFVR, offering networking and processing timings for each resource, we can easily identify the bottleneck in this case which is two resources (advertisements) delivered over HTTP/1.1 with a DNS and response time of 1200 ms and processing time of 120 ms, thus having a mean FP of 1800 ms.
D. Browsers
When performing measurements on the Google-Chrome browser, at the launch of the browser itself, mandatory re-sources needed by Google services are downloaded before the navigation start. When performing our measurements on the website google.com or youtube.com we could identify from browser’s networking logs that an average number of 5 resources were loaded from the browser’s cache. The TFVR helps to identify these situations where a comparison between the number of resources needed to render a web page might be totally different when using different web browsers. This behavior has also been identified with Mozilla-Firefox when accessing Mozilla services, which confirm that each browser has a different policy when delivering contents to end-users. In order to be representative in our exposed timings, these resources downloaded by the browser before the navigation start are also exposed as having a processing time but no networking time.
VI. CONCLUSION
In this paper, we have highlighed the importance of mea-suring web browsing sessions as per what an end-user sees at first glance on a web page without scrolling. We have also presented a measurement technique which is browser-based, offering timings in real-time as per real on-market browsers, and take advantage of the rich-information exposed by the browser itself. The TFVR as opposed to actual ATF
measurement techniques offers representative timings as a whole regarding the visible web page loading process but also exposes fine-grained information regarding the networking and processing times of every downloaded resource. The TFVR also helps in identifying any bottleneck during the loading process as we also expose network timings. Our future work will be dealt in making the TFVR calculation available through a plugin for Chrome and Firefox browser and we will be performing additional web browsing measurement campaigns at different geographic locations to better investigate end-users’ QoE and QoS.
ACKNOWLEDGEMENT
This work is partially funded by the French ANR BottleNet project, No ANR-15-CE25-0013-001.
REFERENCES
[1] M. Belshe, R. Peon, and M. Thomson, “Hypertext Transfer Protocol Version 2 (HTTP/2),” RFC Editor, RFC 7540, May 2015.
[2] J. Iyengar and M. Thomson, “QUIC: A UDP-Based Multiplexed and Secure Transport,” Internet Engineering Task Force, Internet-Draft draft-ietf-quic-transport-10, Mar. 2018.
[3] Z. Wang, “Navigation Timing,” W3C, Tech. Rep., 2012.
[4] Z. W. Ilya Grigorik, Jatinder Mann, “Performance Timeline,” W3C Recommendation, Tech. Rep., Dec. 2016.
[5] S. Panicker, “Paint Timing,” W3C Working Draft, Tech. Rep., 2017. [6] J. Brutlag and Al. (2011, March) Above the Fold Time: Measuring Web
Page Performance Visually.
[7] S. Cook, B. Mathieu, P. Truong, and I. Hamchaoui, “QUIC: Better For What And For Whom?” in Proceedings of IEEE International Conference on Communications (ICC), May 2017.
[8] P. Megyesi, Z. Kramer, and S. Molnar, “How Quick is QUIC?” in Proceedings of IEEE International Conference on Communications (ICC), May 2016.
[9] P. Biswal and O. Gnawali, “Does quic make the web faster?” in 2016 IEEE Global Communications Conference (GLOBECOM), Dec 2016. [10] A. Sackl, P. Casas, R. Schatz, L. Janowski, and R. Irmer, “Quantifying
the impact of network bandwidth fluctuations and outages on web qoe,” in Seventh International Workshop on Quality of Multimedia Experience, QoMEX 2015, Pilos, Messinia, Greece, May 26-29, 2015.
[11] R. Shade and M. Warres, “HTTP/2 Semantics Using The QUIC Trans-port Protocol,” IETF Draft, IETF, Draft, July 2016.
[12] T. Zimmermann, J. R¨uth, B. Wolters, and O. Hohlfeld, “How HTTP/2 pushes the web: An empirical study of HTTP/2 server push,” in 2017 IFIP Networking Conference, IFIP Networking 2017 and Workshops, Stockholm, Sweden, June 12-16, 2017, 2017, pp. 1–9.
[13] M. Varvello, K. Schomp, D. Naylor, J. Blackburn, A. Finamore, and K. Papagiannaki, “Is the web http/2 yet?” in Passive and Active Measurement, T. Karagiannis and X. Dimitropoulos, Eds., 2016. [14] E. Bocchi, L. D. Cicco, and D. Rossi, “Measuring the quality of
experience of web users,” Computer Communication Review, 2016. [15] C. Kelton, J. Ryoo, A. Balasubramanian, and S. R. Das, “Improving user
perceived page load times using gaze,” in 14th USENIX Symposium on Networked Systems Design and Implementation, NSDI 2017, Boston, MA, USA, March 27-29, 2017, 2017, pp. 545–559.
[16] M. Varvello, J. Blackburn, D. Naylor, and K. Papagiannaki, “Eyeorg: A platform for crowdsourcing web quality of experience measurements,” in Proceedings of the 12th International on Conference on Emerging Networking EXperiments and Technologies, ser. CoNEXT ’16. New York, NY, USA: ACM, 2016, pp. 399–412.
[17] Chrome Devtools. [Online]. Available: https://developer.chrome.com/ devtools
[18] Selenium Web Browser Automation. [Online]. Available: https: //www.seleniumhq.org
[19] X. S. Wang, A. Balasubramanian, A. Krishnamurthy, and D. Wetherall, “Demystifying page load performance with wprof,” in Proceedings of the 10th USENIX Symposium on Networked Systems Design and Implementation, NSDI 2013, Lombard, IL, USA, April 2-5, 2013, pp. 473–485.