HAL Id: hal-00935378
https://hal.archives-ouvertes.fr/hal-00935378
Submitted on 31 Jan 2014
HAL is a multi-disciplinary open access
archive for the deposit and dissemination of
sci-entific research documents, whether they are
pub-lished or not. The documents may come from
teaching and research institutions in France or
abroad, or from public or private research centers.
L’archive ouverte pluridisciplinaire HAL, est
destinée au dépôt et à la diffusion de documents
scientifiques de niveau recherche, publiés ou non,
émanant des établissements d’enseignement et de
recherche français ou étrangers, des laboratoires
publics ou privés.
Formal Concept Analysis and Knowledge Integration for
Highlighting Statistically Enriched Functions from
Microarrays Data
Sidahmed Benabderrahmane
To cite this version:
Sidahmed Benabderrahmane. Formal Concept Analysis and Knowledge Integration for Highlighting
Statistically Enriched Functions from Microarrays Data. International Work-Conference on
Bioin-formatics and Biomedical Engineering, IWBBIO 2014, Granada, Spain„ Apr 2014, Granada, Spain.
pp.1. �hal-00935378�
Integration for Highlighting Statistically
Enriched Functions from Microarrays Data.
Sidahmed Benabderrahmane
INRIA Bretagne, Campus de Beaulieu. 263 Av Gl Leclerc 35042 Rennes, France. [email protected]
Abstract. In this paper we introduce a new method for extracting en-riched biological functions from transcriptomic databases using an in-tegrative bi-classification approach. The initial gene datasets are firstly represented as a formal context (objects × attributes), where objects are genes, and attributes are their expression profiles and complemen-tary informations of different knowledge bases. After that, Formal Con-cept Analysis (FCA) is applied for extracting formal conCon-cepts regrouping genes having similar transcriptomic profiles and functional behaviors. An enrichment analysis is then performed in order to identify the pertinent formal concepts from the generated Galois lattice, and to extract biolog-ical functions that could participate in the proliferation of cancers.
1
Introduction
Since the two last decades, high throughput technologies have been developed and are producing large volume of transcriptomic data [1]. By consequence, huge databases are constructed offering the ability of manipulating and analyz-ing expression level of thousands of genes in different biological situations. Such analysis aims for instance to identify differentially expressed genes in the consid-ered situations, or genes that are responsible to some diseases. In the literature, a panoply of datamining applications on transcriptomic data have been proposed. For example, authors in [2], [3], [4], [5], [6] investigated genes clustering meth-ods, where the goal is to regroup genes having similar expression level in distinct classes called expression profiles. Additional knowledge can be included in order to interpret the content of such clustering and to extract enriched biological an-notation terms [7, 8]. This integrated knowledge can be illustrated for example by ontology annotation terms (eg. Gene Ontology) [9, 10]. The bottlenecks in such approaches concern the utilization of heuristics during the affectation of genes in the different profiles. Moreover, there are not explicit works that involve the use of large knowledge bases for interpreting the transcriptomic analysis results except Gene Ontology (GO) terms [11].
In this paper, we introduce a symbolic data mining approach [12] based on Formal Concept Analysis (FCA) [13] that involves bi-classification of genes, for the goal of knowledge discovery and knowledge integration for interpreting
the transcriptomic analysis. FCA represents data as binary table (Object × at-tributes) called formal context, and extracts bi-clusters of objects sharing similar attributes called formal concept. In our case, objects are list of expressed genes of interest, whereas attributes are their expression profiles in different biological situations, plus additional knowledge like GO terms that they annotate, the list of Pathways they are involved in, and their genetic interactors. By consequence, our objective is to show how FCA can help biologists during the transcriptomic data analysis to extract bi-clusters of genes having similar expression profiles, and sharing similar GO terms, Pathways and interactors.
This paper is organized as follows: next section introduces the FCA method needed to elaborate our bi-classification framework. Section 3 presents the data preparation steps. Section 4 explains the proposed method for FCA-based clas-sification of genes. Section 5 illustrates the results obtained with the enrichment analysis of the formal concepts. Finally, section 6 concludes the paper.
2
Formal Concept Analysis
Formal concept analysis (FCA) is a conceptual classification method for knowl-edge discovery from data, that are represented as binary table of Objects × Attributes, representing the relationships that possibly link an object with a list of attributes [13]. This binary table is commonly called formal context.
More formally, let K be a formal context K =(G, M, I) where G is a set of ob-jects, M a set of attributes of properties and I a binary relation defined in G × M . Two fundamental properties are highlighted:
1. Let associate to a set A ⊆ G the set A0 of attributes shared by objects of A: A0= {m ∈ M |∀g ∈ A, (g, m) ∈ I}. Let Ξ(A) = A0.
2. Dually, let us associate to a set B ⊆ M the set B0 of objects sharing at-tributes of B : B0= {g ∈ G|∀m ∈ B(g, m) ∈ I}. Let Ψ (B0) = B.
A formal concept c of the the context K is a pair (A, B) with A ⊆ G, B ⊆ M , such as A0 = B et B0 = A. B is the set of attributes of the concept: it is the intension of the concept. A is the set of objects sharing attributes A: it is the extension of the concept.
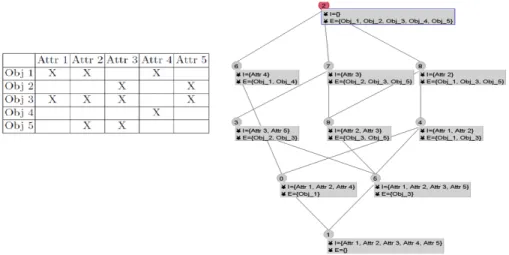
Let C1 = (A1, B1) and C2 = (A2, B2) two concepts. (A1, B1) ≤ (A2, B2) and if and only if A1 ⊆ A2 (by the same manner B2 ⊆ B1). The set of all concepts of a formal context associated to pre-order relation define a Galois Lattice L. Figure 1 gives an example of a formal context of 5 objects described by 5 attributes. The right panel of the figure illustrates in a hierarchical way the lattice gen-erated from the context using Galicia API1. This lattice contains 10 concepts, where each one contains a list of objects in its extension (E) with their common attributes in the intension (I). The top concept (id 2) in the lattice contains in its extension all objects and has an empty intension since the 5 objects taken together do not share any attributes (see the table of the context). Inversely, the
1
bottom concept (id 1) has an empty extension and an intension containing all attributes since there is no object having at the same time all these attributes. From bottom to top, we can observe that while the size of the intension de-creases, the size of the extension increase. It means that the concepts present in high level of the lattice are important. For instance, let us analyze concepts 0 and 5. Regarding concept 0, Iconcept0= {att1, att2, att4} whereas Econcept0= {obj1}.
For concept 5, Iconcept5= {att1, att2, att3, att5} whereas Econcept5= {obj3}. We
can observe that the objects of these two concepts share two attributes, i.e., with Econcept0∪Econcept5= {Obj1, Obj3} we obtain Iconcept0∩Iconcept5= {Att1, Att2}.
They represent the extension and the intension of the concept 4, due to pre order relation. These example shows how FCA can be used for a bi-classification ap-proach from the initial formal context, improved with good visualization through the lattice.
Indeed, FCA has been used to classify gene expression data regarding the simi-larity of the expression levels in divers biological situations. A produced formal concept is then a bi-cluster of genes with similar expression values [14]. The problem in this method is the necessity to scale numerical values of expression levels to binary attributes. Moreover, there is no knowledge that is combined with this FCA-based bi-classification for enhancing the analysis.
In our work, we want to go beyond this representation since we will consider in the extensions, experimental transriptomic data (genes), and in the intentions the attributes of these genes chosen from diverse knowledge bases. Thus, we hope obtaining a powerful representation with important formal concepts regrouping genes that share similar profiles, biological functions, metabolic networks and in-teractors. The efficiency of such symbolic and integrative datamining approach resides essentially of the large scale knowledge bases used during the analysis.
In the following subsections, we will explain how to exploit FCA to setup our
framework for highlighting enriched biological functions relative to genes sharing similar expression profiles.
3
Material and Methods
3.1 Overview
As reported above, our main objective is to propose a framework based on FCA for extracting enriched bi-clusters. Such groups contain genes having similar expression profiles, and share similar biological functions (GO terms), similar pathways, and interactors. We define our formal context K, where the objects G are a list of colorectal cancer genes gi∈G, and the attributes M are
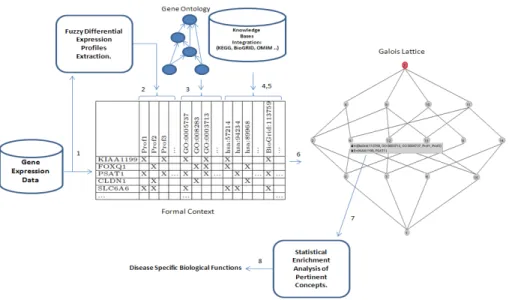
expres-sion profiles, GO terms, pathways and interactors. An overview of our proposed framework, using an FCA-based classification and knowledge integration is il-lustrated in figure 2. There are globally 3 global parts dispatched on 8 steps: Elaboration of the formal context, construction of the lattice, Enrichment anal-ysis. In the following subsections, we respect this order for defining the objects and the attributes. After that we construct our final context in order to generate the final Galois lattice.
Fig. 2. An overview of the proposed framework, using an FCA-based classification and knowledge integration.
3.2 Presentation of the dataset
This section describes the step 1 in figure 2. In our proposed framework, we used and selected a list (L) of 222 differentially expressed genes of colorectal
cancers. Consequently, this list represents 222 objects G in our formal context . An Affymetrix HGU133+ microarray was used for experiments. In this dataset, we dispose of three biological situations in the gene expression matrix (M ) that correspond to three biological samples: (i) healthy tissue (normal); (ii): tumor tissue (cancer); (iii) cell line. Let these situations be: S1, S2, S3 respectively. Each situation represents the average of multiple replicates and multiple speci-mens in each type of tissue during experiences. The dataset is described in [15, 16]. An example of the expression data in the matrix M is illustrated in Table 1. The expression value for a given gene g from a set of genes G in a situation Si is given by νsi. The selected 222 genes represent a significant fold change
ob-served between S2 and S1. Thus biologists are interested by genes for which the expression varies between these two situations, i.e., found deregulated in cancer tissues.
Gene Healthy : S1 Cancer: S2 Cell line: S3
KIAA1199 33,6 827,87 735,75 FOXQ1 65,36 1240,21 2631,71 PSAT1 89,03 1019,0 3025,66 CLDN1 12,15 119,9 78,5 SLC6A6 56,6 551,1 568,6 .... ... ... ... Gene g νs1 νs2 νs3 .... ... ... ... PSAT1 113,1 407,1 1258,0
Table 1. Example of the expression matrix M of the 222 genes relative to colorectal cancer, used in this study. This matrix is used for extracting gene expression profiles.
3.3 Fuzzy Expression Profiles Extraction
This section describes the step 2 in figure 2. We used our new proposed ap-proach defined in [15] to extract the fuzzy differential genes expression profiles (FD-GEP), from the previous list of cancer genes. This method consists of af-fecting genes that are differentially expressed, in a pair of situations using fuzzy logic. Regarding the difference of expression level of a given gene in the pair of situations (Si, Sj), the gene can be affected either in the fuzzy set of genes
over-expressed in Si with respect to Sj (which we denote Overi,j), or in the
fuzzy set of genes under-expressed in Si compared to Sj (which we denote
Un-deri,j), or rather in set of genes with similar expression in Si w.r.t. Sj (which
we denote Isoi,j). With such fuzzy affectation, we inhibit the artifacts and noises
encountered during clinical preparations and the statistical filtering, and allow to a gene to be present in multiple profiles at the same time. This can be argued by the fact that a gene can participate to more than a biological process, thus using a crisp classification would be disadvantageous.
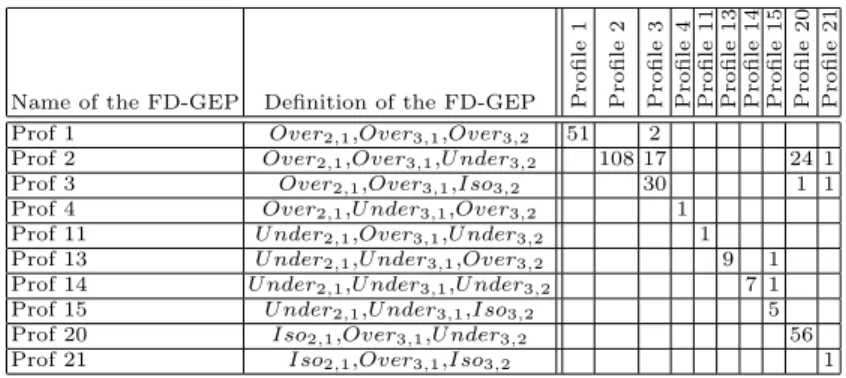
With 222 genes and 3 biological situations, we obtained 10 possible fuzzy over-lapping profiles (FD-GEP), presented in Table 2. They represent actually the first part of the attributes of the formal context. The number of genes in each profile is displayed in the diagonal of the matrix, while overlaps (due to fuzzy
classification) are observed between some profiles in terms of number of shared genes are displayed in the rest of cells of the matrix.
Name of the FD-GEP Definition of the FD-GEP Profile
1 Profile 2 Profile 3 Profile 4 Profile 11 Profile 13 Profile 14 Profile 15 Profile 20 Profile 21
Prof 1 Over2,1,Over3,1,Over3,2 51 2
Prof 2 Over2,1,Over3,1,U nder3,2 108 17 24 1
Prof 3 Over2,1,Over3,1,Iso3,2 30 1 1
Prof 4 Over2,1,U nder3,1,Over3,2 1
Prof 11 U nder2,1,Over3,1,U nder3,2 1
Prof 13 U nder2,1,U nder3,1,Over3,2 9 1
Prof 14 U nder2,1,U nder3,1,U nder3,2 7 1
Prof 15 U nder2,1,U nder3,1,Iso3,2 5
Prof 20 Iso2,1,Over3,1,U nder3,2 56
Prof 21 Iso2,1,Over3,1,Iso3,2 1
Table 2. Distribution of genes in the obtained expression profiles. Note that if a cell is empty then the two corresponding FD-GEP profiles do not share any gene. The diagonal represents the number of genes in each FD-GEP.
3.4 Knowledge Base Integration
Ontology annotations: This section describes the step 3 in figure 2. For com-pleting the formal context L with the rest of the attributes, we performed an integration approach to include additional knowledge during our analysis. Firstly, we selected for each gene in G, the list of its Gene Ontology (GO) terms2. By
convention, GO gives for each gene the description of its biological processes, molecular functions and cellular components, using concepts described in the graph of the ontology. Genes of different species can be annotated by one or more concepts (annotation terms). Each concept of the ontology is identified by a unique label. For example, GO:0003680 defines AT DNA binding and it annotates 86 gene products. We used Amigo3 tool to retrieve annotation terms for genes in G. For instance, the gene product F OXQ1 (Forkhead box protein Q1) has 13 term associations (6 Biological Processes, 2 Cellular Components, and 5 Molecular Functions).
Metabolic Pathways Preparation: This section describes the step 4 in figure 2. Gene Ontology is an important source of knowledge that was used for analyz-ing and interpretanalyz-ing transcriptomic data experiences [3, 17]. Recently, we pro-posed an hybrid functional analysis method combining both fuzzy clustering and ontology functions [15, 8, 11, 10], using our IntelliGO semantic similarity measure defined on GO [9]. In order to go beyond the past results, we want to enhance
2
www.geneontology.org
3
our contribution by integrating more sources of knowledge. For this reason and in a second stage of the preparation of the formal context L, we included KEGG pathways that refer the analyzed cancer genes. KEGG is a database resource for understanding high-level functions and utilities of the biological system, such as the cell, the organism and the ecosystem, from molecular-level information, especially large-scale molecular datasets generated by genome sequencing and other high-throughput experimental technologies [18]. Each metabolic pathway is consisting of a series of biochemical reactions that are connected. A network of pathways can participate harmoniously to catalyze or regulate complex reac-tions. They are very important for studying and modeling metabolism. Hence, it is so important to take into account and integrate by a relational manner, such knowledge for facilitating the interpretation of the data mining results, since some genes participate in complex biological processes which can be summa-rized by pathways.
We used DBGET4 integrated database retrieval system to extract for a given
gene, the list of KEGG pathways where it is involved. For instance, gene product SECT M 1 (Sectered and Transmambrane 1) NCBI Gene ID:6398 is involved in 3 metabolic pathways: hsa:63992, hsa:6398 and hsa:100616398.
Genes Interactors: This section describes the step 5 in figure 2. The last cat-egory of attributes of the formal context L concerns the interactors of each gene in G. Indeed, we hope that the identification of gene to gene interactions can be useful since such links can be significant factors in the search for disease sus-ceptibility genes. The important point is to have a global overview of gene-gene interactions and why they are likely to be common. In addition the detection of associations between genes, will allow to elucidate the biological and biochemical pathways that underpin diseases [19]. For identifying the interactors of the genes utilized in this work, we used the BioGRID online interaction repository5that
gives for a gene of a specified species the list of its interactors. For example, the same gene SECT M 1, has 3 unique interactors: U BC (Polyubiquitin-C), N RF 1 (Alpha palindromic binding protein) and CD7 (T-cell surface antigen Leu-9).
4
Lattice-based Integrative Bi-Classification of Genes
This section describes the step 6 in figure 2. Our final formal context (K) is con-structed using 222 genes (G=222 objects), and a total 2370 attributes (M =2370). The binary relation I reflects in our case either if a given gene belongs or not to a given fuzzy profile, or it is annotated or not by a given GO term ∈M , it is involved or not in a metabolic pathway ∈M , or if it interacts or not with an interactor ∈M . Such large scale context is important in a relational data mining approach, using multi sources of knowledge integration, in order to facilitate the analysis.
4
http://www.genome.jp/dbget/
5
Since the generated lattice is very large, that is containing 730 concepts, we will not display it in a small figure. An intelligent analysis consists of choosing pertinent concepts, i.e., those containing reasonable number of genes sharing im-portant attributes. These concepts are situated at what it is commonly named the iceberg of the lattice. For example, concept id 163 has 20 genes (objects in its extension) and 279 attributes. Genes of this concept are potentially im-portant since they share two different fuzzy profiles FD-GEP: Profile 2 and Profile 20. They also share the pathways Cytokine-cytokine receptor interaction (hsa:04060), Taste transduction (hsa:04742), Olfactory transduction (hsa:04740), Jak-STAT signaling pathway (hsa:04630), Focal adhesion (hsa04510) and Axon guidance (hsa04360) pathways. Cytokines are essential proteins that apply con-trol over entire cell populations to fight infections and other pathologies, but can by themselves cause disease. Therefore, cytokine related drugs act either by stimulating or blocking their activities [20]. The olfactory transduction pathway was also in a recent study significantly associated with risk of pancreatic cancer [21]. Moreover, the two profiles in which are affected genes of this analyzed for-mal concept, are interesting since they reflects transcriptomic behavior of genes that are disregulated in normal tissue (S1) vs. cancer tissue (S2) (see their
defi-nition in table 2). Notice that in this table, these two profiles share a total of 24 genes.
Such results represent the advantage of our relational data mining approach for discovering knowledge from transcriptomic data using domain knowledge inte-gration. The important data mining challenge relates to interpret why genes are sharing such attributes. The quantitative analysis of concepts needs a comple-mentary qualitative investigation to extract the most representative functions in the rest of attributes and to highlight those who are specifically related to genes that are in the extension of the pertinent formal concepts. This is the important step (n 7) in the framework figure 2 that is described in the following section.
5
Results of the Enrichment Analysis of the Obtained
Concepts
Enrichment analysis tends to extract most specific functions related to a group of genes. It is based on statistical P-value calculation that is classically applied to genes sharing the same expression profile [22]. The results of such studies usually consist in sets of GO terms characterizing the biological function predominantly represented in a list of genes, thereby suggesting which function or process is affected when the behavior of this group of genes varies.
The standard method for the identification of highly enriched GO terms of a target set of genes uses the hypergeometric distribution [22]. The intension of each concept can be reduced to a bag of GO terms, since expression pro-files, pathways and interactors are sets of genes annotated by GO annotation terms. The resulting lists of GO terms may be large and highly redundant, and thus difficult to interpret. Given a total number of genes N, with B of these genes associated with a particular GO term and n of these genes in
the target set, then the probability that b or more genes from the target set are associated with the given GO term is given by the hypergeometric tail: P (X ≥ b) = Hyper(b, N, B, n) = Σi=bmin(n,B)( n )i( N )−nB−i
( N ) B . In our case, the
value N reflects the total number of genes for human species. The target set of n genes are those in the intension of the interesting concept.
Table 3 summarizes an example of the enrichment process of some formal con-cepts of the produced lattice with the 222 cancer genes. For each concept id, we have the size of its extension and intension respectively, followed by P value of the predominant biological functions of genes in this concept. For example concept 163, has 20 genes and 279 attributes. We can observe 4 highly biologi-cal functions that serve in the enrichment were extracted. Highlighted functions are {integral to membrane, intrinsic to membrane, extracellular ligand-gated ion channel activity, neurotransmitter receptor activity}, with Min P value= 5.3E-8.
A deep analysis of formal concept 223 revealed that it contains 5 genes grouped
Concept ID —Extension— —Intension— Min P Value Some Enriched Functions integral to membrane,
163 20 279 5,3E-8 intrinsic to membrane,
extracellular ligand-gated ion channel activity, neurotransmitter receptor activity
zinc ion binding,
530 6 85 5,6E-3 transition metal ion binding,
regulation of transcription, regulation of RNA metabolic process
zinc ion binding,
220 5 95 1,8E-4 cation binding,nucleoplasm,
intracellular organelle lumen, perinuclear region of cytoplasm
Cellular response to cAMP,
223 5 33 5E-4 water transport,
transport, canalicular bile acid transport , Golgi apparatus,sialyltransferase activity,
1200 4 74 3,2E-4 integral to Golgi membrane,
glycosylation, protein amino acid glycosylation
ATPase activity,
781 6 106 5,8E-7 coupled to transmembrane movement of substances,
ATPase activity, coupled to movement of substances,
hydrolase activity, acting on acid anhydrides,
catalyzing transmembrane movement of substances, P-P-bond-hydrolysis-driven transmembrane transporter activity
Table 3. Example of some formal concepts from the lattice, and the enrichment anal-ysis of their intension.
regarding their 33 shared attributes. From these genes there is AQP8 aquaporin 8 whose expression is no longer detectable in colorectal tumors [23]. It is in-volved in Aquaporin-mediated transport, organism-specific biosystem pathway. In fact AQP8 gene is found in the FD-GEP Profile 14 corresponding to genes under-expressed in tumor (S2) vs the normal situation (S1). Enriched functions
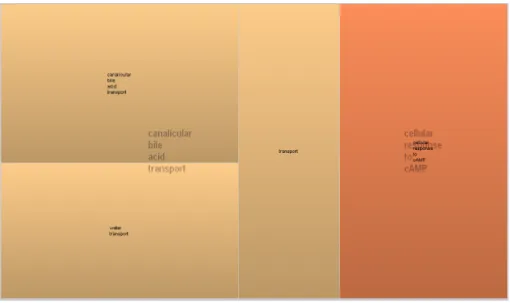
are relative to Transport functions. Transport processes are important in the physiology of the digestive system. A treemap6 view of the important biological
6
functions in this formal concept are illustrated in figure 3. The size of each rect-angle reflects the importance of the function that corresponds to the smallest p value of the enriched function.
These examples can be considered as positive controls, confirming the validity
Fig. 3. An example of the treemap illustrating the enriched functions relative to genes in concept 223.
of the bi-classification results.
6
Discussions and Conclusion
We presented in this paper a method for data mining and knowledge discovery from gene expression data. We have shown that it is possible to use FCA in a bi classification process for extracting enriched biological functions of genes sharing similar expression profiles, metabolic pathways and interactors. This relational and integrative representation of gene expression data could help biologists to characterize biological processes involved in the developments of cancers. Transcriptomic data are represented in our framework as a formal context includ-ing the list of the analyzed genes considered here as objects. Fuzzy differential profiles, Gene Ontology terms, metabolic pathways and interactors are consid-ered as attributes in the same formal context. Our recently proposed definition of the Fuzzy Differential Genes Expression Profiles FD-GEP, allows classify-ing genes through fuzzy sets when there are differential physiological relations between biological situations. This combination of different and heterogeneous attributes as integrated source of knowledge can considerably help biologists
during the interpretation of the results.
As perspectives, we would consider the markers for different types of diseases that are listed OMIM database (Online Mendelian Inheritance in Man)7in order
to extend the attributes in the formal context. To avoid the complexity of the model, we would like to exploit the possible semantic and functional similarities that may exist between genes in a dimensionality reduction analysis. This can be performed by calculating semantic similarity for example between genes of pathways and interactors in order to classify theme in distinct new clusters. This task could be done by our performant semantic similarity measure that is called IntelliGO [9].
References
1. Roland B. Stoughton. Application of dna microarrays in biology. Annual Review of Biochemistry, 74:53–82, 2005.
2. Michael B. Eisen, Paul T. Spellman, Patrick O. Brown, , and David Botstein. Cluster analysis and display of genome-wide expression patterns. Aproc Natl Acad Sciv USA, 278(5338):14863–14868, 1998.
3. Alvis Brazma, Jaak Vilo, and Edited Gianni Cesareni. Gene expression data anal-ysis. FEBS Letters, 480:17–24, 2000.
4. Audrey P Gasch and Michael B Eisen. Exploring the conditional coregulation of yeast gene expression through fuzzy k-means clustering. Genome Biology, 3(11), October 2002.
5. S. Tavazoie, J. D. Hughes, M. J. Campbell, R. J. Cho, and G. M. Church. Sys-tematic determination of genetic network architecture. Nature Genetics, 22:281 – 285, 1999.
6. Hadenfalk, DUGGAN David, YIDONG CHEN, RADMACHER Michael, BIT-TNER Michael, SIMON Richard, MELTZER Paul, GUSTERSON Barry, ES-TELLER Manel, KALLIONIEMI Olli-P, WILFOND Benjamin, BORG Ake, and TRENT Jeffre. Gene-expression profiles in hereditary breast cancer. The New Journal of Medicine, 344:539–48, 2001.
7. Emilie Gurin, Gwenalle Marquet, Julie Chabalier, Marie-Brengre Troadec, Chris-tiane Guguen-Guillouzo, Olivier Loral, Anita Burgun, and Fouzia Moussouni. Combining biomedical knowledge and transcriptomic data to extract new knowl-edge on genes. J. Integrative Bioinformatics, 3(2), 2006.
8. Sidahmed Benabderrahmane. Ontology-based gene set enrichment analysis using an efficient semantic similarity measure and functional clustering. In Proceedings of the 4th International conference on Web and Information Technologies, ICWIT 2012, Sidi Bel Abbes, Algeria, April 29-30, 2012, pages 151–159, 2012.
9. Benabderrahmane Sidahmed et al. Intelligo: a new vector-based semantic similarity measure including annotation origin. BMC Bioinformatics, 11(1):588, 2010. 10. Benabderrahmane Sidahmed. et al. Ontology-based functional classification of
genes: Evaluation with reference sets and overlap analysis. In Bioinformatics and Biomedicine Workshops (BIBMW), 2011 IEEE International Conference on, pages 201 –208, nov. 2011.
7
11. Sidahmed Benabderrahmane et al. Functional classification of genes using semantic distance and fuzzy clustering approach: evaluation with reference sets and overlap analysis. I. J. Computational Biology and Drug Design, 5(3/4):245–260, 2012. 12. A Napoli. A smooth introduction to symbolic methods for knowledge discovery.
Handbook of Categorization in Cognitive Science., pages 913–933, 2005.
13. B. Ganter and R. Wille. Formal Concept Analysis: Mathematical foundations. Springer, Ganter99, 1999.
14. S. Blachon, J. Besson, C. Robardet, J-F. Boulicaut, O. Gandrillon, and R.G. Pensa. Clustering formal concepts to discover biologically relevant knowledge from gene expression data. In silico Biology, 7(4-5):467–483, 2007.
15. Sidahmed Benabderrahmane. Biomedical knowledge extraction using fuzzy differ-ential profiles and semantic ranking. In Niels Peek, Roque Mar´ın Morales, and Mor Peleg, editors, AIME, volume 7885 of Lecture Notes in Computer Science, pages 84–93. Springer, 2013.
16. Sidahmed Benabderrahmane. Enhancing transcriptomic data mining with seman-tic ranking: Towards a new functional spectral representation. In Ignacio Rojas and Francisco M. Ortu˜no Guzman, editors, IWBBIO, pages 721–730. Copicentro Editorial, 2013.
17. Kristian Ovaska, Marko Laakso, and Sampsa Hautaniemi. Fast gene ontology based clustering for microarray experiments. BioData Mining, 1(1):11, 2008. 18. Minoru Kanehisa, Susumu Goto, Yoko Sato, Masayuki Kawashima, Miho
Furu-michi, and Mao Tanabe. Data, information, knowledge and principle: back to metabolism in kegg. Nucleic Acids Research, 42(D1):D199–D205, 2014.
19. Heather J J. Cordell. Genome-wide association studies: Detecting gene-gene inter-actions that underlie human diseases. Nature reviews. Genetics, May 2009. 20. Gideon Schreiber and Mark R Walter. Cytokine receptor interactions as drug
targets. Current Opinion in Chemical Biology, 14(4):511 – 519, 2010.
21. Peng Wei, Hongwei Tang, and Donghui Li. Insights into pancreatic cancer etiol-ogy from pathway analysis of genome-wide association study data. PLoS ONE, 7(10):e46887, 10 2012.
22. Eran Eden, Roy Navon, Israel Steinfeld, Doron Lipson, and Zohar Yakhini. Gorilla: a tool for discovery and visualization of enriched go terms in ranked gene lists. BMC Bioinformatics, 10(1):48, 2009.
23. Fischer Helene et al. Differential expression of aquaporin 8 in human colonic epithelial cells and colorectal tumors. BMC Physiology, 1(1):1, 2001.