HAL Id: hal-00813595
https://hal.archives-ouvertes.fr/hal-00813595
Submitted on 25 Apr 2013
HAL is a multi-disciplinary open access
archive for the deposit and dissemination of
sci-entific research documents, whether they are
pub-lished or not. The documents may come from
teaching and research institutions in France or
abroad, or from public or private research centers.
L’archive ouverte pluridisciplinaire HAL, est
destinée au dépôt et à la diffusion de documents
scientifiques de niveau recherche, publiés ou non,
émanant des établissements d’enseignement et de
recherche français ou étrangers, des laboratoires
publics ou privés.
Large scale analysis of HTTP Adaptive Streaming over
the Mobile Networks
Nathalie Amann, Ali Gouta, Dohy Hong, Anne-Marie Kermarrec, Yannick Le
Louedec
To cite this version:
Nathalie Amann, Ali Gouta, Dohy Hong, Anne-Marie Kermarrec, Yannick Le Louedec. Large scale
analysis of HTTP Adaptive Streaming over the Mobile Networks. 15èmes Rencontres Francophones
sur les Aspects Algorithmiques des Télécommunications (AlgoTel), May 2013, Pornic, France. pp.1-4.
�hal-00813595�
over the Mobile Networks
Nathalie Amann,
2Ali Gouta,
1,2Dohy Hong,
3Anne-Marie Kermarrec,
1and Yannick Le Louedec
21
Inria Rennes-Bretagne Atlantique, Rennes/2
Orange Labs, Lannion/3
N2Nsoft, Paris
HTTP Adaptive Streaming technology (HAS) is getting widely adopted by Content Providers, Content Delivery Network service providers (CDN) and Telecom Operators (Telcos). In HAS, video contents are segmented into chunks which sizes usually range between 2 and 10 seconds worth of audiovisual content. These chunks are then delivered upon user requests. This specific delivery scheme controlled by the client and the increasing number of HTTP requests raise new challenges in terms of content caching strategies. In this paper, we analyze the users’ behavior when requesting HAS-based content by considering a real HAS dataset collected in France over the Mobile Networks of a major French Telecom Operator. These observations led us to propose several possibilities to enhance the content caching strategies in such mobile networks.
Keywords:Adaptive streaming, catch-up, live, dataset, caching
1
Introduction
The proliferation of mobile smart phones is significantly changing the mobile communication landscape. Smart phones are now commonly used by users to watch TV programs either in live or on-demand. In this paper, we conduct an in-depth analysis of the mobile clients’ behavior when requesting HAS content, using a real HAS dataset collected in France over the Mobile Networks of a major French Telecom Operator. Based on the patterns observed in this analysis, we investigate through simulations the opportunity to enhance the caching strategies for HAS-based contents.
2
Data set
We have deployed 5 network probes on the Gi interfaces of the 5 GGSNs deployed by the Mobile Operator. We captured a total of 8,131,747 HTTP adaptive streaming sessions from 485,544 unique active clients, over 3G/HSPA/HSPA+ and 2G (EDGE) radio access networks during the measurement period. The Data collection was conducted over a period of 6 weeks and one day, from February 28th to April 10th, 2012. These HAS sessions were mainly Apple HTTP Live Streaming (HLS) sessions and Microsoft smooth streaming (HSS) sessions. The probe system identifies an HAS session by the first HTTP-GET request on the first chunk for which the URL address ends either with a .ts for a HLS stream, or with a .ism for a HSS stream. Each HAS session corresponds to the set of chunks sent to the same client over a period of time. The probe system captures all headers containing useful information from the packets carrying these chunks, such as the packet size and the sequence number. All information is aggregated per TCP connection and exported into a database, from where it is analysed. Each TCP connection corresponds to one chunk. This means that the number of requested chunks during one HAS session is equal to the number of persistent TCP connections established between the server and the client over a period of time. In the remainder of the paper we focus on the Apple HLS sessions, as they represent more than 99%
Nathalie Amann, Ali Gouta, Dohy Hong, Anne-Marie Kermarrec, and Yannick Le Louedec of the HAS sessions in the collected dataset. They correspond mainly to Live sessions : where clients watch a live TV program, and Catch-up TV sessions : where clients watch on-demand videos previously broadcasted in live.
3
HAS traffic analysis
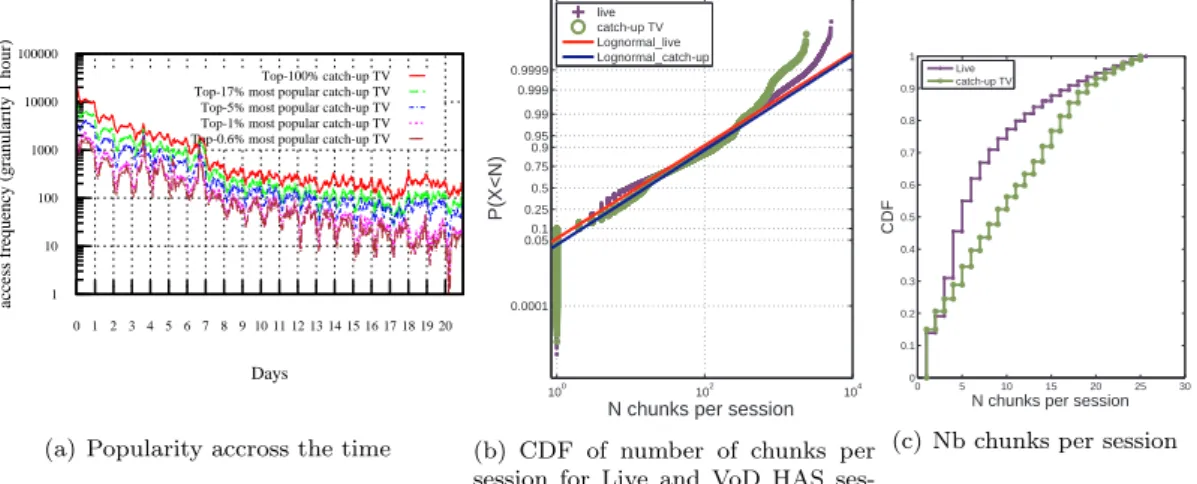
We analyze in Figure 1(a) the access frequency measured at a granularity of one hour of the top-0.6%, top-1%, top-5%, top-17% and top-100% most requested catch-up TV videos over the whole period of data collection. For instance, in order to compute the access frequency of the top-5% most requested catch-up TV videos at day 7 we concentrate on the 5% catch-up TV videos which were most requested over the whole period of data collection ; the access frequency is then the sum of the total number of requests observed for each of these videos at day 7 following the time of the first user request for these considered videos. We observe that the popularity of these catch-up TV videos is age-sensitive : the clients’ requests fade significantly as time goes on. The number of requests for such contents decreases with a ratio of 1/8 just 2 days after they were made available to the mobile audience. It further decreases with a ratio of 1/10 the seventh day and 1/40 the eight day. This drastic popularity decrease between day 7 and day 8 is partly due to the fact that some content providers purge all 7-day old catch-up TV videos from their catalogue. Another reason is that viewers are not likely to watch the same video multiple times as they do for mutable web objects. This Fetch-at-most-once like behavior was initially introduced by Gummadi et al. [GDS+03] while trying to understand the file popularity paradigm in P2P
downloads. Throughout our dataset, we were able to validate this assumption for catch-up TV contents and we found out that in average 82-percentile of the clients do request at most once a given catch-up TV video, while around 97-percentile of the clients do request the same content at most 3 times. 1 10 100 1000 10000 100000 0 1 2 3 4 5 6 7 8 9 10 11 12 13 14 15 16 17 18 19 20
access frequency (granularity 1 hour)
Days
Top-100% catch-up TV Top-17% most popular catch-up TV Top-5% most popular catch-up TV Top-1% most popular catch-up TV Top-0.6% most popular catch-up TV
(a) Popularity accross the time
100 102 104 0.0001 0.050.1 0.25 0.5 0.75 0.9 0.95 0.99 0.999 0.9999
N chunks per session
P(X<N)
live catch-up TV Lognormal_live Lognormal_catch-up
(b) CDF of number of chunks per session for Live and VoD HAS ses-sions 0 5 10 15 20 25 30 0 0.1 0.2 0.3 0.4 0.5 0.6 0.7 0.8 0.9 1
N chunks per session
CDF
Live catch-up TV
(c) Nb chunks per session
Figure 1:Chunk properties
Figure 1(b) represents the Cumulative Distribution Function (CDF) of the number of requested chunks per HAS session, for both live TV and catch-up TV videos. Using the Maximum Likeli-hood Estimation (MLE) we determined that log-normal distribution laws are best matching the respective CDFs of the live TV and catch-up TV video sessions. Then we applied the Kolmogorov Serminov goodness-of-fit (KS) test to assess the accuracy of the estimated parameters of these log-normal laws. The KS test is well adapted here given the high number of samples of catch-up TV sessions and Live sessions within the dataset. The estimated parameters of the log-normal laws and the results of the KS test are provided in Table 1, showing a confidence level of up to 95%. We also
σ µ test statistic p value Lognormal live 1.57033 2.50498 0.1019 0.2368 Lognormal catch-up TV 1.54 2.76728 0.0839 0.4648
Table 1:estimated parameters of the KS-test
note on Figure 1(b) that the CDFs diverge from the log-normal laws when the HAS sessions exceed 1000 chunks. A minority of clients keeps on requesting chunks over a much longer period than the others, and some of them until the end of the video. In the case where the chunks are delivered by edge servers - belonging for example to a CDN or a set of transparent caching servers - such a tailed profile could degrade the caching efficiency of these edge servers. This degradation would be even amplified as the cache size of these edge servers is limited and their caching replacement algorithm is highly reactive to the end user requests. For instance, if an edge server is configured with the LRU caching algorithm (Least Recently Used), any request for a chunk located at the end of a video will make this server cache this chunk and set it at the top of its LRU ranking. Then, even if there is no further request for that chunk, it will remain for a while in the cache until being purged, possibly at the expense of other more frequently requested chunks. It is therefore worth to investigate the interest of adapting caching algorithms so that they do not cache as a priority the last and very infrequently requested chunks from the HAS videos.
Figure 1(b) shows also that 90% of live and catch-up video sessions do not exceed 100 chunks, which corresponds in the case of Apple HTTP Live to 16 minutes worth of video content (each chunk having 10 seconds of video content). Authors in [YHZ+06] analyzed sessions’ duration collected
from PowerInfo VoD system and found out that 52.55% of the sessions do not exceed 10 minutes. In contrast, we find that for the same duration 80% of the HAS sessions are composed of 60 chunks. This may be explained by the fact that the PowerInfo VoD system is used to deliver a highest diversity of content types, including short videos and premium movies, while in our case, the dataset corresponds to TV contents offered by the telecom operator for free. At last, the range where the CDFs of the live and catch-up TV HAS sessions differ most is on the first 25 chunks of the sessions. We zoom on this range in Figure 1(c). Clearly, the proportion of Live sessions within the range of 1 to 8 chunks per session is much higher than the proportion of Live sessions lasting from 9 to 25 chunks per session. This may be explained by the fact that the users start by spending some time in discovering or recognizing the program broadcasted in live. After this discovery phase, if they do not like the program, they rather give up or switch to another live program.
4
Caching chunk-based contents
We now investigate the opportunity to enhance the caching efficiency of the edge servers involved in the delivery of the chunks by extending their cache replacement algorithm with a chunk-position threshold beyond which these edge servers would not cache any chunk. The evaluation relies on a trace-driven simulation which is based on a seven-day trace from the collected HAS dataset, constituted of 29,921,935 HTTP client requests. The trace file contains information about the timestamp of each new session, the video identifier, and the number of chunks requested by the clients in each session. We simulate the scenario where all HAS traffic gets forwarded via a proxy-cache deployed just above the 5 GGSNs. For sake of simplicity the simulation relies on the following assumptions :
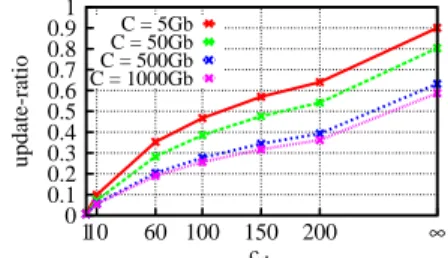
– The videos are encoded at 500kbps and all chunks are 10 seconds worth of video content. – We only consider the Catch-up TV sessions and we use LRU as a cache replacement algorithm. Figure 2 represents the average hit-ratio and average update-ratio for different values of the cache capicity (C) and the value of the threshold (cth). The cache hit-ratio represents the ratio of requests
succefully handled by the cache and the cache update-ratio represents the ratio of requests causing a cache miss and thus additional network trafic to update the cached objects.
Figure 2(a) shows that for small cache sizes (C < 50Gb) setting Cthto 100 leads to approximately
Nathalie Amann, Ali Gouta, Dohy Hong, Anne-Marie Kermarrec, and Yannick Le Louedec 0 0.05 0.1 0.15 0.2 0.25 0.3 0.35 0.4 0.45 110 60 100 150 200 ∞ hit-ratio cth C = 5Gb C = 50Gb C = 500Gb C = 103Gb
(a) Cache Hit-ratio with respect to cth
0 0.1 0.2 0.3 0.4 0.5 0.6 0.7 0.8 0.9 1 110 60 100 150 200 ∞ update-ratio cth C = 5Gb C = 50Gb C = 500Gb C = 1000Gb
(b) Cache Update-ratio with respect to cth
Figure 2:Hit-ratio and update
0 0.1 0.2 0.3 0.4 0.5 0.6 1 10 100 1000 10000
hit-ratio per chunk
ci cth=1 cth=10 cth=60 cth=100 cth=150 cth=200 cth=inf (a) size = 50 Gb 0 0.1 0.2 0.3 0.4 0.5 0.6 1 10 100 1000 10000
hit-ratio per chunk
ci cth=1 cth=10 cth=60 cth=100 cth=150 cth=200 cth=inf (b) size = 500 Gb 0 0.1 0.2 0.3 0.4 0.5 0.6 1 10 100 1000 10000
hit-ratio per chunk
ci cth=1 cth=10 cth=60 cth=100 cth=150 cth=200 cth=inf (c) size = 1000 Gb
Figure 3:Hit-ratio per chunk position
Figure 2(b) shows that this allows to save up to 50% on cache-update ratio. For larger cache sizes (C > 50Gb), setting Cthto 200 leads to approximately the same cache hit ratio as if there were no
chunk-position threshold (i.e.Cth= ∞), while this allows to gain 20% on the cache update-ratio.
This can contribute to reduce significantly the cache replacement processing time, especially in large caches where the object lookup time is critical. Figure 3 depicts the average cache hit-ratio for each position of the chunks in the temporal sequence of the videos they belong to (i.e. the average cache hit-ratio for each chunki during the whole simulation). We call this the cache hit
ratio per chunk position, and we note ci the position of the i st
chunk from the content in the dataset. We note that setting a chunk threshold (cth) improves the cache hit ratio per chunk
position for all chunks which positions ci are below this chunk threshold (ci < cth). The gain on
the cache hit ratio per chunk position may reach up to 20% if the chunk threshold (cth) is set low
(e.g.cth= 10). When setting the threshold to up to 60 chunks per session (80% of the catch-up TV
sessions) we may improve up to 5% the average cache hit-ratio for all chunki earlier than cth= 60.
Conclusion : This paper presents the analysis of a large and recent dataset of HAS sessions in French mobile networks, which is a crucial pre-requisite to improve their performances. So this paper shows how fine tuning the caching logic with respect to the specific timing patterns of the HAS sessions leads to significant gains on the caching efficiency.
R´
ef´
erences
[GDS+03] Gummadi, Dunn, Saroiu, Gribble, and Levy Zahorjan, editors. Measurement modeling
and analysis of a peer-to-peer file-sharing workload, 2003. In ACM SIGOPS.
[YHZ+06] Yu, Hongliang, Zheng, Dongdong, Zhao, Ben Y., Zheng, and Weimin, editors.