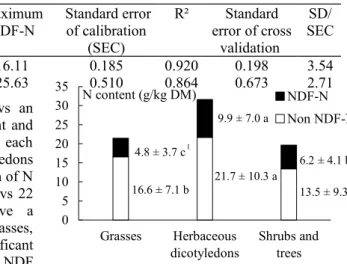
Figure 1 Predicted N fractions of the forages 1For a same fraction, values followed by different
letters differ significantly (p<0.05)
A rapid estimation of nitrogen bound to neutral detergent fibre in forages by near
infrared reflectance spectroscopy
J. Bindelle1, G. Sinnaeve2, P. Dardenne2, P. Leterme3 and A. Buldgen1
1Faculté universitaire des Sciences agronomiques de Gembloux, Unité de Zootechnie, 2 Passage des Déportés,
5030, Gembloux, Belgium Email address: bindelle.j@fsagx.ac.be, 2Centre wallon de Recherches agronomiques,
Département Qualité des Productions agricoles, 24 Chaussée de Namur, 5030, Gembloux, Belgium 3École
nationale vétérinaire de Lyon, Unité de Zootechnie, 1 avenue Bourgelat, 69280 Marcy l’Etoile, France
Keywords: forages, NIRS, neutral detergent fibre, nitrogen
Introduction Near infrared reflectance spectroscopy (NIRS) is widely used as a rapid method for the evaluation of the chemical composition or the nutritive value of foodstuffs (Givens et al., 1997). The determination of the neutral detergent fibre (NDF) bound N (NDF-N), which is highly variable in forages (Shayo & Udén, 1999), is expensive. The purpose of this study was to test the use of NIRS in the prediction of NDF-N in various forages. Materials and methods The study used various fresh forages and hays from temperate, tropical and Mediterranean regions (n=288), consisting of grasses (n=131), herbaceous dicotyledons (n=38) and shrubs or trees (n=119). All samples were oven dried at 60°C and ground to pass a 1 mm mesh screen. After NIRS-spectra of the samples were recorded, a subset of 118 samples underwent a NDF extraction and N content of the residues were determined. Calibration, using the partial least squares procedure were developed for NDF-N within the sub-set and tested by cross validation. They were finally used to estimate the NDF-N of the 288 forages.
Results Table 1 indicates the accuracy of the prediction of NDF-N for the 3 groups of forages. SD/SEC and R² values show that the quality of the calibration is satisfactory for grasses and shrubs. The predictions for the dicotyledons are less accurate (SD/SEC < 3) due to a lower number of samples, but the predicting equation can however be considered as satisfactory (R² > 0.85).
Predictions on the 288 samples (Figure 1) shows an important variability in the absolute NDF-N content and in the percentage of N bound to the NDF within each group of plants, and also between them. The dicotyledons and the shrubs have a significantly higher proportion of N bound to the NDF compared to the grasses (31 % vs 22 %, respectively). However, dicotyledons have a significantly higher non NDF-N content than the grasses, followed by the shrubs. For each group, significant regression equations linking NDF-N to Total-N and NDF content were also found (R² from 0.80 to 0.89, p < 0.001). Conclusions The present study showed that NIRS is a valuable method to offer a rapid estimation of the NDF-N
content in forage resources. A variable and sometimes important part of the N is bound to the NDF, depending on the forage. It seemed also possible to obtain a reasonable estimate of the NDF-N fraction of a forage by considering the forage group and determining NDF and total-N contents.
References
Givens, D.I., J.L. De Boever & E.R. Deaville (1997). The principles, practices and some future applications of near infrared spectroscopy for predicting the nutritive value of foods for animals and humans. Nutrition
Research Reviews, 10, 83-114.
Shayo C.M. & P. Udén (1999). Nutritional uniformity of crude protein fractions in some tropical browse plants estimated by two in vitro methods. Animal Feed Science and Technology, 78, 141-151.
Table 1 Range of NDF-N (g/kgDM) in the prediction subsets and quality of the
predicting equations
n Minimum
NDF-N MaximumNDF-N Standard errorof calibration (SEC) R² Standard error of cross validation SD/ SEC Grasses 49 1.02 16.11 0.185 0.920 0.198 3.54 Herbaceous dicotyledons 23 1.93 25.63 0.510 0.864 0.673 2.71 0 5 10 15 20 25 30 35 Grasses Herbaceous dicotyledons Shrubs and trees NDF-N Non NDF-N N content (g/kg DM) 9.9 ± 7.0 a 21.7 ± 10.3 a 16.6 ± 7.1 b 13.5 ± 9.3 c 4.8 ± 3.7 c1 6.2 ± 4.1 b