Molecular Ecology (2005) 14, 2373–2388 doi: 10.1111/j.1365-294X.2005.02597.x
Blackwell Publishing, Ltd.
Conservation genetics and population history of the
threatened European mink
Mustela lutreola
, with an
emphasis on the west European population
J . R . M I C H A U X ,*† O . J . H A R D Y ,‡ F . J U S T Y ,§ P . F O U R N I E R ,¶ A . K R A N Z ,** M . C A B R I A ,†† A . D A V I S O N ,‡‡ R . R O S O U X§§ and R . L I B O I S*
*Unité de recherches zoogéographiques, Institut Botanique (Bat. B-22). Université de Liège, 4000 Liège (Sart Tilman), Belgium, †Centre de Biologie et de Gestion des Populations (CBGP), UMR 1062, Campus International de Baillarguet, CS 30016, 34988, Montferrier/ Lez (Montpellier) cedex, ‡Laboratoire D’Eco-éthologie Evolutive, Université Libre de Bruxelles, 1050 Brussels, Belgium, §Institut des sciences de l’évolution, Université de Montpellier 2, 34005 Montpellier cedex 2, ¶Groupe de Recherche et d’Etudes pour la Gestion de l’Environnement (GREGE), Route de Préchac, 33730 Villandraut, France, **Department Wildlife Biology and Game Management, University Agricultural Sciences, Boku, Wien, Austria, ††Universidad del Pais Vasco, Fac. Farmacia; Dpto. Zoología y BCA C/Paseo de la Universidad 7, 01006, Vitoria, Spain, ‡‡Institute of Genetics, Queen’s Medical Centre, University of Nottingham, Nottingham, NG7 2UH, UK, §§Muséum des Sciences Naturelles, 6 rue Marcel Proust, F-45000 Orléans
Abstract
In species of great conservation concern, special attention must be paid to their phylogeog-raphy, in particular the origin of animals for captive breeding and reintroduction. The endangered European mink lives now in at least three well-separated populations in northeast, southeast and west Europe. Our aim is to assess the genetic structure of these populations to identify ‘distinct population segments’ (DPS) and advise captive breeding programmes. First, the mtDNA control region was completely sequenced in 176 minks and 10 polecats. The analysis revealed that the western population is characterized by a single mtDNA haplotype that is closely related to those in eastern regions but nevertheless, not found there to date. The northeast European animals are much more variable (ππππ = 0.012,
h = 0.939), with the southeast samples intermediate (ππππ = 0.0012, h = 0.469). Second, 155 European mink were genotyped using six microsatellites. The latter display the same trends of genetic diversity among regions as mtDNA [gene diversity and allelic richness highest in northeast Europe (HE = 0.539, RS = 3.76), lowest in west Europe (HE = 0.379, RS = 2.12)], and provide evidences that the southeast and possibly the west populations have undergone a recent bottleneck. Our results indicate that the western population derives from a few animals which recently colonized this region, possibly after a human introduction. Microsatellite data also reveal that isolation by distance occurs in the western population, causing some inbreeding because related individuals mate. As genetic data indicate that the three popula-tions have not undergone independent evolutionary histories for long (no phylogeographical structure), they should not be considered as distinct DPS. In conclusion, the captive breeding programme should use animals from different parts of the species’ present distribution area.
Keywords: conservation biology, microsatellites, mitochondrial DNA, Mustela lutreola, phylo-geography, population genetics
Received 16 November 2004; revision accepted 1 April 2005
Introduction
The European mink (Mustela lutreola) is one of the most threatened carnivores (Baillie & Groombridge 1996; http://
www.redlist.org). Its distribution started to fragment dur-ing the 19th century, and populations continue to decline dramatically (Van Bree & Saint Girons 1966; Camby 1990; Maran 1992; Tumanov 1992; de Bellefroid 1999; Sidorovich 2000; Maizeret et al. 2002). Presently, it lives in well-separated populations: in Estonia, Belarus and Russia [Northeast (NE) Europe; Sidorovich 2000], in Romania, namely the Danube Correspondence: Johan Michaux, Fax: 0032 4 366 38 45, E-mail:
2374 J . R . M I C H A U X E T A L .
delta [southeast (SE) Europe; Gotea & Kranz 1999] and finally in northern Spain (Ruiz-Olmo & Palazón 1991) and southwestern France [west (W) Europe; Van Bree & Saint Girons 1966; Camby 1990].
Understanding the population history of European mink is a key part in the conservation effort, with studies ever more urgent because of the continuing decline of the species, and captive breeding/reintroduction programmes that are already underway in various European countries (Spain, Italy, France, Germany, Czech Republic, Estonia etc.). Locally, the French restoration plan (Anonymous 1999) has pro-posed to release captive-bred individuals into the wild as a reinforcement measure if the other restoration measures do not appear sufficient, so the choice of the animals to be bred is of great importance. One possibility is that if the western population is genetically distinct from the eastern ones, and if the animals are locally adapted, then outbreed-ing depression (Lynch 1991) could result from breedoutbreed-ing between them. On a European scale, the captive breeding programme has the stated aim to ‘maintain in European zoos and other breeding facilities a population capable to maintain 90% of its heterozygosity for 100 years’ (http:// www.lutreola.ee/index.html). Captive-bred minks have already been released on Hiiumaa Island (Estonia). Thus, it is imperative that informed decisions are made regarding their management, based at least in part on genetic data.
In a preliminary study (Michaux et al. 2004b), we used the complete mitochondrial control region to investigate vari-ation across a large part of the extant range of the European mink, including samples from W and NE Europe plus two individuals from Romania. We concluded that European mink probably colonized Europe from a single refugium after the last glaciation (Michaux et al. 2004b) because W European populations were fixed for a single haplotype. Despite low genetic differentiation between the studied populations, following the precautionary principle, we suggested that mink from the three geographically separ-ate populations should be managed separsepar-ately.
To confirm these results and be able to make more spe-cific management advice, we conducted a new study on a larger sample, particularly for W Europe, using mitochon-drial DNA markers and for the first time, nuclear micro-satellites. More specifically, we tried to answer the following questions: (i) Are the three geographically separated popu-lations genetically differentiated? (ii) Does the level of genetic diversity differ between populations? (iii) Have these populations been stable through time or have they survived recent bottleneck? (iv) Are the results using mito-chondrial and microsatellites markers congruent? Speci-fically for the French samples, we used the microsatellite data to determine if (i) genetic substructure exists; (ii) there is evidence for isolation by distance, and (iii) genetic dif-ferentiation is associated with drainage basin or rivers.
Methods
Samples
A total of 176 European mink were studied, 109 from France, 15 from Spain, 34 from Romania (Danube delta), 3 from Estonia, 2 from Belarus (Vitebsk) and 13 from Russia (Tver and Pskov). The references and the geographical origin of these specimens are given in the Appendix and Fig. 1. In the mitochondrial analysis, they were compared with 10 polecats (Mustela putorius), two steppe polecats (Mustela eversmanii) and two black-footed ferrets (Mustela nigripes).
French, Spanish and Romanian samples were collected either from animals caught, marked and released, or found dead. These tissues are conserved in the tissue collection of J. R. Michaux. The other samples were described previ-ously in Davison et al. (2000).
DNA methods
DNA was extracted from ethanol-preserved tissue using the phenol–chloroform method as described by Sambrook
et al. (1989).
Mitochondrial DNA. The complete mitochondrial con-trol region was amplified using specific primers L0ML (5′-TAT TCTAACTAAACTATTCCCTG-3′) and EML (5′ -CTA TAGATGTRT TTATAACCC-3′). Amplification reactions were carried out in 2 × 50 µL volumes including 25 µL of each 2 µm primer, 20 µL of 1 mm dNTP, 10 µL of 10× Promega reaction buffer B, 2.5 mm MgCl2, 10 µL of purified water and 0.2 µL of 5 U/µL Promega Taq DNA polymerase. Approximately 200 ng of DNA (10 µL) was used per PCR amplification. PCR was performed using an MJ Research PTC100 thermal cycler, employing 33 cycles (20 s at 94 °C, 30 s at 50 °C and 1 min 30 s at 68 °C) with a final extension cycle of 10 min at 68 °C. PCR products were then purified using the Ultra-free DA Amicon kit (Millipore) and directly sequenced. Both strands were sequenced using a BigDye terminator sequencing kit (Applied Biosystems) on an ABI 310 (Applied Biosystems) automated sequencer.
The newly determined sequences from 171 European minks were compared with five European mink (AF207720, AF207721, AF207723, AF207724 and AF207725) and 10 polecat (AF068570, AF207717, AF207718 and AF207726; AJ548803 to AJ54808) partial control region sequences available in GenBank (Appendix). Sequences were aligned using the ed editor (must package; Philippe 1993).
Microsatellites. Pairs of microsatellite primers were selected from previous studies on mustelids (M. vison: Fleming et al. 1999; M. erminea, Martes pennanti, Martes americana, Lutra canadensis: Davis & Strobeck 1998; Fleming et al. 1999). In a first step, 20 pairs of primers were tested on 10 European
C O N S E R V A T I O N G E N E T I C S O F T H E E U R O P E A N M I N K 2375
Fig. 1 Geographic distribution of the Mustela lutreola samples (see Appendix for the sample symbols). The shaded zones correspond to the distribution area of the species (according to T. Maran, personal communication).
2376 J . R . M I C H A U X E T A L .
mink originating from different parts of the distribution area. Positive results were obtained with 18 of them (Mvis002, Mvis020, Mvis022, Mvis072, Mvis075, Mvis099, Mvis92534, Mer005, Mer009, Mer022, Mer 41, Mer095, Ma1, Ma10, Ma19, GG7, GG-14, TT4), so these were then tested on a greater sample (five individuals from each population). Six loci (Mvis020, Mvis072, Mvis075, Mer009, Mer022, Mer 41) were polymorphic and were scored on a total sample of 155 individuals.
Amplification reactions were carried out in 15 µL volumes including ~10 ng of DNA template, 24 µm of each dNTP, 1 mm MgCl2, 3.5 pmoles of the [γ−33P]-dATP labelled for-ward primer, 15 pmoles of the unlabelled reverse primer, 0.75 unit of Taq DNA polymerase (Goldstar, Eurogentec), 75 mm Tris-HCl pH 9, 20 mm (NH4)2SO4, 0.01% (w/v) Tween 20. PCR was performed using a PTC 100 thermal cycler (MJ Research); 94 °C for 5 min, followed by 94 °C for 1 min, 30 s at annealing temperature (varying according the microsatellite), 72 °C for 1 min for 30 cycles, final exten-sion at 72 °C for 5 min. Amplification products (15 µL) were mixed with 6.7 µL formamide loading dye and then electrophoresed in 6% acryl-bisacrylamide and 8 m urea sequencing gels for 3–5 h at about 1800 V. Sequencing reactions of pUC19 vector (Appligene) were also loaded adjacent to the samples, to serve as a size standard. Once dried, gels were exposed to X-ray films for 24–48 h.
Data analyses
Mitochondrial DNA. The aligned sequences were analysed by distance (neighbour joining, NJ; Saitou & Nei 1987), parsimony (MP; Fitch 1971) and maximum-likelihood (ML) methods using paup 4.0b8 (Swofford 1998). The general time reversible (GTR) model and Kimura 2-parameter (K2P) estimator were used for the distance and ML analyses (chosen with modeltest 3.0, Posada & Crandall 1998). These analyses were developed assuming a gamma distribution for substitution rates across sites, where the parameter alpha (Yang 1996) and the proportion of invariant sites (I) were estimated with the ML method using paup. MP analyses were conducted according to a heuristic search and TBR branch swapping option. The robustness of inferences was assessed by bootstrap re-sampling (BP) 1000 random repetitions for MP and distance analyses, and 100 for ML.
A Bayesian approach to phylogeny reconstruction (Yang & Rannala 1997; Huelsenbeck et al. 2001) was also used, implemented in mrbayes 2.01 (Huelsenbeck et al. 2001). Metropolis-coupled Markov chain Monte Carlo sampling was performed with four chains that were ran for 500 000 generations, using default model parameters as starting values. Bayesian posterior probabilities were picked from the 50% majority rules consensus of trees sampled every 20 generations, after removing trees obtained before chains
reached apparent stationarity (‘burn in’ determined by empirical checking of likelihood values).
A network was constructed using the program tcs (Clement et al. 2000) as this method is very useful when sequences are closely related.
Nucleotide (π) and haplotype (h) diversities, were esti-mated using the dnasp program (Rozas & Rozas 1997). Calculations were performed on the main data matrix, including 176 animals. The ‘mismatch distribution’ of sub-stitutional differences between pairs of haplotypes was calculated within the NE and SE geographical groups and compared with a fit to the Poisson model using dnasp (Rozas & Rozas 1997).
Haplotype diversity was partitioned among populations by computing pairwise GST and NST (Pons & Petit 1996) between three geographical separate groups (W Europe, SE Europe, NE Europe) using the software spagedi (Hardy & Vekemans 2002). Contrary to GST, NST accounts for the phylogenetic distances between haplotypes (estimated by the minimum number of mutational events between haplotype sequences) and is expected to be larger than GST
when a phylogeographical pattern occurs (i.e. when related haplotypes co-occur more often within population than random expectation). To test for a phylogeographical pat-tern, 1000 random permutations of haplotype identities were made, keeping the haplotype frequencies and the matrix of pairwise haplotype distances intact, and the dis-tribution of NST values obtained after permutation was compared with the observed value (Burban et al. 1999). Finally, the population genetic structure was determined by analysing the molecular variance (amova available in arlequin 2.000; Schneider et al. 2000). This method estimates the proportion of genetic variation at different hierarchical levels: among groups (corresponding to the three main mink groups: W, SE and NE Europe), among populations within each group (France and Spain for the W group; Russia, Belarus and Estonia for the NE group) and within each population. The program arlequin was also used to calculate ΦST statistics that measure population subdivi-sion analoguous to Wright’s (1992) F-statistics.
Microsatellites. Pairwise FST (Weir & Cockerham 1984) values between the three geographical groups, were computed using fstat version 2.9.3 (Goudet 1995). We compared the levels of genetic diversity among these groups by their gene diversity (HE) and allelic richness (RS) using fstat. RS is the mean number of alleles expected within a sample of defined size (in practice the size of the smallest group) and is therefore appropriate to compare allele richness when sample size varies.
A phylogenetic tree was also constructed on the basis of the microsatellite markers polymorphism using the treemaker 2.0 program (Piry, personal commumication). For this, the bionj algorithm (Gascuel 1997) and the distance
model of Cavalli-Sforza & Edwards (1967) were used. The robustness of inferences was assessed by bootstrap resam-pling (1000 random repetitions).
To discover whether there is a signature of recent bottle-neck events, we used the software bottlebottle-neck (Cornuet & Luikart 1996) which compares the gene diversity observed (HE) with the one expected from the number of alleles per locus (A0) when population size remains constant and for a given mutation model. After a bottleneck, one expects that A0 drops more than HE, so that the observed HE should be higher than that expected on the basis of A0. As the mutation model of microsatellites is thought to be inter-mediate between a stepwise-mutation model (SMM) and an infinite allele mutation model (IAM), we tested bottleneck events assuming each of these models. We used the Wilcoxon signed rank test to test significance as suggested by Cornuet & Luikart (1996).
The inbreeding coefficient, FIS, describing how hetero-zygote frequencies deviate from expectations under panmixia within defined subpopulations, was estimated for each geographical group. In NE Europe, sample sites were considered as different subpopulations because they are quite distant, whereas a single ‘subpopulation’ was assumed in W Europe and in SE Europe. To test FIS, genes were randomized within subpopulations, and loci were jackknifed to estimate standard errors. Computations were carried out using the software spagedi (Hardy & Vekemans 2002). To characterize the genetic structure within the W Euro-pean population (actually the French population as only three Spanish samples could be genotyped), we used spagedi to compute pairwise kinship coefficients between individuals (Fij) using Nason’s multilocus estimator defined in Loiselle et al. (1995). Fij values were regressed on ln(dij), where dij is the geographical distance between the sampled locations of individuals i and j, and the regression slope (b) was used to quantify the extent of isolation by distance. To test for a nonrandom spatial structure, we applied a Mantel test between the matrices of Fij and ln(dij) values using 10 000 randomizations. Fij values were also averaged over a set of mutually exclusive distance classes, giving F(d) values. To determine whether gene flow occurs preferentially within drainage basins, two F(d) curves were computed: one for i-j pairs sampled within a same drainage basin and one for i-j pairs sampled in different basins.
Results
Mitochondrial DNA
Sequences. The complete sequence of the mitochondrial
control region was obtained for 171 European minks and associated to five gene bank sequences (see above). These sequences coming from 50 different localities were added to 10 European polecats from five regions, two steppe
polecats and two black-footed ferrets (Mustela nigripes), used as an outgroup (Michaux et al. 2004) (Table A1). The different haplotypes observed in this data matrix have been deposited in the EMBL GenBank under accession nos AJ548474 to AJ548477 and AJ548803 to AJ548822.
Phylogenetic analyses. The analyses were performed, using
the complete mitochondrial control region, with two Mustela
nigripes, two Mustela eversmannii, 10 Mustela putorius and
176 Mustela lutreola. All the French and Spanish animals share the same mtDNA haplotype with the exception of an hypervariable CnTn array (either 7 or 8 thymine residues) and a variable (from 11 to at least 23) number of copies of an 11 bp minisatellite in the hypervariable region R. It was impossible to determine the exact number of minisatellite copies, when
n > 23, due to sequencing difficulties, so this region was not
considered in any further phylogenetic analysis.
After removal of the CnTn array and the minisatellite repeats, the final data matrix involved 25 different haplo-types and 731 sites, of which 64 were variable and 43 phylo-genetically informative. The mean estimated transition to transversion ratio was 3.0 and the nucleotide frequencies were C 26.3%, T 29.4%, A 27.9%, and G 16.3%.
The neighbour-joining tree (Fig. 2) shows two major clades: the first one corresponding to the polecat, M. putorius, and the second subdividing into two monophyletic groups of
M. lutreola and M. eversmannii. The Bayesian, ML and MP
(one most parsimonious tree, L = 86 steps; CI = 0.68; RI = 0.81) analyses yielded phylogenies of identical structure. Bootstrap values and Bayesian probabilities (BaP) result-ing from these analyses are indicated in Fig. 2. The group corresponding to M. putorius is well supported (BP values for NJ: 71%, MP: 78, ML: 73% and BaP: 0.95). The second group of M. lutreola and M. eversmannii is not supported (BP values for NJ: 38%, ML: 52% and BaP: 0.42). No genetic structure associated to geography is observed within
M. lutreola.
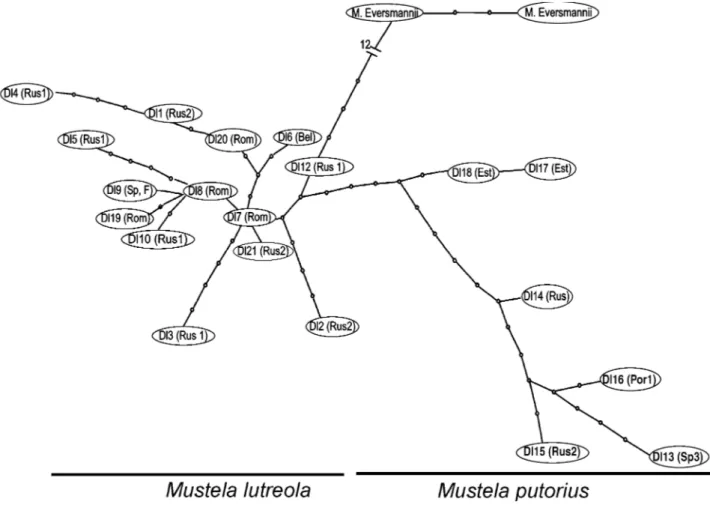
The network analysis (Fig. 3) shows a similar result, i.e. a clear separation between the three species M. eversmannii,
M. putorius and M. lutreola and within this last species, a
total absence of genetic structure associated to geography.
Genetic structure. Nucleotide (π) and haplotype (h)
diver-sities were calculated for each population of M. lutreola (Table 1). Animals from NE Europe (Russia, Estonia, Belarus) had a high nucleotide and haplotype diversity, as compared to the W European samples (France Spain), which shared a single mitochondrial type. The 34 SE European (Romania) animals are characterized by four different haplotypes, so the nucleotide and haplotype diver-sities are intermediate.
As already observed in Michaux et al. (2004), the mismatch distribution of pairwise differences showed a signature of population growth (bell-shape) for the NE European
2378 J . R . M I C H A U X E T A L .
group (Fig. 4a). On the contrary, the SE European popu-lation was characterized by a signature of constant size population (Fig. 4b). Pairwise GST values between geo-graphical groups were all significant (P < 0.001) and are of
0.89 between SE Europe and W Europe; 0.54 between W Europe NE Europe and 0.42 between this last region and SE Europe. NST were lower than GST in all pairwise comparisons (respectively 0.84, 0.39 and 0.22) and haplotype
Fig. 2 Consensus neighbour-joining tree derived from the analysis of the complete mitochondrial control region sequences for 121 European mink, polecats and black-footed ferrets (used as outgroup). Each haplotype is identified by the letters DL + a specific number. The locality codes (see Appendix) are also given for each haplotype. For each well supported node, the different robustness are indicated as followed: neighbour joining/maximum parsimony; maximum likelihood/Bayesian probability.
identity permutation tests were always nonsignificant. Hence, there is no evidence of a phylogeographical structure. All ΦST values were also significant (P < 0.001) (respectively 0.91, 0.71 and 0.26) and on the contrary to the two other indices, it indicates (high value of ΦST) a separa-tion between W Europe and the two oriental populasepara-tions (SE and NE Europe). In contrast, ΦST values are low between these two last populations indicating a closer rela-tionship. The amova shows that a moderate percentage (25%) of the total mtDNA variation is distributed among
the three genetic groups whereas a higher value of this variation (48%) is observed among populations within the main lineages. This strongly indicates a weak phylogeo-graphical structure for this species.
Microsatellites
As it was impossible to amplify several microsatellite markers for some specimens, only 155 European minks were used for the microsatellite analyses. Of the 18 microsatellite
Fig. 3 tcs network constructed using mitochondrial control region sequences. The identity of the haplotypes (see Fig. 2) and their geographical origin (see Appendix) are indicated. The open squares between haplotypes correspond to intermediate haplotypes as calculated by the tcs program. The number of intermediate haplotypes between M. lutreola and M. eversmannii being high (12), all of them were not indicated and were replaced by the number 12.
Table 1 Genetic variability observed within the three populations of Mustela lutreola using the mitochondrial control region
Sample size
Number of haplotypes
Genetic divergence within each group (% K2P distance) Nucleotide diversity (π) Standard deviation Haplotype diversity (h) Standard deviation Northeast Europe 18 10 1.5 0.012 0.0014 0.939 0.058 Southeast Europe 34 4 0.3 0.0012 0.0003 0.469 0.088 West Europe 124 1 0 0 / 0 /
2380 J . R . M I C H A U X E T A L .
loci tested, only six were polymorphic, containing up to five alleles (Table 2). One locus displayed an extreme heterozygote deficit in the NE Europe sample, likely due to a null allele, and was therefore removed from our analyses. Of the total of 20 alleles at all five loci, 19 were found in the NE Europe sample (N = 19 individuals), 15 in SE Europe (N = 25), and 13 in W Europe (N = 112). The same trend was found for gene diversity (HE) and allelic richness (RS; Table 3). Permutation tests performed by the fstat software confirm that W Europe has less genetic diversity than NE Europe on the basis of HE (P = 0.021) and RS (P = 0.003), whereas SE Europe lies in between (HE and RS values not statistically different from the ones found in W or NE Europe). The mean values of HE for the European mink are significantly lower than those observed on other aquatic mustelids such as the otter (Lutra lutra) (average of 0.74; Randi et al. 2003) but is of the same order of what is observed in the wolverine (Gulo gulo) (from 0.269 to 0.376; Walker et al. 2001).
The Wilcoxon signed rank tests performed by the bottle-neck software, which test for recent bottlebottle-neck events, were nonsignificant in NE Europe whatever the mutation model assumed, but significant in W and SE Europe using the IAM (Table 2). Under the SMM, the test was near
Fig. 4 Mismatch distribution for mtDNA types from the Russian–Estonian–Belarus and Romanian genetic lineages of Mustela lutreola. The expected frequency is based on population growth-decline (a) or constant (b) models (For the groups, respectively: θ initial = 0.82 and 0.40, θ final = 1000, τ = 5.73 and 0.29), determined using the dnasp 3.5 program (Rozas & Rozas 1997).
Table 2 Allele frequencies at six microsatellite loci within each region sampled Locus Allele (PCR product size) West Europe (N = 112) Southeast Europe (N = 25) Northeast Europe (N = 18) Mvis075 142 0.396 0.920 0.763 144 0.604 0.080 0.237 Mer009 196 0.116 0.120 0.206 202 0.000 0.000 0.265 204 0.000 0.120 0.000 206 0.884 0.380 0.412 208 0.000 0.380 0.118 Mvis72 268 0.000 0.000 0.026 272 0.677 0.860 0.605 274 0.000 0.140 0.263 278 0.323 0.000 0.105 Mer022 243 0.000 0.000 0.194 251 0.005 0.413 0.389 253 0.269 0.239 0.167 255 0.000 0.022 0.222 257 0.726 0.326 0.028 Mer41 159 0.766 0.587 0.861 161 0.220 0.000 0.056 163 0.009 0.391 0.056 165 0.005 0.022 0.028
significant in SE Europe. Hence, there is no conclusive evidence of a past bottleneck event but hints that such an event occurred in SE and possibly W Europe.
Pairwise FST values between geographical groups were all significant (P < 0.001): FST = 0.10 between SE and NE Europe, FST = 0.29 between W. Europe and SE Europe, and FST = 0.26 between W Europe and NE Europe. Hence, the population from W Europe is the most differentiated. The phylogenetic tree (data not shown) constructed on the basis of the microsatellite polymorphism gave a similar result as the western European group (France and Spain) appear separated to the other eastern populations (BP = 75%).
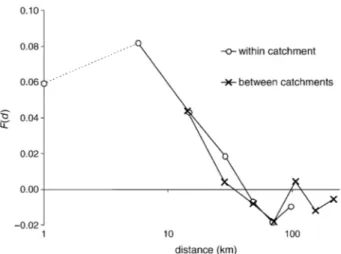
In W Europe, a clear pattern of isolation by distance was observed whereby the kinship coefficients between individuals decrease approximately linearly with the logarithm of the distance up to c. 50 km and then stabilize (Fig. 5). The genetic structure is statistically significant (Mantel test: P = 0.004) and the regression slope of Fij on ln(dij) for distances inferior to 50 km is b = −0.0496. There is no difference between the F(d) curves within and between basins (Fig. 5), indicating that gene flow is not affected by hydrography.
Within geographical groups, statistically significant heterozygote deficit was found at two loci (Mer022: FIS = 0.192, P = 0.006; Mer41: FIS = 0.249, P = 0.012) but not at the three other ones (Mvis075: FIS = 0.020; Mer009: FIS = 0.071; Mvis72: FIS = 0.062). Multilocus FIS values reach 0.084 (SE = 0.062; P = 0.073) in W Europe, 0.085 (SE = 0.0063;
P = 0. 28) in SE Europe, and 0.182 (SE = 0.090; P = 0.033)
in NE Europe. It is worth noting that the FIS in W Europe is close to the mean kinship coefficient between nearby individuals (Fij = 0.08 for distances < 10 km), as expected if mating occurs locally.
Discussion
The phylogeography of European mink
As stated in our previous study (Michaux et al. 2004),
Mustela lutreola shows low mitochondrial DNA sequence
variation and little geographical partitioning of haplotypes (Table 1, Figs 2 and 3). This is consistent with other carnivores, especially mustelids like wolverine (Gulo gulo) (Walker
et al. 2001), European otter (Lutra lutra) (Cassens et al. 2000;
Morales 2002), polecat (Mustela putorius) and pine marten (Martes martes) (Davison et al. 2001), fisher (Martes pennanti) (Drew et al. 2003) as well as wolf (Canis lupus) (Vila et al. 1999). In contrast, other carnivores such as American marten (Martes americana) (Carr & Hick 1997), ermine (Mustela
erminea) (Fleming & Cook 2002) and European (Taberlet et al. 1998) and North American brown bear (Waits et al.
1998) (Ursus arctos) have structured mtDNA phylogenies that correlate with geography. These patterns are probably largely shaped by species differences in the degree of range fragmentation during the last ice age, the level of dispersal following the withdrawal of the glaciers, and the extent of gender-bias in dispersal (Drew et al. 2003).
As proposed in other mustelids like the pine marten (Martes martes) (Davison et al. 2001), a general lack of ancient lineages and a mismatch distribution for the NE group that is consistent with an expanding population, suggests that the present-day M. lutreola colonized Europe from a single refugium following recent glaciation. This is also consistent with the lack of any phylogeographical struc-ture according to the test of NST and amova. As hypo-thesized by Avise (2000) and Hewitt (1996), it is expected that populations living in the southern refugial regions were less affected by climatic changes and should have more genetic variation. In contrast to other mammals, where the southern-most refugial populations have the greatest diversity (Merilae et al. 1997; Michaux et al. 2003, 2004; Hewitt 2004), European mink mtDNA and microsatellite diversities
Table 3 Gene diversity (HE) and allelic richness (RS for a sample of 17 individuals) at five microsatellite loci within each geograph-ical group, and P values of Wilcoxon tests of gene diversity excess (indicative of past bottleneck events) assuming an infinite allele mutation model (IAM) or a stepwise-mutation model (SMM)
West Europe Southeast Europe Northeast Europe
HE 0.379 0.458 0.539
RS 2.12 2.89 3.76
Test IAM 0.031 0.031 0.500
Test SMM 0.594 0.062 0.890
Fig. 5 Relationship between the mean kinship coefficients between individuals of the W European population and the logarithm of the distance separating them. The two curves distinguish pairs of individuals sampled either in the same or in different basins. The symbol on the vertical axis indicates the value found for individuals sampled at the same location.
2382 J . R . M I C H A U X E T A L .
are highest in NE European populations (Russia, Belarus, Estonia). Therefore, the present-day populations of western and southeastern Europe cannot have been the refugial populations. However, as the majority of the southern-central European populations of the mink have become extinct (Youngman 1982; de Bellefroid & Rosoux 1998; de Bellefroid 1999) and as the fossil record for this species is sparse (Davison et al. 2000), particularly in southern Europe, it is impossible to conclude definitively that Mediterranean regions were never a refuge for the European mink during the Pleistocene glaciations.
Nevertheless, the current data (Figs 2 and 3) confirm previous studies on mitochondrial DNA (Davison et al. 2000; Michaux et al. 2004) and indicate that European mink and steppe polecat are closely related. This means that the European mink may have colonized Europe and western Russia relatively recently from an eastern refuge, as has been inferred in other mammal species [root vole (Microtus
oeconomus), Brunhoff et al. 2003].
Demographic history of the European mink populations
The almost complete lack of variation observed in French and Spanish animals strongly indicates that very few indi-viduals established the present-day W European population, possibly following a human introduction. This hypothesis is corroborated by the absence of mink records in France until the first half of the 19th century and in Spain until 1950 (de Bellefroid 1999). As the microsatellite allelic rich-ness of the whole W European population is extremely low, the hypothesis of a leptokurtic dispersal of some long-distance migrants establishing populations in advance of a colonization wave during the Holocene (Ibrahim et al. 1996) becomes a less conceivable explanation for the low diversity. The high FST between this population and the eastern ones probably results from the strong genetic drift undergone by this population, a hypothesis supported by the test of bottleneck event.The SE European population is probably a relict of a more important population which was previously widespread all over central Europe and Ukraine. This would explain the low FST value observed between the NE and SE Euro-pean groups as compared to FST between these popula-tions and the W European one. Moreover, the isolation of the Romanian minks has probably been associated with a genetic bottleneck as indicated by (i) the low microsatellite allelic richness, (ii) the excess of microsatellite HE as compared to the number of alleles (Table 2), and (iii) the few mtDNA haplotypes and low nucleotide diversity as compared to the Russian animals. After the bottleneck, the Romanian population stayed relatively constant as indi-cated by the mismatch distribution analysis (Fig. 4).
The animals from NE Europe are characterized by the highest level of genetic diversity (high number of
mito-chondrial DNA haplotypes and high microsatellite allelic richness), so have not undergone a recent bottleneck. On the contrary, the mismatch distribution analysis suggests a recent population expansion after the last glaciation, which was followed by a historical decline and fragmentation of populations. This would explain why even this NE Euro-pean population is characterized by a lower level of genetic variability as compared to other aquatic Mustelidae such as the European otter Lutra lutra. Indeed, this last species have probably less suffered to historical extinction or frag-mentation of populations (Randi et al. 2003).
Intrapopulational structure of the western European
group
In western Europe, the genetic structure of European mink shows isolation-by-distance pattern up to c. 50 km. Beyond, the relatedness between individuals does not decrease any more with distance. It is congruent with field observations made in Russia, Belarus and Spain which indicate that European mink are very sedentary, rarely leaving the rivers where they were born (Maran & Ceña, personal commun-ication). However, in SW France, radio-tracking experiments showed that two males displayed a nomadic behaviour, leaving their home range, crossing the limits of ‘their’ catchment and moving on a distance of more than 40 km (Fournier, unpublished). This unusual behaviour is probably the consequence of a very low population density (Camby 1990) involving the absence of any female and forcing the males to look for mates along other hydrographic systems. Therefore, we think this behaviour is not a peculiar adaptation of the French mink population but is more the consequence of an individual mating tactic adopted when demographic densities are very low.
Moreover, our study evidenced that relatedness between French individuals was not affected by the pattern of basins, indicating that French European mink does not preferentially disperse along streams and rivers, at least for reproductive purposes. This is in contrast to what it is observed in Russia, Belarus and Spain (when densities are high). Again, this would be interpreted as the result of low mink densities in France, forcing them to disperse a lot for reproduction, not only along the rivers, but also between drainage basins.
The deficit of heterozygotes observed in W Europe is consistent with the isolation-by-distance pattern as the FIS, which is expected to equal the kinship coefficient between mates, is similar to the kinship coefficient between nearby individuals. Heterozygote deficit can thus be explained by limited dispersal capabilities causing related individuals to mate. Nevertheless, it cannot be excluded that null alle-les also contribute to an apparent heterozygote deficit in some loci. If we assume that the pattern of isolation by dis-tance is at drift–dispersal equilibrium for disdis-tances less
than 50 km, the neighbourhood size (Nb) can be estimated from b, the regression slope of Fij on ln(dij): Nb = [F(1) − 1]/
b = 18, where F(1) is the mean kinship coefficient between
neighbouring individuals (Vekemans & Hardy 2004). Nb estimates the quantity 4πDσ2, where D is the effective population density and σ2 is half the mean squared parent– offspring dispersal distances. Hence, intergeneration dis-persal distances could be estimated by assessing population density, but this is currently an unknown parameter. Never-theless, Nb also provides an order of magnitude of the number of potential mates (i.e. within reach) per individual.
Implications for the conservation of European mink
The main conservation issue is whether mink populations with very restricted genetic diversity could survive for a long period of time. Several recent studies on other wild mammals [moose (Alces alces): Ellegren et al. 1993, 1996; European beaver (Castor fibre): Mikko & Anderson 1995; San Nicolas Island fox (Urocyon littoralis dickeyi): Aguilaret al. 2004] have demonstrated that a conservation
pro-gramme, or the survival of a species, can be successful despite low levels of genetic variation in the founder population. While the short-term chance of survival may mainly depend on environmental pressures (diseases, destruction of habitats), long-term survival may be more dependent upon genetic variability especially that found at disease resistance loci (Aguilar et al. 2004). This was confirmed recently by Spielman et al. (2004) which demonstrated that threatened species presenting a lower genetic diversity have higher extinction risks than species characterized by a high genetic variability. Therefore, as the European mink is presently suffering severe environmental pressures (destruction or pollution of aquatic habitats, etc.) and introduced Aleutian disease (Fournier-Chambrillon et al. 2004), the best chance to save this species in the long term will be to maximize genetic variability, particularly in the captive breeding/reintroduction programmes that are pre-sently underway as well as to continue developing habitat conservation and restoration measures.
Avise (2000) defined the concept of a management unit as ‘any population that exchanges so few migrants with others as to be genetically distinct from them normally will be demographically independent at the present time’. In this way, he noted that ‘even shallow matrilineal subdivi-sions can be relevant to conservation efforts’.
However, the value of this concept as well as others like the ESU (evolutionary significant unit, Ryder 1986) was strongly debated these last years and are often difficult to define (Fraser & Bernatchez 2001) and to apply in practice (Moritz 1994). Moreover, other authors (Crandall et al. 2000) disagree about the new interpretation of these con-cepts which are often based exclusively on molecular data not taking ecological information into account. However,
this is also extremely important to recognize specific adaptation to local environment and to avoid problems of outbreeding depression in the case of translocation or reintroduction programmes (Drew et al. 2003).
For this reason, we preferred to use the concept of ‘dis-tinct population segments’ (DPS) proposed by the US Fish and Wildlife Service and National Marine Fisheries Ser-vices (1996) which appears more relevant. Indeed, to be considered as a DPS, a population must be (i) discrete and (ii) biologically and ecologically significant. Discrete popu-lations are geographically isolated from other ones by physical, physiological, ecological or behavioural factors. Biological and ecological significance is determined by a variety of potential factors including the fact that a popu-lation occurs in a unique or unusual ecological setting, its loss would result in a significant gap in the range of the species, or it differs markedly from other populations in its genetic characteristics (US Fish and Wildlife Service & National Marine Fisheries Services, 1996).
As they are geographically well isolated, our mink popu-lations are discrete. Concerning the biological significance, on the genetic point of view, certainly, specific mitochon-drial haplotypes are found in the three main European mink populations, with a single haplotypes characterizing the French and Spanish animals. This involves a high ΦST value between western and eastern groups. Moreover, the microsatellite analysis showed high differentiation between the W European population and the NE, also indicating weak gene flow between them. This would tend to define them as different genetically distinct groups. However, the same microsatellite alleles are found within all three main genetic groups (W, SE and NE Europe), the amova showed that a moderate percentage (25%) of the total mtDNA var-iation was distributed among them, the test of NST indi-cates a lack of any phylogeographical structure between them and the SW European haplotype is only different from several eastern ones by a single nucleotide out of 731. This indicates that these mink groups are closely related and that their particular genetic patterns are probably the result of a recent fragmentation of a more widespread population. Thus, the genetic differentiation between western and eastern populations is rather explained by a founder effect.
From an ecological point of view, it seems impossible to find any particular ecological adaptation separating the three European populations from each other. Indeed, in Spain, the mink can live either in (sub)Mediterranean hab-itats or in rainy mountain forests with strong climatic con-ditions, similar to those found in Russia (heavy rainfall and long frost periods). In France, it still lives or was present in temperate humid habitats (rivers or marshes), just like in the Romanian Danube delta.
As far as the dispersal pattern is concerned, our results indicate that the differences observed between or within
2384 J . R . M I C H A U X E T A L .
populations are more related to differences in the popula-tion densities rather than to specific adaptapopula-tions associated to particular environmental conditions.
Therefore, as the three European mink populations (SW, SE and NE Europe) are discrete but do not seem to be biologically significantly isolated, we think that it is difficult to consider them as specific ‘distinct population segments’. They rather correspond to a single population which was recently fragmented.
In conclusion, as already proposed for other threatened species such as the fisher (Martes pennanti) (Drew et al. 2003), the Mariana crow (Corvus kubaryi) (Tarr & Fleischer 1999) or the Eld’s deer (Cervus eldi) (Balakrishnan et al. 2003), an interesting way to preserve the European mink in the long term should be to increase the genetic variability of impov-erished populations and to avoid any kind of depression. However, following the caution principle, it seems import-ant to have more reliable information on the behaviour and the ecology of the different populations to confirm definitively this lack of biologically significant separation. Otherwise, eastern animals, safe from the Aleutian dis-ease (e.g. the Romanian ones), could be used to reinforce the western population and released into the wild in France or in Spain. This cannot preclude a risk of outbreeding depression. Another way of proceeding should be to initi-ate a captive breeding programme with individuals from the western population and to release the offspring into areas formerly inhabited by the species but this does not offer any solution to the problem of the very low genetic variability.
Hence, we suggest to breed together western and eastern animals, namely those from the NE population because they are the more genetically diverse. The offspring should be reintroduced into regions of France formerly occupied by the western population and devoid of the American mink (Mustela vison). Should the reintroduced minks thrive, then the risk of outbreeding depression could be dismissed and it may be assumed that these ‘mixed’ minks could pro-gressively reach the areas where western minks are still present. However, before any project of mink reintroduc-tion in the wild, a more precise identificareintroduc-tion of the real causes at the base of the dramatic decline of the species seems of cardinal importance.
Acknowledegments
We thank two anonymous referees for their helpful corrections to the manuscript.
We thank the European Mink Restoration Programme (DIREN Aquitaine) and the Natural History Museum of La Rochelle for their help in funding this study. French tissue samples were pro-vided by the Natural History Museum of La Rochelle as well as the French ‘European mink network’ composed of Association Curuma; A.I. 17; Associations Départementales des Piégeurs Agréés; Asso-ciation pour la Connaissance de la Vie Fluviale; ADEV; AGERAD;
AGRP 17; Pro Lutra; Centre de la Trave; CFPPA de Coulounieix-Chamiers; CPIE de Saint-Martin-de-Seignanx et de Sireuil; Charente Nature; Cistude Nature; Communauté de communes de Haute-Saintonge; Conseils Généraux 24, 32, 33 et 40; CAUE 24; CSP; Conservatoires Régionaux des Espaces Naturels d’Aquitaine et de Poitou-Charentes; DDAF 64; Epidor; Erminea; Fédérations Départementales des Chasseurs; FDGDON 16, 24, et 33; Groupes Mammalogiques Breton et Normand; SPN/IEGB; INRA; IRGM; LPO; LEGTA de Bazas; MIFEN; Mairie de Biscarosse; Marais aux oiseaux; Muséum d’Histoire Naturelle de la Rochelle; Nature Environnement 17; Observatoire du Patrimoine Naturel des Pyrénées Atlantiques; ONCFS — Services Départementaux et Direction de la Recherche; Orgambidexka Col Libre; Parc National des Pyrénées; Parcs Naturels Régionaux; Réserves Naturelles; SFEPM; Société des Sciences Naturelles de la Charente-Maritime (M.N. de Bellefroid); SEPANSO; SEPANLOG; Syndicats d’Aménage-ment du Centre Médoc, de l’Avance, de la Livenne, de la Tude, de la Jalle de Castelnau, ‘Jalle Rivière Propre’, du Pays des cantons de Ribérac-Verteillac-Montagrier, de l’Isle, de la Dordogne.
Other tissue samples were provided by Dr Ales Toman (Pavlov Biological Station, Czech Republic) Ms C. de la Panouse (Zoolo-gical park of Thoiry (F-77), Dr T. Maran (Tallin Zoo). Romanian samples were collected within the EU financed DELWET Centre of Excellence Project of the Danube Delta National Institute in Tulcea. Spanish samples were provided by Iñaki Irizar, Idoia Villate and Gomez Molines, Jorge González-Esteban, Juan Carlos Ceña, Alfonso Ceña, Ivan Moya, and Santiago Palazón Miñano. This conservation genetics project would not have been possible without their valuable assistance. This work was supported by a Belgian FNRS fellowship to J.R. Michaux (mandat ‘Chargé de Recherches’), and financial support of the University of Liège (Fonds spéciaux de recherche 2000–02).
References
Aguilar A, Roemer G, Debenham S, Binns M, Garcelon D, Wayne E (2004) High MHC diversity maintained by balancing selection in an otherwise genetically monomorphic mammal. Proceedings of the National Academy of Sciences, USA, 101, 3490–3494. Anonymous (1999) Plan de restauration du vison d’Europe en France.
Ministère de l’Aménagement du Territoire et de l’Environnement, Paris, p. 57.
Avise JC (2000) Phylogeography: The History and Formation of Species. Harvard University Press, Cambridge, Massachusetts. Baillie N, Groombridge C (1996) 1996 IUCN Red List of Threatened
Animals. International Union for Conservation of Nature and Natural Resources, Gland, Switzerland.
Balakrishnan CN, Monfort SL, Gaur A, Singh L, Sorenson MD (2003) Phylogeography and conservation genetics of Eld’s deer (Cervus eldi). Molecular Ecology, 12, 1–10.
de Bellefroid MN (1999) Étude biogéographique de l’évolution de la population de vison européen, Mustela lutreola, en France. PhD Thesis, University of Rennes.
de Bellefroid MN, Rosoux R (1998) Le ‘vison du Poitou’, un hôte des zones humides menacé dans le Centre-Ouest atlantique. Annales Société Sciences Naturelles Charerite-Maritime, 8, 865– 879.
Brunhoff C, Galbreath KE, Fedorov VB, Cook JA, Jaarola M (2003) Holarctic phylogeography of the root vole (Microtus oeconomus): implications for late Quaternary biogeography of high latitudes. Molecular Ecology, 12, 957–968.
Burban C, Petit RJ, Carcreff E, Jactel H (1999) Rangewide variation of the marine pine bast scale Matsucoccus Teytoudi Duc. (Homoptera: Matsuccidae) in relation to the genetic structure of its host. Molecular Ecology, 8, 1593–1602.
Camby A (1990) Le Vison d’Europe (Mustela lutreola (Linnaeus, 1761)). Encyclopédie des Carnivores de France, no. 13. Société française pour l’Etude et la Protection des Mammifères, Nort-sur-Erdre. Carr SM, Hick SA (1997) Are there two species of martin in North America? Genetic and evolutionary relationships within Martes. In: Martes, Taxonomys, Ecology, Techniques and Management (eds Proulx G, Bryant HN, Woodard PM), pp. 15–28. Provincial Museum of Alberta, Edmonton, Alberta.
Cassens I, Tiedemann R, Suchentrunk F, Hartl GB (2000) Mitochondrial DNA variation in the European otter (Lutra lutra) and the use of spatial autocorrelation analysis in conservation. Journal of Heredity, 91, 31–35.
Cavalli-Sforza LL, Edwards AWF (1967) Phylogenetic analysis: models and estimation procedures. American Journal of Human Genetics, 19, 233–257.
Clement M, Posada D, Crandall KA (2000) tcs: a computer program to estimate gene genealogies. Molecular Ecology, 9, 1657–1659. Cornuet JM, Luikart G (1996) Description and power analysis of
two tests for detecting recent population bottlenecks from allele frequency data. Genetics, 144, 2001–2014.
Crandall KA, Bininda-Edmonds ORP, Mace GM, Wayne RK (2000) Considering evolutionary processes in conservation biology. Trends in Ecology & Evolution, 15, 290–295.
Davis CS, Strobeck C (1998) Isolation, variability, and cross-species amplification of polymorphic microsatellite loci in the family Mustelidae. Molecular Ecology, 7, 1776–1778.
Davison A, Birks JD, Brookes RC, Messenger JE, Griffiths HI (2001) Mitochondrial phylogeography and population history of pine martens Martes martes compared with polecats Mustela putorius. Molecular Ecology, 10, 2479–2488.
Davison A, Griffiths HI, Brookes RC et al. (2000) Mitochondrial DNA and palaeontological evidence for the origins of the endan-gered European mink, Mustela lutreola. Animal Conservation, 3, 345–355.
Drew RE, Hallett JG, Aubry KB, Cullings KW, Koepf SM, Zielinski WJ (2003) Conservation genetics of the fisher (Martes pennanti) based on mitochondrial DNA sequencing. Molecular Ecology, 12, 51–62.
Ellegren H, Hartman G, Johansson M, Andersson L (1993) Major histocompatibility complex monomorphism and low levels of DNA fingerprinting variability in a reintroduced and rapidly expanding population of beavers. Proceedings of the National Academy of Sciences, USA, 90, 8150–8153.
Ellegren H, Mikko S, Wallin K, Andersson L (1996) Limited poly-morphism at major histocompatibility complex (MHC) loci in the Swedish moose A. alces. Molecular Ecology, 5, 3–9.
Fitch WM (1971) Towards defining the course of evolution: Minimum change for a specific tree topology. Systematic Zoology, 20, 406–416.
Fleming MA, J.Cook (2002) Phylogeography of endemic ermine (Mustela erminea) in southeast Alaska. Molecular Ecology, 11, 795–807.
Fleming MA, Ostrander EA, Cook JA (1999) Microsatellite markers for American mink (Mustela vison) and ermine (Mustela erminea). Molecular Ecology, 8, 1351–1352.
Fournier-Chambrillon C, Aasted B, Perrot A et al. (2004) Antibodies to Aleutian mink disease parvovirus in free-ranging European
mink (Mustela lutreola) and other small carnivores from south-western France. Journal of Wildlife Diseases, 40, in press. Fraser DJ, Bernatchez L (2001) Adaptive evolutionary
conserva-tion: towards a unified concept for defining conservation units. Molecular Ecology, 10, 2741–2752.
Gascuel O (1997) bionj: an improved version of the NJ algorithm based on a simple model sequence of data. Molecular Biology and Evolution, 14, 685–695.
Gotea V, Kranz A (1999) The European mink (Mustela lutreola) in the Danube delta. Small Carnivore Conservation, 21, 23–25. Goudet J (1995) fstat version 1.2: a computer program to calculate
F-statistics. Journal of Heredity, 86, 485–486.
Hardy OJ, Vekemans X (2002) spagedi: a versatile computer pro-gram to analyse spatial genetic structure at the individual or population levels. Molecular Ecology Notes, 2, 618–620. Hewitt GM (1996) Some genetic consequences of ice ages and their
role in divergence and speciation. Biological Journal of the Linnean Society of, 58, 247–276.
Hewitt GM (2004) Genetic consequences of climatic oscillations in the Quaternary. Philosophical Transactions of the Royal Society of London. Series B, Biological Sciences, 359, 183–195.
Huelsenbeck JP, Ronquist F, Nielsen R, Bollback JP (2001) Bayesian inference of phylogeny and its impact on evolutionary biology. Science, 294, 2310–2314.
Ibrahim KM, Nichols RA, Hewitt GM (1996) Spatial patterns of genetic variation generated by different forms of dispersal during range expansion. Heredity, 77, 282–291.
Loiselle BA, Sork VL, Nason J, Graham C (1995) Spatial genetic structure of a tropical understorey shrub, Psychotria officinalis (Rubiaceae). American Journal of Botany, 82, 1420–1425. Lynch M (1991) The genetic interpretation of inbreeding
depres-sion and outbreeding depresdepres-sion. Evolution, 45, 622–629. Maizeret C, Migot P, Rosoux R et al. (2002) The distribution of the
European mink (Mustela lutreola) in France: towards a short term extinction? Mammalia, 66, 525–532.
Maran T (1992) The European mink, Mustela lutreola, in protected areas in the former Soviet Union. Small Carnivore Conservation, 7, 10–12.
Merilae J, Bjoerklund M, Baker AJ (1997) Historical demography and present day population structure of the greenfinch, Carduelis chloris. An analysis of mtDNA control-region sequences. Evolu-tion, 51, 946–956.
Michaux JR, Magnanou E, Paradis E, Nieberding C, Libois RM (2003) Mitochondrial phylogeography of the woodmouse (Apodemus sylvaticus) in the western Palearctic region. Molecular Ecology, 12, 685–697.
Michaux JR, Filippucci MG, Libois R (2004a) Phylogeographic history of the yellow-necked fieldmouse (Apodemus flavicollis) in Europe and in the Near and Middle East. Molecular Phylogenetics and Evolution, 32, 788–798.
Michaux JR, Libois RM, Davison A, Rosoux R (2004b) Are French and Spanish European mink, Mustela lutreola, a distinct manage-ment unit for conservation? Biological Conservation, 115, 357–367. Mikko S, Andersson L (1995) Low major histocompatibility complex class II diversity in European and North American moose. Pro-ceedings of the National Academy of Sciences, USA, 92, 4259–4263. Morales CF (2002) Phylogéographie de la loutre d’Europe (Lutra lutra) dans la partie occidentale de son aire de répartition. DES Sciences Pays en Développement Thesis, University of Liège.
Moritz C (1994) Applications of mitochondrial DNA analysis in conservation: a critical review. Molecular Ecology, 3, 401–411.
2386 J . R . M I C H A U X E T A L .
Philippe H (1993) must, a computer package for management utilities for sequences and trees. Nucleic Acids Research, 21, 5264–5272.
Pons O, Petit RJ (1996) Measuring and testing genetic differenti-ation with ordered versus unordered alleles. Genetics, 144, 1237–1245.
Posada D, Crandall A (1998) modeltest: testing then model of DNA substitution. Bioinformatics, 14, 817–818.
Randi E, Davoli F, Pierpaoli M, Pertoldi C, Madsen AB, Loeschke V (2003) Genetic structure in otter (Lutra lutra) populations in Europe: implications for conservation. Animal Conservation, 6, 1–10.
Rozas J, Rozas R (1997) dnasp, version 2.0: a novel software package for extensive molecular population genetic analysis. Computer Application in the Biosciences, 13, 307–311.
Ruiz-Olmo J, Palazón S (1991) New information on the European and American mink in the Iberian Peninsula. Mustelid Viverrid Conservation, 5, 13.
Ryder OA (1986) Species conservation and systematics: the dilemma of subspecies. Trends in Ecology and Evolution, 1, 9–10.
Saitou N, Nei M (1987) The neighbor-joining method: a new method for reconstructing phylogenetic trees. Molecular Biology and Evolution, 4, 406–425.
Sambrook J, Fritsch EF, Maniatis T (1989) Molecular Cloning: A Laboratory Manual. Cold Spring Harbor Laboratory, Cold Spring Harbor, New York.
Schneider S, Roessli D, Excoffier L (2000) ARLEQUIN: a software for population genetic data analysis version 2.0. Genetics and Biometry Laboratory. University of Geneva, Switzerland.
Sidorovich VE (2000) The ongoing decline of riparian mustelids (European mink, Mustela lutreola, polecat, Mustela putorius and stoat, Mustela erminea) in eastern Europe: a review of the results to date and a hypothesis. In: The Mustelids in a Modern World Management and Conservation Aspects of Small Carnivore: Human Interactions (ed. Griffiths HI), pp. 295–317. Backhuys Press, Leiden. Spielman D, Brook BW, Frankham R (2004) Most species are not driven to extinction before genetic factors impact them. Proceedings of the National Academy of Sciences, USA, 101, 15261– 15264.
Swofford DL (1998) PAUP*. Phylogenetic Analysis Using Parsimony (*and
Other Methods), Version 4 0b. Sinauer Associates, Sunderland, Massachusetts.
Taberlet P, Fumagalli L, Wust-Saucy AG, Cosson JF (1998) Comparative phylogeography and postglacial colonization routes in Europe. Molecular Ecology, 7, 453–464.
Tarr CL, Fleischer RC (1999) Population boundaries and genetic diversity in the endangered Mariana crow (Corvus kubaryi). Molecular Ecology, 8, 941–949.
Tumanov IL (1992) The number of European mink (Mustela lutre-ola) in the eastern area and its relation to American mink. In: Semi-Aquatische Saügetiere Materialen Des 2 Internat Symposium
(eds Schröpfer R et al.), pp. 329–336, Martin Lüther Universität, Halle-Wittenberg.
US Fish and Wildlife Service and National Fisheries Service (1996) Policy regarding the recognition of distinct vertebrate population segments under the Endangered Species. Act Federal Register, 61, 4721–4725.
Van Bree PJH, Saint Girons MC (1966) Données sur la répartition et la taxonomie de Mustela lutreola (Linnaeus, 1761) en France. Mammalia, 30, 270–291.
Vekemans X, Hardy OJ (2004) New insights from fine-scale spatial genetic structure analyses in plant populations. Molecular Ecology, in press.
Vila C, Amorim IR, Leonard JA et al. (1999) Mitochondrial DNA phylogeography and population history of the grey wolf Canis lupus. Molecular Ecology, 8, 2089–2103.
Waits LP, Talbot S, Ward RH, Shields GF (1998) Mitochondrial DNA phylogeography of the North American brown bear and implications for conservation. Conservation Biology, 12, 408–417. Walker WK, Vila C, Landa A, Linden M, Ellegren H (2001) Genetic variation and population structure in Scandinavian wolverine (Gulo gulo) populations. Molecular Ecology, 10, 53–63.
Weir BS, Cockerham CC (1984) Estimating F-statistics for the analysis of population structure. Evolution, 38, 1358–1370. Wright S (1992) Coefficients of inbreeding and relationships.
American Naturalist, 56, 330–338.
Yang Z (1996) Among-site rate variation and its impact on phylo-genetic analyses. Trends Ecology & Evolution, 11, 367–372. Yang Z, Rannala B (1997) Bayesian phylogenetic inference using
DNA sequences: a Markov chain Montecarlo method. Molecular Biology and Evolution, 14, 717–724.
Youngman PM (1982) Distribution and systematics of the Euro-pean mink, Mustela lutreola. Acta Zoologica Fennica, 166, 1–48.
Johan Michaux is a Researcher Associate at ULg and notably studies the phylogenetic and phylogeography of various common and threatened European mammal species. Roland Libios is a Professor Associate at ULg and has notably been conducting ecological researches on European rodents for nearly three decades. Oliver Hardy is a Researcher Associate at the University of Brussels and is working in theoretical population genetics as well as community ecology of plants. Fabienne Justy is a Technician at the University of Montpellier and is specialised in microsatellite analyses. Pascal Fournier, Andreas Kranz and René Rosoux are ecologists and have been working for a long time on threatened Mustelidae. Maite Cabria is a PhD student working on the con-servation genetics of different European mammal species. Finally, Angus Davison is a recently appointed lecturer in genetics, whose primary research interest is the population genetics of mink and molluses’.
Appendix
Geographic distribution and references of Mustela tissues used for the experiments
Geographic origin Total no. of animals Sample symbols (see Figs 1, 2 and 3) Tissue sample
numbers or GenBank access (for sequenced samples)
Mustela lutreola
France Aillas ou Braud et St louis 2 F1 MLU 18 LA, MLU 09 GI
Ambleville 3 F2 MLU16 gi, MLU 55 HP, MLU16hp
Audenge 2 F3 MLU HP 39, MLU HP 52
Bagas 1 F4 MLU 015 La
Balizac 2 F5 MLU 007 GI, MLU 07 CHA
Bazac 1 F6 MLU 018 GI
Bégaar 1 F7 MLU 014 GI
Belin Beliet 2 F8 MLU HP 56, MLU 003 GI
Bellefond 1 F9 MLU 020 GI
Bernos-Beaulac 1 F10 MLU 001 DO
Blanquefort (Jalles 1 F11 MLU 001 ORX
de blanquefort)
Blaye 1 F12 MLU 002 D
Bruges 3 F13 MLU 011 ORX, MLU P256, MLU 004 ORX
Bruges (Jalles de 2 F14 MLU 003 C, MLU 004 D
Blanquefort)
Camiran 1 F15 MLU 001 D
Crazannes 1 F16 MLU NERC 2
Criteuil la Magdeleine 1 F17 MLU 005 ORX
Cubzac les Ponts 1 F18 MLU 012 ORX
Cursan 1 F19 MLU 010 C
Gastes 1 F20 MLU 005 C
Guiche 2 F21 MLU 002 ORX, MLU 014 C
Hontanx 5 F22 MLU 011 C, MLU 010 ORX, MLU 002 ENG,
MLU 001 C, MLU 02 LG
La Clisse 1 F23 MLU 001 Pa
Labenne 4 F24 MLU 010 LA, MLU 009 LA, MLU 017 GI, MLU 017 LA
Lachaise 3 F25 MLU 002 GI, MLU 005 GI, MLU P238
Landerroute sur Ségur 1 F26 MLU 009 CHA
Léon 4 F27 MLU 007 LA, MLU 010 GI, MLU 004 LA, MLU P237
Les Billaux 1 F28 MLU P237
Lugos 1 F29 MLU 011 GI
Mezos 1 F30 MLU 024 LA
Moliet et Maa 3 F31 MLU 022 LA, MLU 021 LA, MLU 004 NERC
Montpon-Ménestérol 1 F32 MLU 019 LA
Morizes 1 F33 MLU 020 LA
Nercillac 2 F34 MLU 023 LA, MLU 021 GI
Neuffons 1 F35 MLU 016 LA
Onard 1 F36 MLU 008 LA
Orx 2 F37 MLU 012 LA, MLU 003 E
Parantis en Born 1 F38 MLU 005 D
Parempuyre 1 F39 MLU 005 LA
Perissac 1 F40 MLU 006 LA
Pey 2 F41 MLU 003 LA, MLU 012 GI
Pont de Martrou 2 F42 MLU 008 GI, MLU 029 LA
Pujo le Plan 1 F43 MLU 030 LA
Puymiclan 1 F44 MLU 013 LA
Roquebrune 1 F45 MLU 002 PA
Saillans 2 F46 MLU P236, MLU 003 LG
Sanguinet 1 F47 MLU 001 LA
St André de Seignanx 1 F48 MLU 002 DO
St Etienne d’Orthes 1 F49 MLU 001 GE
St Gein 2 F50 MLU 015GI, MLU 014 LA
St Laurent des Hommes 1 F51 MLU 002 LA
2388 J . R . M I C H A U X E T A L .
St Leger de Balson 3 F53 MLU 004 GI, MLU 019 GI, MLU 008 CHA
St Louis de Montferrand 2 F54 MLU 028 LA, MLU 025 LA
St Martial sur Né 2 F55 MLU 001 G1, MLU 006 C
St Martin de Seignanx 1 F56 MLU 3
St Médard d′Eyrans 1 F57 MLU 02 05 00
St Médard en Jalles 1 F58 MLU E
St Paul en Born 1 F59 MLU VM8
St Vincent de Paul 1 F60 MLU C
Ste Eulalie en Born 1 F61 MLU 004 C
Ste Gemme 1 F62 MLU 060400
Tartas 1 F63 MLU VF5
Tizac de Lapouyade 1 F64 MLU VM6
Tocanne St Apre 1 F65 MLU VF7
Uzeste 2 F66 MLU D, MLU VF4
Vendays-Montalivet 1 F67 MLU 001 Cm
Vensac 1 F68 MLU 003 CHA
Vielle st Girons 2 F69 MLU 004 CHA, MLU 005 CHA
Villandraut 2 F70 MLU 006 CHA, MLU 003 DROPT
Villefranque 1 F71 MLU004 ORX
Villeton 1 F72 MLU V1 (= mluv1montp)
Spain La Rioja 2 Sp1 Mulp 55, Mulp 56
Navarra 1 Sp2 Mulp 50
Gipuzkoa 1 Sp3 AF207725
Najerilla river; La Rioja 1 Sp4 Uruñuela
Ebro river; Álava 1 Sp5 Tequila
Ayuda river; Burgos 1 Sp6 Becaria
Aragon river; Navarra 1 Sp7 ML14
Alhama river; Navarra 1 Sp8 ML13
Ebro river; La Rioja 1 Sp9 ML140
Ebro river; Burgos 1 Sp10 ML141
Oca river; Burgos 1 Sp11 Trini
Muxika locality; Bizkaia 1 Sp12 Muxica1
Ebro river; La Rioja 1 Sp13 Arrinconado
Bidasoa river; Navarra 1 Sp14 Navarra3ML041E
Romania Danube delta 34 Ro1 JRM-698, JRM-699, 2, 11, 20, 28, 42, 44, 45, 48, 51, 54, 56, 58, 59, 63, 64, 65, 68, 71, 73, 75, 77, 81, 82, 83, 90, 93, 94, 99, 102, 107, 111, 153
Estonia Tallin 2 Es1 JRM-659, JRM-660
Unknown locality 1 Es AF207723
Bielorussia Vitebsk 2 Bi1 Mulu 3, AF207724
Russia Pskov 2 Ru1 Mulp 6, Mulp 7
Tver 11 Rus2 AF207720, Mulp 8 to Mulp 13, 811, 1011, 1111, 1025
Mustela putorius
Spain La Rioja 1 Sp1 AF207726
Gipuzkoa 1 Sp3 Mulp 53
Portugal Unkown locality 1 MPU 27
Estonia Unknown locality 2 Mulp 2, Mulp 3
Russia Unknown locality 1 Mulp 41
Tver 1 Rus2 Mulp 35
? 1 AF207717
? 1 AF207718
? 1 AF068570
Mustela eversmannii
Mongolia E. Inner 1 M. Evers. 1
Serbia Northwest region 1 M. Evers. 2
Mustela nigripes
USA Unknown locality 2 M. nigripes 1 and 2
Geographic origin Total no. of animals Sample symbols (see Figs 1, 2 and 3) Tissue sample
numbers or GenBank access (for sequenced samples) Appendix Continued