2567, Page 1
Designing and testing an air-PCM heat exchanger for building ventilation application
coupled to energy storage
Bertrand DECHESNE
1*
, Samuel GENDEBIEN
1, Jonathan MARTENS
2, Jacques GILBERT³, Vincent
LEMORT
11
University of Liège, Aerospace and Mechanical Engineering Department, Thermodynamics Laboratory,
Chemin des chevreuils 7, Sart Tilman, 4000 Liège, Belgium
Phone: +32 4 366 48 23, e-mail:
bdechesne@ulg.ac.be
2
Greencom development s.c.r.l,
Rue Gilles Magnee 92/3, 4430 Ans, Belgium
Phone: +32 4 277 93 60, Fax: +32 4 277 93 68, e-mail:
jonathan.martens@airria.be
3
DuPont de Nemours (Luxembourg) S.à r.l.,
Rue Général Patton, L-2984, Luxembourg
R.C.S. Luxembourg B 9529
e-mail:
Jacques.Gilbert@dupont.com
* Corresponding Author:
Phone: +32 4 366 48 23, e-mail:
bdechesne@ulg.ac.be
ABSTRACT
This paper studies a PCM heat exchanger coupled to a building ventilation system. This PCM module can either store heat during the day (e.g. by cooling solar PV panels) and restore it to the building during the night for space heating purposes or store coolness during the night and give it back during the day and thus act as a free cooling system. This project aims to develop a performing air-PCM heat exchanger providing latent energy storage of 0.5 kWh, this energy is delivered between 15 and 30°C. This heat exchanger is based on corrugated cells that can be easily filled, lined up and then locked in a box, letting the air pass between the cells. The PCM used for the prototype is composed of fatty acids. In order to develop an efficient PCM ventilation module, two different ways of investigation were followed and used in parallel. The first one used CFD simulations and the second one, a semi-empirical model based on correlations. The CFD simulations were able to predict the convection coefficient on the air side and also show the flow repartition between the different channels whereas the semi-empirical model allowed a parametrical study in order to identify the best geometry possible. Once the heat exchanger geometry was optimized, a test bench was built and a prototype of air-PCM heat exchanger was manufactured in order to measure its thermal and hydraulic performances. The tests consist in either a complete solidification or liquefaction of the PCM starting from respectively liquid PCM at 30°C or solid PCM at 15°C. The airflow rate was set to 45m³/h, which corresponds barely to the ventilation rate of a traditional room in a residential building. A comparison between the models and the measurements was carried out in order to calibrate the semi-empirical model. It will be shown that a simple semi-empirical model satisfactorily predicts the evolution of heat transfer rate for different operating conditions.
1. INTRODUCTION
Due to the increase of energy costs, buildings energy consumption has tended to decrease in the past decades. This gives an opportunity for developing innovative renewable technologies that are more adapted to recent buildings with low energy demand. In this context, one main challenge is to manage non-simultaneous availability of heat source or sink and the energy demand of buildings. Hence, different technologies dedicated to energy storage have been
2567, Page 2
developed recently; one of them is the use of Phase Change Materials (PCM). These materials are considered because they exhibit a higher heat storage capacity than sensible storages and a tunable phase change temperature according to their composition.PCM are used in many applications, for instance, Campos-Celador et al. (2014) designed a finned plate PCM energy storage for domestic application using RT60 and water. They developed and validated a mathematical model to cover the simulations of the system. They finally compared their prototype with a conventional 500 l hot water tank and concluded that the PCM storage can allow a volume reduction of more than 50% which leads to lower heat losses at the same time. The present paper focus only on air-PCM heat exchanger.
In the last decades, many researchers studied this type of heat exchanger. Ten years ago, Zalba et al. (2004) studied an air-PCM heat exchanger for free-cooling application. They determined the thermophysical properties of two different PCM and developed an empirical model. They showed that this kind of system is technically feasible and economically advantageous.
de Gracia et al. (2013) also developed a new correlation to determine the heat transfer coefficient for a PCM plate. This correlation showed better agreements with their CFD results than other correlations from literature. Kuznik et al. (2008) investigated a wallboard composed of a new PCM material to enhance the thermal behavior of a lightweight internal partition wall. They focused on the phase change material thickness and showed that an optimal thickness exists.
In his Ph.D. thesis, Borderon (2012) investigated the integration of PCM as a dynamic regulation system in thermal retrofitting of buildings. He evaluated the potential integration of air-PCM heat exchangers in French climates. After developing a prototype, he used the experimental data to calibrate a bidimensional MatLab model. The validated model was then coupled to a house model to simulate and assess the behavior of the air-PCM system.
More recently, Steinmaurer et al. (2014) presented two possibilities of measuring the enthalpy of PCM storage systems. The first method uses the volumetric change of PCM during the solid to liquid transition phase whereas the second method uses different damping properties of solid and liquid materials. In the frame of this paper, a method to determine PCM properties is not proposed as they are already specified by the manufacturer and considered as an input for the semi-empirical model.
In the present paper, a novel heat exchanger design is tested in order to obtain a PCM module capable of providing heating or cooling power to a standard residential room. A simple semi-empirical model is developed and validated with the intention of predicting the exhaust air temperature and the power provided by the module.
Figure 1: Tested PCM Module
2. MODELING
This section describes how a simple semi-empirical model was developed in order to match the experimental results.
2.1 PCM Properties
A fatty acid based PCM was chosen for this application. The advantages of this type of PCM are its price, an excellent stability regarding the thermal cycling and that they are chemically inert and stable. On the other hand, they exhibit a
2567, Page 3
moderate thermal storage densities, a quite narrow range of melting temperatures (compared to paraffins) and a low thermal conductivity, which restrict the delivered power, in comparison to inorganic materials.Kuznik et al. (2009) studied wallboard containing PCM materials and showed the importance of the hysteresis loop in PCM materials. The difference between the melting temperature and the freezing temperature is due to the fact that the mixture is not eutectic. They showed that the experimental freezing and melting peaks in specific heat can occur more than 4K apart. In order to take into account this phenomenon in our case, the melting curve supplied by the manufacturer will be shifted during the calibration process to obtain a pseudo freezing curve. Figure 2 shows the enthalpy melting and freezing curves of the PCM used in the prototype.
Figure 2: PCM melting and freezing enthalpy curves
The PCM density variation in liquid phase is neglected which implies a constant liquid density of 810 kg/m³. However, a contraction of 10% in solid state is considered. The enthalpy and internal energy variation can be assumed to be equal as in our case, the pressure in the pocket does not vary and the 𝑃 𝑑𝑣 term represents less than 0,005 % of the total enthalpy difference between 15 and 30°C.
𝑑𝑢 = 𝑑ℎ − 𝑃 𝑑𝑣 − 𝑣 𝑑𝑃 ≈ 𝑑ℎ (1)
2.2 Semi-empirical Model
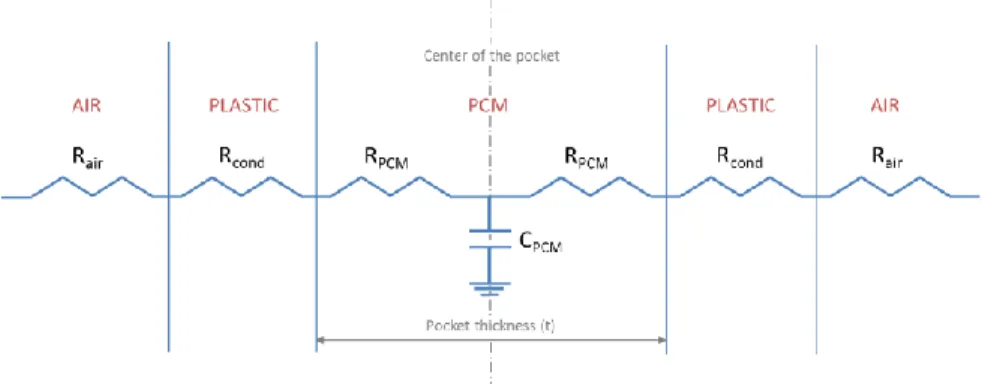
The governing equations of the semi-empirical model are presented in this section. The model is based on a lumped capacitance to model the PCM inertia. The ε-NTU method for a semi-isotherm heat exchanger is applied to compute the heat transfer from the PCM to the air flow.
Figure 3: Electrical analogy of the PCM pocket
As shown on figure 3 the entire PCM mass is assumed to be accessible at the center of the pocket through an access resistance given by:
2567, Page 4
𝑅𝑡𝑜𝑡=𝐴𝑈1𝑡𝑜𝑡= 𝑅𝑎𝑖𝑟+ 𝑅𝑐𝑜𝑛𝑑+ 𝑅𝑃𝐶𝑀 (2)
Where 𝑅𝑐𝑜𝑛𝑑 is the conduction resistance in the plastic material used for the pocket. The PCM resistance 𝑅𝑃𝐶𝑀 is
given by:
𝑅𝑃𝐶𝑀 =2 . 𝑘 𝑡
𝑐𝑜𝑟𝑟 . 𝐴𝑠 (3)
𝑘𝑐𝑜𝑟𝑟= 𝑘𝑃𝐶𝑀 . 𝑐𝑛𝑎𝑡,𝑐𝑜𝑛𝑣 (4)
Where 𝑡 is the thickness of one cell. The corrected conductivity 𝑘𝑐𝑜𝑟𝑟 is calculated with 𝑐𝑛𝑎𝑡,𝑐𝑜𝑛𝑣= 2 (Dolado et al.,
2011) to take into account the effect of natural convection in the PCM. A quick calculation showed that the Reynolds number on air side varies from 550 to 680, hence, the assumption of a laminar flow can be made.
𝑅𝑎𝑖𝑟=ℎ 1
𝑎𝑖𝑟 . 𝐴𝑠 (5)
𝑁𝑢𝑙=ℎ𝑎𝑖𝑟 𝑘 .𝐷ℎ
𝑎𝑖𝑟 (6)
Where the air side convective heat transfer coefficient have been determined by means of a correlation corresponding to the plates design. This latter is not given for confidentiality reasons. The energy balance applied to the heat exchanger gives:
𝑄̇𝑎𝑖𝑟= 𝑚̇𝑎𝑖𝑟 . 𝑐𝑝,𝑎𝑖𝑟 . (𝑇𝑎𝑖𝑟,𝑒𝑥− 𝑇𝑎𝑖𝑟,𝑠𝑢) (7)
𝑄̇𝑎𝑖𝑟= 𝜀𝐻𝐸𝑋 . 𝑚̇𝑎𝑖𝑟 . 𝑐𝑝,𝑎𝑖𝑟 . (𝑇𝑃𝐶𝑀− 𝑇̅𝑎𝑖𝑟) (8)
𝑄̇𝑎𝑖𝑟= −𝑑𝑈𝑑𝑡𝑃𝐶𝑀 (9)
Where 𝑇̅𝑎𝑖𝑟 is the mean air temperature between the supply and exhaust temperatures and 𝜀𝐻𝐸𝑋 is the efficiency for a
semi-isothermal exchanger. Integrating the variation of the PCM internal energy allows to compute the temperature variation of the PCM during the experiment.
The pressure drop calculation is based on a friction factor given by a correlation corresponding to the plates design. This latter is not given for confidentiality reasons.
2.3 CFD Analysis
The semi-empirical model allowed the identification of the geometry in term of compromise between pressure drop and heat transfer efficiency. The next step was to draw the selected geometry in a CAD software and perform a CFD analysis to compare the previous results. The main advantage of the CFD is that every singularity of the geometry is taken into account unlike the semi-empirical model which heeds only the hydraulic diameter. A balanced distribution was supposed at the entrance. The first CFD simulations showed a bad distribution of the flow rate between the cells leading to preferential canals. Even if the semi-empirical model showed that this geometry was optimized, a compromise had to be done on the hydraulic diameter in order to homogenize the flow repartition. Hence, the final geometry was obtained via an iteration process between the semi-empirical model and the CFD simulations in order to obtain a satisfactory convective heat transfer coefficient combined with a homogenous distribution of the flow throughout the exchanger.
3. EXPERIMENTAL INVESTIGATION
The aim of the present section is to describe the experimental investigation conducted on the manufactured air-PCM heat exchanger (see Figure 1) in order to measure its thermal and hydraulic performances. The test bench used in this study is based on the experimental apparatus already used by Gendebien et al. (2013) and slightly modified.
2567, Page 5
3.1 Description of the Experimental Set up
A schematic representation of the test bench is given in Figure 4 and Figure 5.
Figure 4: Schematic representation of the test bench when the matrix is supplied with cold air (discharge test)
Figure 5: Schematic representation of the test bench when the matrix is supplied with warm air (charge test)
The air stream can be cooled down by means of the direct-expansion evaporator of an air-cooled chiller. In order to avoid freezing of the evaporator, the latter is supplied with fresh air delivered by an air compressor coupled to an industrial dryer. It is possible to control the fresh air temperature at the inlet of the heat exchanger by post-heating the fresh air flow rate with the use of variable electrical resistances. Ducts containing fresh air flow are insulated by mineral rock of 25 mm thickness.
The mass flow rate of both fluids (fresh and indoor air) can be adjusted by means of a set of regulating valves and are measured by means of orifice plates, as recommended by ISO 5167 (1980). Differential pressure ‘Schaevitz’ sensors with an accuracy of ±2.5 Pa dedicated to the air flow rates measurement have been used. Air temperatures are measured with type T thermocouples with accuracy of ±0.3 K. The supply and exhaust temperature analyzed in this paper both correspond to the average of 5 measurements by type T thermocouples, as proposed in the Standard EN 308.
Accuracies of the measurement devices are summarized in Table 1.
Table 1: Accuracy of the measurements devices
Measurements Accuracy
Type T thermocouples ± 0.3K
Differential pressure sensors (Full-scale: 500 Pa) ± 2.5 Pa Differential pressure sensors (Full-scale: 100 Pa) ± 1 Pa
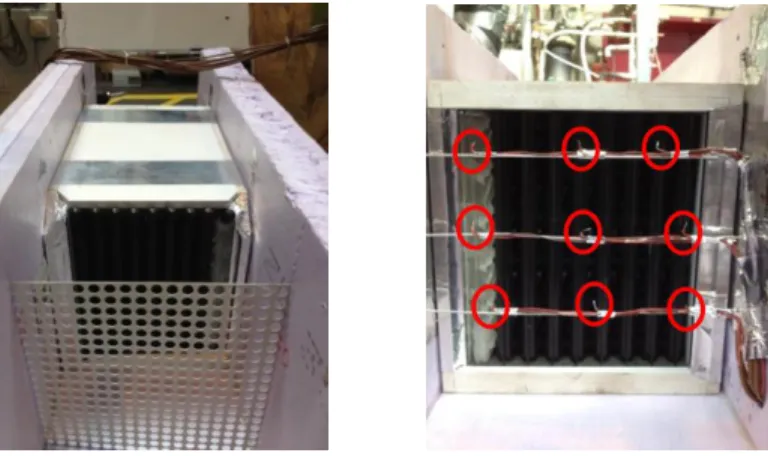
In addition to the supply and exhaust temperature measurements, nine thermocouples (see Figure 6) have been placed at the exhaust of the heat exchanger to be able to identify a potential flow rate misdistribution inside the heat exchanger
2567, Page 6
by comparing these nine measurements.Figure 6: Heat exchanger box and outlet temperature measurements for air flow misdistribution detection
The heat exchanger is located in a box insulated by 60 mm thick polystyrene in order to reduce heat losses to the atmosphere. In order to ensure a uniform air flow rate through the heat exchanger, dampers with filters are placed in the box upstream of the heat exchanger, as shown in Figure 6.
3.2 Methodology
Two kinds of tests have been carried out on the heat exchanger:
- Charge of the PCM. That corresponds to a transition from a solid state to a liquid state; - Discharge of the PCM. That corresponds to a transition from a liquid state to a solid state.
The day before a charge/discharge, the PCM module is fed with cold/warm air (i.e. 15 or 30°C). Once the exhaust air temperature is equal to the supply air temperature, the PCM module temperature is assumed equal to the supply/exhaust temperature. This temperature is considered as the initial PCM temperature used in the semi-empirical model.
The PCM module is then fed with a given flow rate (i.e. 45 m³/h) at a specific temperature to reach the liquid/solid state.
4. RESULTS AND COMPARISON WITH THE SEMI-EMPIRICAL MODEL
This section aims to show the experimental results (temperature evolution) and offers a comparison with the developed model described in the previous section. For each experimental test, the energy balance has been checked. This latter compares the theoretical and the measured energy storage of the PCM module between the initial and the final temperatures. The measured energy storage corresponds to the sum of the heat transfer rates measured each second on the air side.It is important to notice that the only inputs of the model are the measured air supply temperature, the initial PCM temperature and the air flow rate.
4.1 Charge of the PCM
Figure 7 offers a comparison between the measured and the model-predicted temperature evolutions of the exhaust air during the charge. The initial temperature of the PCM is equal to 15.7°C and the PCM module is fed with 45m³/h of air at 30.3°C.
2567, Page 7
Figure 7: Temperature profile during a charge test performed on the prototype
Figure 8: Exchanged power during the charge test
Figure 8 shows how the exchanged power varies during the test, it can be seen that the prototype is able to provide more than 50W of cooling power during approximately five hours. It has to be noted that the model is able to predict the exchanged power with an average error of less than 9% during the first five hours. The total energy transferred that was measured during the test is equal to 0.527 kWh when the model predicts 0.541 kWh of energy exchanged, i.e. a relative error of 2.8%.
The hydraulic model predicts a pressure drop of 17 Pa between the inlet and the outlet of the heat exchanger when the matrix is fed with 45 m³/h; whereas the experimental investigations show a pressure drop of about 19 Pa.
4.2 Discharge of the PCM
Figure 9 aims to compare the temperature evolutions predicted by the model and the measurements, when the PCM module is fed with a flow rate of 45 m³/h and a temperature of approximately 15°C.
The coefficient of determination for the exhaust temperature is equal to 94.8%.
It can be seen on Figure 10 that the prototype is able to provide more than 50W of heating power during approximately five hours. The total energy transferred that was measured during the test is equal to 0.539 kWh when the model predicts 0.551 kWh of energy exchanged, i.e. a relative error of 2.2%. Moreover, the model is able to predict the exchanged power with an average error of less than 8% during the first five hours.
1 2 3 4 5 6 7 8 9 10 11 12 10 15 20 25 30 35 Time [h] T e m p e ra tu re [ °C ] Tair;su;exp Tair;ex;exp Tair;ex;exp Tair;ex;m odel Tair;ex;m odel 0 2 4 6 8 10 12 50 100 150 200 Time [h] E x c h a n g e d P o w e r [W ] Model Model Experimental Experimental
2567, Page 8
Figure 9: Temperature profile during a discharge test performed on the prototype
Figure 10: Exchanged power during the discharge test
4.3 Observations
During these tests, several fractures were observed on different pockets due to the dilation of the PCM during the charge-discharge cycles. Hence, when the system is reheated, the PCM that is in direct contact with the pocket envelope melts first which leads to its dilatation. This way, the liquid PCM is stuck between a layer of solid PCM on one side and the pocket envelope on the other side. A mechanical strain is thus generated on the pocket as a result of the liquid PCM dilatation. The thickness and material of the pocket result in a compromise between the heat transfer efficiency and the mechanical strength.
Moreover, the nine thermocouples that were placed at the exhaust of the heat exchanger to be able to identify a potential flow rate misdistribution inside the heat exchanger (cf. Figure 6) didn’t show any significant temperature difference. Hence, one can conclude that the air flow distribution in the prototype is acceptable.
5. CONCLUSIONS
A simple semi-empirical model of an air-PCM heat exchanger has been developed and, along with a CFD analysis, allowed to determine an optimal geometry in terms of heat transfer efficiency and pressure drop. A prototype was then tested and the experimental results have been compared to the predictions of the model.
Fed with an air flow of 45 m³/h, during the first five hours, a single module can provide in average more than 90W of cooling power and about 80W of heating power. The advantage of this technology is the possibility to assemble easily several modules in series or parallel depending on the application.
The semi-empirical model is able to predict the exhaust air temperature with accuracy, the coefficient of determination being approximately equal to 95% during the discharge and the charge. The model gives a prediction of the power
0 1 2 3 4 5 6 7 8 10 15 20 25 30 35 Time [h] T e m p e ra tu re [ °C ] Tair;su;exp Tair;su;exp Tair;ex;exp Tair;ex;exp Tair;ex;model Tair;ex;model 0 1 2 3 4 5 6 7 -250 -200 -150 -100 -50 0 Time [h] E x c h a n g e d P o w e r [W ] Model Model Experimental Experimental
2567, Page 9
delivered by the exchanger with an average error of less than 9% in both cases. The main advantage of this semi-empirical model is its simplicity for an acceptable accuracy on the exhaust air temperature and the exchanged power. Hence, this model can be easily coupled to a building model to assess the seasonal performance of this system.NOMENCLATURE
𝜌 density (kg/m³)
k thermal conductivity (W/(m.K))
𝑐𝑝 specific heat (J/(kg.K))
R thermal resistance (K/W)
AU overall heat transfer coefficient (W/K)
𝐷ℎ hydraulic diameter (m)
h convective heat transfer coefficient (W/(m²K))
U internal energy (J/kg) f friction factor (–) V flow velocity (m/s) t thickness (m) T temperature (°C) Subscript
PCM phase change material side
air air side
cond conduction
l laminar
corr corrected
HEX heat exchanger
ex exhaust su supply tot total exp experimental nat natural conv convection
mod heat exchanger module
REFERENCES
Dolado, P., Lazaro, A., Marin, J. M., Zalba, B., 2011, Characterization of melting and solidification in a real scale PCM-air heat exchanger: Numerical model and experimental validation, Energy Conversion and Management, vol. 52, no. 1: p. 1890-1907.
Campos-Celador, Á., Diarce, G., Zubiaga, J. T., Bandos, T. V., García-Romero, A. M., López, L.M., Sala, J. M., 2013, Design of a finned plate latent heat thermal energy storage system for domestic applications,
International SHC 2013, Conference on Solar Heating and Cooling for Buildings and Industry, Energy
Procedia 48: p. 300-308.
Kuznik, F., Virgone, J., 2009, Experimental investigation of wallboard containing phase change material: Data for validation of numerical modeling, Energy and Buildings, vol. 41: p. 561-570.
Kuznik, F., Virgone, J., Noel, J., 2008, Optimization of a phase change material wallboard for building use, Applied
Thermal Engineering, vol. 28: p. 1291-1298.
Borderon, J., 2012, Integration of Phase Change Materials (PCM) as dynamic regulation system in thermal
2567, Page 10
Gendebien, S., Bertagnolio, S., Lemort, V., 2013, Investigation on a ventilation heat recovery exchanger: Modelingand experimental validation in dry and partially wet conditions, Energy and Buildings, vol. 62, July: p. 176– 189.
de Gracia, A., David, D., Castell, A., Cabeza, L. F., Virgone, J., 2013, A correlation of the convective heat transfer coefficient between an air flow and a phase change material plate, Applied Thermal Engineering, vol. 51, Issues 1–2: p. 1245–1254
Zalba, B., Marin, J. M., Cabeza, L. F., Mehling, H., 2004, Free-cooling of buildings with phase change materials,
International Journal of Refrigeration, vol. 27: p. 839-849.
ACKNOWLEDGEMENTS
The authors would like to acknowledge DuPont Inc. for funding this project and M. Jacques GILBERT for his many advices.