1
1.6.05
Revisiting
the
Evaluation
of the Performance of
Fluid-Filled
Catheters
Paul Gerard,
Thierry
Pochet, Bernard Lambermont,
Olivier Detry, Vincent
D'Orio,
Jean-Olivier Defraigne, Anny Fossion,
andRaymond
Limet
Hemodynamics Research Centre
(Hemoliege),
University of
Liege
15, avenue
desTilleuls, 8-4000
Liege,
Belgium
Abstract: A
new methodto
evaluate the performanceof
fluid-filled
cathetersand
to
reconstruct input
pressure wavesis
described. The method we
advocate assumesthat
pressure wavesrecorded
through
sucha
catheter andthrough
atip-catheter
(Sentron)taken
as referencefor
the input
pressure, belong
to a
underdamped, secondorder,
linear
system.
The
parameters
of
themodel
are
estimated
through
an
identification
procedure
that,
in
addition,
allowsto
evaluate how themodel
fits
the
data. Reproducibility
of
the
results
isexamined. The
opportunity of this
methodwith
respect to the"pop-test"
methodand
the"frequency
response" method isbriefly
discussed.INTRODUCTION
Fluid-filled
catheter-pressure transducer systems arefrequently used
to
measureblood
pressure waves.To
agood approximation, such qystems can be described
by
a second order linear differential equation which express the relationship between pressure recorded through the systemand
true
pressureat the
open endof
the
catheter. Most often, the undamped natural frequency o,, and the damping ratio(
are estimatedfrom
aninput
step response obtainedby performing
a
"pop-test"
ll,2l.
In
the
"pop-test", the systemis
subjectedto
a constant hydrostatic pressure thatis
suddenly releasedto a
zerolevel or
inversely.In
both cases, the recorded pressure oscillates around a steady statevalue.
The
parameters crr,,and
I
are estimatedfrom
thefrequency and the magnitudes of the two
first
oscillations.In
the
"frequency response" method[3], the
open endof
the catheter is exposed to strictly sinusoidal pressure wavesof
increasing frequencies.
As
soon
as
resonance is achieved,the
valuesof
c0,",and
(
are
deducedfrom
theresonance amplitude and frequency. The main objective
of
the present study
is to
providea time
domain method toidentif
the parameters on the basis of the recorded valuesof
any
pressurewaves
(whateverthe
shapeis)
giventhrough both the fluid-filled
catheterand
a
tip-catheter (Sentron) taken as reference. The procedure also allows to evaluate the precisionof
thefit
betweenthe
data and the theoretical second order linear system.METHOD
We
use
the
classical model
which
describes therelationship between
the
fluid-filled
catheter
pressure signal P"(t) and theinput
pressureP(t)
at the open endof
the catheter, by means of thefollowing
equation :dzpJa(
+ 2crr,,(
dPJdt 1 o.,2 P":
CP(t)
(1)where C is a constant
of
proportionality depending on thecalibrations
of
the two
signalsPg
andP.
If
these cali-brations are coherent, i.e.if
a constant steady input and its constant response are equal,C
equals c,tr'2 (co,,in
rad.s-l).However,
this
condition
is
not
required
to
apply
the method. The aimof
the identification procedure is tofind
the values of c0,,,(
and C so that equation (1) is satisfied at best by the P" and P waves. Equivalently, equation (1) canbe replaced
by the
one obtained after integrationof
both members :IP:
Cr IP" + Cz P".o*
C:dP",o
Q) where IP and IP" are respectively the integrals of P and P" over the time interval [0,1], and where P",6 ånd dP",o aro thevariations of
P"
and dP"/dt on this interval. The constantsCi (i:1,...,3)
are relatedto
the
parametersof
the
model through the following relations :(r)r,2:CtICz
e:Crl2Cta^
C:ll Ct
(3)Fitting the
modelis to
choosethe
valuesof
the
C1'sin
order that the data satisff equation (2) at best at every time step.We
suggestto
choose the valuesthat
minimize the sumof
the squared differences between thetwo
members of this equation, called the Residual Sum of Squares RSS :RSS:
t
(IP - Cr IP" - Cz P.o - CrdP",o)'
g)
In
this way, the problem offitting
the modelis
equivalent to a multiple regression. The relations (3) allow to estimatec')r,, C
and
C
from the
regression coeffrcientsCi 's.
Thequality
of
the
fit
canbe
appreciated usingthe
statistics associated to the regression.If
p"(co)and
p(co)are
the
complex
amplitudes atfrequenry o)
of
the
P"
and
P
waves respectively, thefollowing relation holds between them :
p(or) / p" (or)
:
(rrr,,2 - cot + 2ia
a^OlC
(5)which allows the reconstruction of the spectrum p(c,l) of P
from the spectrum p"(r,l) of P".
To
study the reproducibilityof
the estimated valuesof
the parameters and
to
assesstheir
independence from theshape
of
the input
pressurewave,
our
experimental procedurewas applied
to
10 different
shapesof
input pressure waves. The input pressure was measured by atip-catheter (Sentron).
The
fluid-filled
catheter
(Schwan-Ganz) was connectedto
a pressure transducer. Data wererecorded
by
an
appropriate software (Codas,
DataQ instrumentsinc.
Ohio,USA). To
compare our methodof
Medical & Biological Engineering & Computing Vol. 34, Supplement 1, Part 1, 1996
1n
100
identification
with
the "pop-test" method [1], we generated9 step-signals and we estimated the values
of
or,, and(
by both methods. Student t-testsfor
paired data were used to compare de means.RESULTS
Figure
I
gives an example of the pressure wavesP"
andP
recordedthrough the fluid-filled
catheter andthe
tip-catheter.Pressures (rrrnHg)
0
100
26
3mtirne (ms)
Figure 1. Recorded P" and P pressure waves.
Table
I
givesthe mean,
standarddeviation,
minimum,maximum
and
the
coeffrcient
of
variation
of
the parameterSo,
,(
and C over the 10 experiments.In all
theexperiments
the
fit
of
the
model
with the
data
was excellent (coefficient of determination R2 > 0.99).Table
l.
Results of the reproducibility analysis.Mean
SDMin
Maxcv%
DISCUSSION
The "pop-test" method is based on the comparison
of
thetheoretical response
to
a perfect step changeof
the input pressure. Experimentswith
tip-catheter shows that such astep change
in
pressure isdifficult
to generate and that the estimation of o,, and(
(especiallyO
can be sensitive to theshape
of
the
generatedsignal.
This
appearedin
thereproducibility study where classical "pop-test" equations
[]
couldnot be
appliedin
most cases.The
"frequencyresponse"
method requires
an
expensive
pressuregenerator,
the
procedureis
rather
long and
must
becarefully
workedout.
Thereforewe
investigateda
new procedure ableto
estimatethe
parameters, whatever the shapeof
the input pressure waveis,
andto
evaluate howthe model
fits
the data.In
practice,our
method does notrequire
a
tip-catheter.
In
a
bench
test,
the
reference pressure wavecan
be
equally
measuredby
a
classical external pressure transducer connected as near as possible of the input of thefluid-filled
catheter to be tested.Acknowledgments: This work was supported
by
grant ARC 94/99-
177 of the Communautd Frangaise de Belgique. REFERENCESUl
B.
Kleinman, S. Powell, P. Kumar andR.M.
Gardner, "The Fast Flush Test Measures the Dynamic Responseof
the
Entire Blood
PressureMonitoring
System," Anesthesiology , vot. 7'7 , pp.I2l5-I220,
1992.l2l
S.A.
Glan|z
and
J.V.
Tyberg, "Determination
of frequency responsefrom
step response: application tofluid filled
catheters," Am.J.Physiol.,vol.
236(2), pp. H376-H378, 1979.[3] R.M.
Gardner,"Direct Blood
PressureMeasurement-Dynamic
Response Requirements," Anesthesiologlt,vol. 54, pp.227-236, 1981.
a"/2n
Q{z)(
(rad) C (rad2. s-2)11.51
0.7010.432
0.0425982
75210.75
t2.6r
60.383
0.503
105148 7164
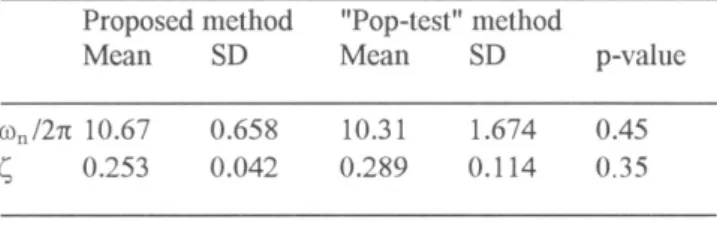
13Table 2 gives the mean and standard deviation of r,r,, and
(
estimated by our methodand
the
"pop-test" method. The p-values associatedto the
t-testsfor
paired samples, are also given. No significant difference appeared between the means estimatedby the two
methodsfor both
crl,, and(.
However,the
standard deviations are Largerin
the
"pop-test" method.Table 2. Comparison
with
the "pop-test" method. Proposed methodMean
SD "Pop-test" methodMean SD
p-valuean/2n
10.67c"
0.253 0.658 0.042 10.31 0.289t.674
0.450.114
0.35Medical & Biological Engineering & Computing Vol. 34, Supplement 1, part 1, 1996
The 1Oth Nordic-Baltic Conference on Biomedical Engineering, June g-13, 1996, Tampere, Finland