ORIGINAL PAPER
Cyclic and Fatigue Behaviour of Rock Materials: Review,
Interpretation and Research Perspectives
B. Cerfontaine1 · F. Collin1
Received: 3 March 2017 / Accepted: 26 September 2017 © Springer-Verlag GmbH Austria 2017
Keywords Fatigue · Cyclic loading · Review · Natural
Rock · Fatigue strength
1 Introduction
Environmental and huinduced loading acting on man-made works is cyclic in essence. From the wind and wave effects to earthquake- and traffic-induced wave propagation, structures designed by engineers are subjected to repeated time-dependent loads. This definition covers a large range of loadings distinct in amplitude and frequency.
Early studies on cyclic rock behaviour are devoted to mining sciences (Burdine 1963; Haimson and Kim 1971). Researchers seek to master the environmental variables to exploit material, through blasting and drilling processes. Investigations on this topic are still ongoing to improve rock-cutting (Ghamgosar et al. 2017) or hydraulic frac-turing (Zang et al. 2013) technologies. Further research works are devoted to protect against environmental threats: designing tunnels against earthquakes (Hashash et al. 2001), forecasting volcanic hazard (Kendrick et al.
2013; Heimisson et al. 2015), assessing the freeze–thaw cycles on tunnels built in hostile cold regions (Zhang et al.
2004; Liu et al. 2015), studying the ageing of pillars due to variations of water table level (Sorgi and De Gennaro
2011) or estimating the long-term stability of old monu-ments (Cattaneo and Labuz 2001; Jamshidi et al. 2013) or buildings (Hale and Shakoor 2003) against weather-ing. Oil and gas storage, mainly in salt mines, is another application where cyclic loading is imposed to the envi-ronment by human activities by successive emptying and filling (Cosenza et al. 1999; Wang et al. 2015; Voznesen-skii et al. 2017). The use of old mines as lower reservoirs for pumped storage hydroelectricity also generates cyclic
Abstract The purpose of this paper is to provide a
com-prehensive state of the art of fatigue and cyclic loading of natural rock materials. Papers published in the literature are classified and listed in order to ease bibliographical review, to gather data (sometimes contradictory) on classical experimental results and to analyse the main interpretation concepts. Their advantages and limitations are discussed, and perspectives for further work are highlighted. The first section summarises and defines the different experimental set-ups (type of loading, type of experiment) already applied to cyclic/fatigue investigation of rock materials. The papers are then listed based on these different definitions. Typical results are highlighted in next section. Fatigue/cyclic loading mainly results in accumulation of plastic deformation and/or damage cycle after cycle. A sample cyclically loaded at con-stant amplitude finally leads to failure even if the peak load is lower than its monotonic strength. This subcritical crack is due to a diffuse microfracturing and decohesion of the rock structure. The third section reviews and comments the concepts used to interpret the results. The fatigue limit and S–N curves are the most common concepts used to describe fatigue experiments. Results published from all papers are gathered into a single figure to highlight the tendency. Pre-dicting the monotonic peak strength of a sample is found to be critical in order to compute accurate S–N curves. Finally, open questions are listed to provide a state of the art of grey areas in the understanding of fatigue mechanisms and chal-lenges for the future.
* B. Cerfontaine b.cerfontaine@ulg.ac.be F. Collin
F.collin@ulg.ac.be
loading/unloading of the environment (Steffen 2012; Pujades et al. 2016).
All of these applications highlight the need of a bet-ter understanding of the rock behaviour upon cyclic and especially fatigue loading in order to ensure the long-term reliability of the built structures. This paper focuses on the rock behaviour, excluding plain concrete for which a review upon fatigue may be found in Lee and Barr (2004). A general review on fatigue behaviour of materials can be consulted in Schijve (2003). The main objective and originality of this paper are to provide a comprehensive state of the art of fatigue and cyclic loading of natural rock materials. It aims at classifying and organising results and interpretations, sometimes contradictory, published in the literature over the last 50 years. It provides a global pic-ture of the published papers, classical results and available data for researchers developing constitutive laws, since information often widespread in many different papers is summarised here. It is also dedicated to practitioners who can find a summary of fatigue strength results and select papers related to a particular material. Finally, different concepts related to the interpretation of fatigue results are commented and analysed, pointing out their advantages and limitations. Shadow zones and open questions are highlighted in order to be an incentive for new research works and projects.
This work is decomposed into three main sections. The first one classifies different experimental set-ups classi-cally published in the literature. The second part describes typical results observed or measured during fatigue experi-ments. They are illustrated by several examples rather than simply listed. If possible, monotonic and cyclic results are compared to highlight their differences. Finally, concepts used to synthesise results are reviewed and their limitations pointed out. These limitations are starting points of future research work. Finally, a list of all documents related to cyclic mechanical loading used to elaborate this paper is provided in “Appendix”.
2 Experimental Set‑up
References to cyclic loading of rock materials in the litera-ture cover many different experimental conditions. Subse-quently, physical phenomena investigated as well as results may strongly differ. In addition, some concepts are fre-quently used as synonym (cyclic/dynamic) or (static/mono-tonic) while they are not, introducing some confusion. This section firstly describes all concepts that will be used to list and classify references from the literature.
2.1 Loading
The loading of a rock sample may be considered dynamic if the inertial forces generated within the material are sig-nificant with respect to the loading force. On the contrary, the inertial forces are negligible during quasi-static loading. Dynamic loading is commonly encountered due to shocks, blasting, high-speed trains, etc. If the loading rate is very high during experiment, waves are propagated and their superposition produces a stress distribution different from the quasi-static situation (Kumar 1968; Zhang et al. 2000; Cho et al. 2003; Zhu and Tang 2006). However, no universal loading rate threshold has been established to differentiate between quasi-static and dynamic behaviours of the mate-rial. A loading rate equal to 0.05 MPa/s for uniaxial com-pression experiment on granite is proposed in Zhao (2000). A threshold of deformation rate equal around 0.1–1 s−1 is
proposed in Cho et al. (2003) for a Hopkinson bar test on granite.
Cyclic loading is characterised by an imposed time-dependent load or displacement signal which exhibits a repeated pattern, by opposition to monotonic loading where applied load/deformation is continuously increasing/ decreasing. The cyclic load signal is the superposition of a mean load 𝜎mean(t) and a cyclic amplitude Δ𝜎(t, T), where
T is the period of the load signal. Cyclic experiments are termed low cycle or high cycle depending on the number of cycles applied before failure occurs (Lee and Barr 2004). Once again there is no clear threshold, but low cycle ranges between tens to hundreds while high cycle ranges from thousands to millions. Period/frequency of the load signal is important since high frequencies mainly involve a dynamic loading.
The cyclic variation Δ𝜎(t, T) may have different shape over a period as represented in Fig. 1a. The most common cyclic stress variations are: square, linear or sinusoidal. A sinusoidal signal may be more representative of stress wave generated during rock burst or earthquakes, but linear vari-ations are often simpler to apply (Bagde and Petroš 2005b). Although the maximum stress and period are identical for all signals, the energy provided to the sample as well as the imposed accelerations differs. It is proven on different mate-rials that the shape of the signal affects the results (Gong and Smith 2003; Bagde and Petroš 2005b; Erarslan et al. 2014). Square signal is the most damaging, while linear variations are the least damaging.
Mean and cyclic stress amplitudes may be either con-stant or variable. Most of the tests found in the literature consider constant amplitude or increasing step by step as shown in Fig. 1b. High-cycle constant amplitude tests are mostly used to determine the fatigue limit of rock materials (Haimson and Kim 1971; Le et al. 2014), defined hereaf-ter in Sect. 4.2. Subsequently, they are named fatigue tests.
Some variants may be considered where intervals at constant load are applied between two cycles (Fan et al. 2016, 2017). Figure 1d represents a damage-controlled test using increas-ing mean and amplitude stress (Tien et al. 1990; Martin and Chandler 1994; Eberhardt et al. 1999). In these studies, such kind of low-cycle test is used to correlate damage with varia-tions in cohesion and mobilised friction. Some other authors investigate the evolution of the Young modulus and Pois-son’s ratio as representative of damage (Heap et al. 2010; Trippetta et al. 2013; Schaefer et al. 2015; Yang et al. 2015) or assess the stress history or a rock sample (Lavrov 2001). Finally, ramp signals are defined by a constant amplitude but an increasing mean stress, as represented in Fig. 1c.
2.2 Type of Experiment
Most of the experimental works report uniaxial (simple com-pression) tests (Attewell and Sandford 1974; Eberhardt et al.
1999; Bagde and Petroš 2005a). Such tests are representative of stress state in mine pillars and around galleries. They are used in different design methods, especially for pillar stabil-ity (Martin and Maybee 2000; Bertuzzi et al. 2016). In addi-tion, they are cheap and simple to carry out. Triaxial cyclic experiments at different confinements are attracting more attention (Gatelier et al. 2002; Liu and He 2012; Wang et al.
2013; Ma et al. 2013; Yang et al. 2015) since samples exhibit different behaviour with increasing confinement. In addition, they are necessary to calibrate advanced constitutive laws. Indirect tensile tests are also carried out to investigate more
deeply the fundamental fatigue fracture process or estimate the tensile strength of a material (Erarslan and Williams
2012b; Erarslan et al. 2014; Ghamgosar and Erarslan 2016; Wang et al. 2016; Erarslan 2016).
Three-point and four-point flexion tests are much less common and also provide information on the tensile strength (Cattaneo and Labuz 2001; Cardani and Meda 2004). They are often applied to the studying of natural stone or old buildings stability. Another type of bending test is proposed in Jamali Zavareh et al. (2017) where alternate compression and traction are generated in a clamped sample. Thermal or freeze–thaw cycles are commonly encountered to study rock weathering (Zhang et al. 2004; Martinez-Martinez et al.
2013; Liu et al. 2015). Despite quite different from mechani-cal loading, degradation processes may be common to both types of experiments. Cycles of wetting and drying may also be considered but are rare (Hale and Shakoor 2003).
3 Typical Results
In the previous section, we provide a broad definition of the cyclic behaviour of rock materials. Documents related to the mechanical cyclic behaviour are listed in “Appendix” and classified with respect to the previous criteria. In this sec-tion, we analyse typical measures and observations obtained during high-cycle constant load or low-cycle damage-con-trolled tests. We neglect weathering or freeze–thaw tests and focus on the mechanical behaviour.
σ σmean Δσ time T/2 T 0 Square Linear Sinusoidal σ time σmean,1 σmean,2 σmean,3 Δσ3 Δσ2 Δσ1 σ time Δσ σ time (b) (a) (d) (c) σmax(t)
3.1 Stress–Strain Curves
Time evolution of applied load and displacement is pri-mary results of the experiments. They are summarised as stress–strain evolution. Two examples are provided for uni-axial (Royer-Carfagni and Salvatore 2000) and triaxial (Liu and He 2012) conditions in Figs. 2 and 3. These figures are representative of almost of all experiments where constant cyclic amplitudes are applied. The main observations are summarised below.
1. Failure is reached for a maximum cyclic stress lower than the estimated monotonic strength of the intact rock. In the first example, 45 cycles at constant amplitude are necessary and 629 in the second example. This suggests that repeated cycles weaken the material’s strength. Such a degradation is also observed in ramp signals for indirect tensile test (Erarslan and Williams 2012b; Erarslan et al. 2014).
2. Residual deformations are accumulated cycle after cycle, while the maximum stress applied is constant.
3. The rate of deformation accumulation is not constant all along the experiment. The first and last cycles exhibit more deformation accumulation than in between. How-ever, accumulation rate decreases at the beginning and accelerates at the end, generating large hyster-esis. Between these two stages, cycle’s shape is mostly straight and close.
4. Lateral deformation is larger than the vertical one. Volumetric behaviour of the rock sample is compres-sive during first cycles but is mainly dilative otherwise, especially at low confinement. This is indeed related to the crack evolution and is discussed in Sect. 4.
5. The evolution of the secant/elastic modulus is not clear. Upon constant amplitude cyclic loading, most of the cycles appear to be parallel. No degradation is observed in Haimson and Kim (1971), Royer-Carfagni and Sal-vatore (2000), Cattaneo and Labuz (2001), Xiao et al. (2009, 2010), Fuenkajorn and Phueakphum (2010), Wang et al. (2013, 2015) and Ma et al. (2013), as reported in Fig. 2. Only a limited decrease is detected in Attewell and Farmer (1973), Liu and He (2012), Guo et al. (2012) and Le et al. (2014), see for instance in Fig. 3.
Several studies point out that monotonic stress–strain curves act as a failure locus for cyclically loaded sam-ples (Haimson and Kim 1971; Martin and Chandler 1994; Yamashita et al. 1999; Zhang et al. 2008; Xiao et al. 2009; Guo et al. 2012; Song et al. 2013; Liu et al. 2017). An exam-ple of such a phenomenon is reproduced in Fig. 4 for a plas-ter specimen (Brown and Hudson 1974). The main advan-tage of such artificial material is to reduce inhomogeneity, anisotropy and dispersion of results.
Cyclic results (solid line) and the post-peak part of the monotonic load (dashed line) are represented together. The instability encountered during the cyclic loading corre-sponds to the failure locus obtained from monotonic dis-placement-controlled results. This excellent correspondence is not always observed for natural materials as shown in Fig. 3. However, this may be primary due to the dispersion
Monotonic Cyclic -0.20 -0.30 -0.10 0.00 0.10 0.20 0.30 -0.40 -0.500 20 40 60 80 100 120 140 ε1 [%] q [MPa ] ε3 [%] Openin g Closin g Openin g
Fig. 2 Uniaxial test results on Lorano Marble at constant cyclic
amplitude ( f = 0.017 Hz), failure after 45 cycles, from Royer-Carf-agni and Salvatore (2000)
Indistinguishable cycles Envelope 0.0 1.0 2.0 3.0 4.0 0.5 0.0 -0.5 -1.0 -1.5 -2.0 -2.5 -3.0 -3.5 ε1[%] εv [%] 210 140 70 0 0.0 1.0 2.0 3.0 4.0 Indistinguishable cycles Envelope ε1[%] q [MPa ] Monotonic Monotonic (b) (a)
Fig. 3 Triaxial test results (confining pressure 30MPa) at constant amplitude on sandstone specimens (20–320 kN, f = 1 Hz), failure after 629
of rock sample strengths, producing very different results. Interestingly, such relation is also observed for cyclically loaded sands (Alarcon-Guzman et al. 1989) or creep as reported later (Brantut et al. 2014).
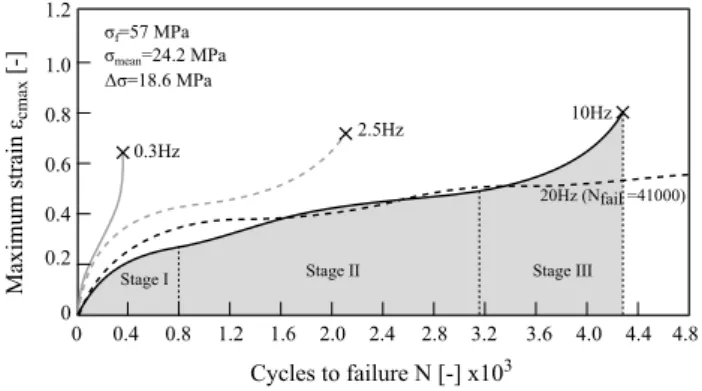
Damage-controlled tests, involving increasing maximum stress, should be considered apart. The number of cycles applied is mostly low and varies between 5 and 50 (Eber-hardt et al. 1999; Heap et al. 2010; Trippetta et al. 2013; Schaefer et al. 2015; Yang et al. 2015). The increasing stress from one cycle to the other approaches a monotonic load-ing, although some differences are noted, especially a slight decrease in strength (Yang et al. 2015). Figures 5, 6 and 7
from Heap et al. (2009, 2010) are representative of many damage-controlled tests, and the main observations are sum-marised below.
1. Failure is reached for a maximum stress applied close to the monotonic strength of the material (Eberhardt et al.
1999; Yang et al. 2015, 2017). Some authors report a lower strength after cycles of unloading/reloading
(Ken-drick et al. 2013; Meng et al. 2016), while some oth-ers (Yang et al. 2015) present example of increasing strength. A particular case where a sample failed for a load lower than the previous applied maximum stress during the same test is even reported in Schaefer et al. (2015). The effect of these cycles on the final strength depends on the type of rock, the confining pressure and the number of cycles applied.
2. Strain accumulates slowly with the number of cycles before peak (Heap et al. 2010; Schaefer et al. 2015) but in a much lower amount than previously described for constant amplitude cycles. However, cycles show a hys-teresis, increasing as the maximum stress applied rises up (Martin and Chandler 1994; Heap et al. 2010; Yang et al. 2015). 200 100 0 0.05 0.10 0.15 0 F [kN] Δ [cm] Monotonic post-peak results 27 cycles (144kN) 600 cycles (30kN) Cyclic results
Fig. 4 Uniaxial stress–strain relation for gypsum plaster
reconsti-tuted specimen, comparison between monotonic (dashed line) and cyclic relations (Brown and Hudson 1974)
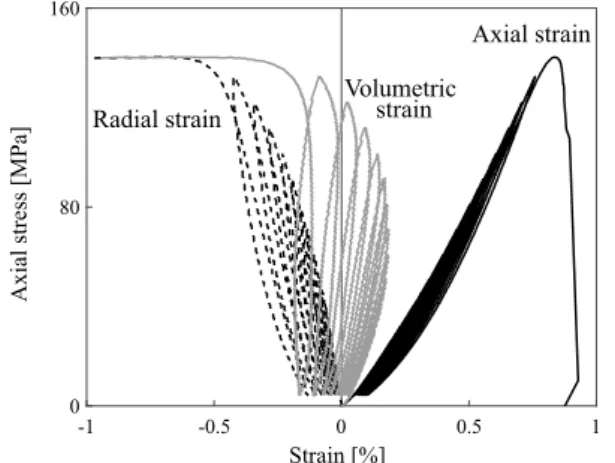
Strain [%] -1 -0.5 0 0.5 1 Axia l stress [MPa ] 0 80 160 Axial strain Radial strain Volumetricstrain
Fig. 5 Representative stress–strain curve for damage-controlled test
on Etna Basalt, from Heap et al. (2009, 2010)
20 34 27 14 0 7 0.1 0.5 0.3 Poisson's ratio Young modulus
Young modulus [GPa
]
Poisson's ratio [-]
Cycle number [-]
Fig. 6 Evolution of static elastic modulus and Poisson’s ratio with
increasing cycle number for damage-controlled test of Etna Basalt, from Heap et al. (2009, 2010)
300 150 0 0 80 160 100 101 102 103 104 105 106 107
Axial stress [GPa
] log AE Energy [fJ ] Time [min] AE Energy Axial stress
Fig. 7 Evolution of acoustic emission (AE) energy and axial stress
evolution as a function of time, for damage-controlled test of Etna Basalt, from Heap et al. (2009, 2010). Solid circles indicate the points at which AE activity recommenced on each loading cycle
3. The evolutions of the Young modulus and the Poisson’s ratio are particularly investigated during damage-con-trolled tests. Contrary to constant amplitude tests, most of the tests describe a trend of decreasing Young modu-lus (up to one third of decrease) (Eberhardt et al. 1999; Heap et al. 2009, 2010; Kendrick et al. 2013), while some others report increasing Young modulus (Trippetta et al. 2013). The Young modulus is also reported as increasing for the first few cycles and decreasing after-wards (Yang et al. 2015). On the other hand, Poisson’s ratio increases in all studies, sometimes strongly [up to 600% (Heap et al. 2010)]. They mostly indicate a dila-tive behaviour of the material and crack propagation, discussed in the following section.
3.2 Deformation Evolution
It is difficult to compare the full response signal of differ-ent samples for a large number of cycles since the amount of data is very large. Therefore, it is common to analyse the evolution of a single value summarising results with respect to the number of cycles applied. For instance, the residual deformation/displacement (after unloading) is classically analysed as shown in Fig. 8, from Attewell and Farmer (1973). Evolution of stiffness (elastic properties or secant modulus) is sometimes provided for large number of cycles and exhibit a similar trend (Xiao et al. 2010; Guo et al. 2012). However, this variable must be post-processed introducing more uncertainties.
Results often present a three-stage behaviour (Tien et al.
1990; Royer-Carfagni and Salvatore 2000; Fuenkajorn and Phueakphum 2010; Xiao et al. 2010; Erarslan and Williams
2012b; Guo et al. 2012) similar to classic description of brit-tle creep (Cruden 1974; Brantut et al. 2013) and subcritical crack growth (Atkinson 1984). Stage I is referred as deceler-ating, indicating a stabilisation. Stage II is named stationary, and the accumulation rate is constant. It may be very short
or may consist of the most part of the experiment as shown in Fig. 8. Stage III is termed accelerating, since the rate of degradation increases up to the final failure of the rock sample. These phases are directly correlated with open or close cycles in the stress–strain curves described in Sect. 3.1.
For damage-controlled stress, the Young modulus and Poisson’s ratio evolutions are particularly investigated, as previously reported. It can be categorised in several stages similarly to the strain evolution (Yang et al. 2015). Stage I depicts an increase in Young modulus and a slight decrease in Poisson’s ratio, corresponding to material hardening. The number of cycles of this phase obviously depends on the stress amplitude increments. Stage II corresponds to material degradation where the Young modulus decreases and Pois-son’s ratio increases slightly (Yang et al. 2015), or are almost constant (Trippetta et al. 2013). Finally, at failure (Stage III) Poisson’s ratio increases sharply and Young modulus decreases.
Although comparisons are considerably facilitated by such summarised results, it is still difficult to identify a universal evolution law even for a given material. Indeed, these curves are strongly dependent on many parameters as reported in Table 1, modifying the number of cycles to failure and curve’s shape. For instance, frequency of the cyclic loading considerably modifies the shape and num-ber of cycles to failure as reported in Fig. 8. At constant maximum applied stress, the cyclic amplitude (or minimum stress) is also proven to modify the number of cycles to fail-ure (Erarslan and Williams 2012b; Momeni et al. 2015).
3.3 Dilatancy
Dilatancy is often macroscopically measured by strain gauges or LVDTs, during the experiments and especially for unconfined uniaxial tests. It is inherently anisotropic and stress-induced (Sondergeld and Estey 1981; Scholz and Koczynski 1979) since the loading creates microcracks ori-ented in a direction parallel to the loading. Consequently, it is observed that macroscopic lateral deformation is larger than the longitudinal one (at low confining pressure), even for initially isotropic materials (Royer-Carfagni and Salva-tore 2000; Liu and He 2012; Bastian et al. 2014). Larger volumetric deformation is observed during cyclic tests, since longitudinal and transversal deformation are larger.
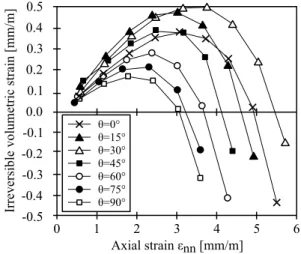
The initial anisotropy of the rock fabric also influences the observed volumetric deformation. A study Gatelier et al. (2002) presents results of damage tests where cycles of constant amplitudes are applied up to the stabilisa-tion of accumulated deformastabilisa-tion. Volumetric irreversible strain reached at the end of each loading step is presented in Fig. 9. The rock material is orthotropic, and its plane of isotropy is inclined of an angle 𝜃 with respect to the horizontal direction. Two mechanisms are in competition σf=57 MPa σmean=24.2 MPa Δσ=18.6 MPa Cycles to failure N [-] x103 0 0 0.2 0.4 0.6 0.8 1.0 1.2 0.4 0.8 1.2 1.6 2.0 2.4 2.8 3.2 3.6 4.0 4.4 4.8 Maximum strain ε cmax [-] 0.3Hz 2.5Hz 10Hz 20Hz (Nfail =41000) Stage I StageI I StageI II
Fig. 8 Influence stress frequency upon failure strain, uniaxial test at
constant amplitude, limestone, 𝜎f = monotonic strength (Attewell and Farmer 1973)
(for triaxial tests): compaction and microcracking (Gatelier et al. 2002). The decreasing tendency of compaction rate and the clear dilatancy indicates that microfracturing starts early in the experiment and finally becomes dominant. In addition, the angle 𝜃 clearly modifies results, indicating that natural initial anisotropy should be taken into account while they are most generally neglected when results are presented (Gatelier et al. 2002; Royer-Carfagni and Sal-vatore 2000).
Dilatancy effects are reduced with increasing confine-ment when the importance of compaction mechanism (pore collapse) is increasing (Gatelier et al. 2002; Heap and Faulkner 2008). In addition, the confinement increases the normal stress acting on each crack, enlarging the maximum shear stress sustainable without slipping. Confinement also
reduces the effect of initial anisotropy of the rock material (Bieniawski 1967; Attewell and Sandford 1974; Fredrich et al. 1989; Gatelier et al. 2002).
3.4 Crack Development and Measurement
Differences between monotonic and cyclic results for large number of cycles may be explained by distinct crack growth processes. Several studies on Brisbane tuff state that a lot of dust and fragments are created during indirect tensile cyclic loading (Erarslan and Williams 2012b; Erarslan et al. 2014; Erarslan 2016; Ghamgosar and Erarslan 2016; Ghamgosar et al. 2017), while a clear and clean crack is observed during monotonic tests. This comparison is reproduced in Fig. 10. Similar results are obtained for a sandstone material (Liu et al. 2017).
In addition, a wider fracture process zone is observed for cyclically loaded specimens as shown in Fig. 11. In this figure, consequences of the two ongoing mechanisms are clear. Cyclic loading induces a wider fracture process zone and branching of the crack, resulting in plastic deformation measured at macroscale (Le et al. 2014; Ghamgosar and Erarslan 2016; Erarslan 2016).
Many other studies report that decohesion of rock grains and matrix loosening is a consequence of the cyclic load-ing (Burdine 1963; Costin and Holcomb 1981; Martin and Chandler 1994; Widhalm et al. 1996; Eberhardt et al. 1999; Royer-Carfagni and Salvatore 2000; Zhao 2000; Zhang et al.
2000; Gatelier et al. 2002; Cardani and Meda 2004; Bagde and Petroš 2005a; Guo et al. 2012). This is coupled with a high density of microfracturing and a more diffuse dam-aging of the samples (Haimson and Kim 1971; Eberhardt et al. 1999; Cattaneo and Labuz 2001; Nejati and Ghazvin-ian 2014). 0 1 2 4 5 6 -0.5 3 -0.4 -0.3 -0.2 -0.1 0.0 0.1 0.2 0.3 0.4 0.5
Irreversible volumetric strain [mm/m]
Axial strain εnn [mm/m] θ=0° θ=15° θ=30° θ=60° θ=45° θ=75° θ=90°
Fig. 9 Irreversible volumetric strain as a function of the axial strain
𝜖nn at the end of a loading step for different orientations of the strata,
uniaxial test, sandstone (Gatelier et al. 2002)
Table 1 Influence of different factors on the number of cycles to failure or deformation for large number of cycles
Factor Influence References
Frequency Increase number of cycles to failure Attewell and Farmer (1973), Tien et al. (1990), Fuen-kajorn and Phueakphum (2010), Ma et al. (2013), Momeni et al. (2015), Liu et al. (2017)
Maximum stress and amplitude Decrease number of cycles to failure Xiao et al. (2009, 2010), Fuenkajorn and Phueakphum (2010), Erarslan and Williams (2012b), Erarslan et al. (2014), Momeni et al. (2015)
Confinement Increase final deformation, increase number of cycles
of accelerating phase Burdine (1963), Tien et al. (1990), Liu and He (2012) Saturation degree Decrease number of cycle to failure Burdine (1963), Tien et al. (1990)
Anisotropy Number of cycles and deformation depend on
lithol-ogy Royer-Carfagni and Salvatore ((2002) 2000), Gatelier et al. Waveform Square waveform is more damaging than sinusoidal
one, adding intervals between cycles decreases dura-tion of the test
Bagde and Petroš (2005a), Fan et al. (2016, 2017) Size of the rock sample Increase number of cycles to failure Le et al. (2014)
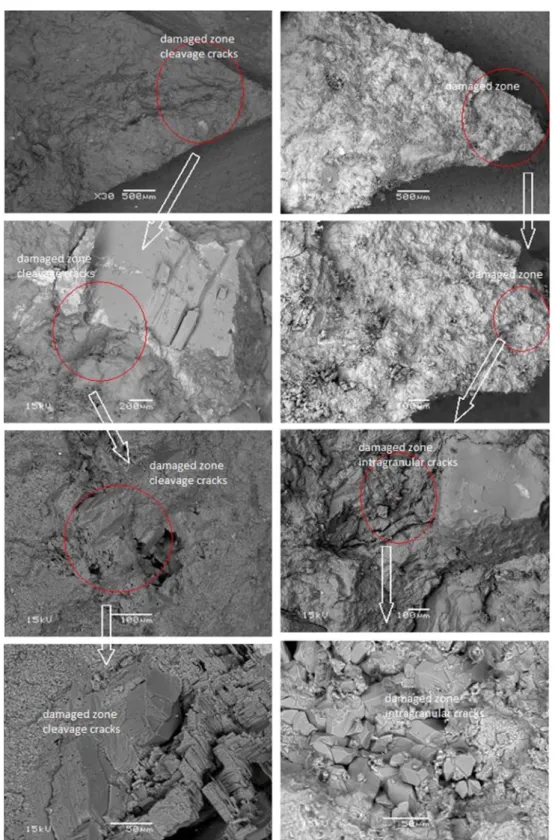
For instance, a comparison on indirect tensile tests on Brisbane tuff is provided in Fig. 12. Scanning elec-tron microscope observations are compared in both cases (Erarslan 2016). For monotonic loading, almost all grains on the failure surface are highly cracked and failure mode is brittle. For cyclically loaded specimens, most grains are cracked-free and failure holds along their boundaries. The primary fatigue mechanism is identified as inter-granular cracks (Erarslan 2016; Erarslan and Williams 2012a). A secondary mechanism results in wear and shearing between rock grains starting at contact points. This leads to intra-granular cracks. Finally, failure results from the coalescence of many microcracks rather than the growth of a single mac-rocrack (Erarslan 2016).
Similar observations are reported for triaxial cyclic exper-iments (𝜎3 =5 MPa) and damage-controlled tests where a
low number of cycles are applied (Yang et al. 2015). The authors carry out X-ray microcomputed tomography and observe that the crack pattern is much more complicated for cyclic than monotonic loading. They report axial and lateral tensile cracks in addition to the typical simple shear fracture. This implies that under certain conditions, a cyclic mechanism may be involved in the failure process even for a low number of cycles.
Acoustic emissions (AE) are defined as transient elas-tic waves generated by the rapid release of energy within a material (Lockner et al. 1992; Lavrov 2003; Antonaci et al. 2012). They result from the generation, propagation of (micro-), nucleation or coalescence of cracks (Kendrick et al. 2013). Therefore, their monitoring is a natural way to study the damage evolution during loading of rock or geo-material specimens since this is a non-destructive procedure. AE monitoring may be used to determine the position or energy released by cracks. Generally, the amplitude of the wave is correlated with the size of the fracture and they are correlated with the damage state of a rock specimen (Erarslan et al. 2014). Microscale fractures emit a large number of acoustic signal with a low amplitude, while mac-rocracks are characterised by few events of large amplitude. On the contrary, pore compaction is not expected to generate AE and friction between rough contact only induces low-amplitude AE (Trippetta et al. 2013). Prikryl et al. (2003) study the relations between acoustic emissions and the rock fabric. They identify that AE energy is strongly dependent on the grain size distribution of the material. They report that larger grains break at higher stress and release more energy than smaller ones. They also describe the influence of anisotropy on the fracture pattern, where secondary shearing
Fig. 10 Brazilian disc specimens of Brisbane tuff after failure, from Erarslan et al. (2014), a monotonic loading, b cyclic loading
Fig. 11 Computed tomography of cracked chevron-notched Brazilian disc (CCNBD) on Brisbane tuff, from Ghamgosar and Erarslan (2016), a monotonic loading, b cyclic loading
Fig. 12 Damage in the cement of a Brisbane tuff during indirect
ten-sile test: (left, static loading) intra-granular cracks along grain and cleavage cracks on the failure surfaces (right, cyclic) grain
decohe-sion, loosened grains and typical inter-granular cracks around grains on the failure surfaces, from Erarslan (2016)
mode fractures are observed in addition of tensile crack dur-ing uniaxial loaddur-ing.
AE are rarely monitored for cyclic tests with a large num-ber of constant amplitude cycles (Jiang et al. 2009; Xiao et al. 2010; Karakus et al. 2016). Jiang et al. (2009) report that AE are well correlated with the stress–strain evolution. There are more hits at the beginning (first cycle). Then the number of hits per second is almost constant in the following cycles and increases when the specimen is close to failure.
Monitoring of AE is much more common for damage-controlled tests (Lavrov 2001; Heap et al. 2009, 2010; Ken-drick et al. 2013; Trippetta et al. 2013). It is mostly reported that the AE are not continuous during experiments, as pre-viously presented in Fig. 7. During the first cycles, AE are measured almost from the beginning of the test and stop or decrease sharply during unloading. However, after the first cycle, AE start again when the previous maximum applied stress is overcome. This is the so-called Kaiser effect, further discussed in Sect. 4.5.
It should be mentioned that some other non-destructive techniques exist to monitor the fracture evolution of rock samples. Measurement of wave velocity is one of the most common (Rao and Ramana 1992; Lockner 1993; Meg-lis et al. 1995; Brantut et al. 2014; Voznesenskii et al.
2017). Microscopic thin sections are also often provided (Ghamgosar and Erarslan 2016; Wang et al. 2017). Tomog-raphy techniques are used in Chow et al. (1995) to assess the damage evolution of a rock sample. An interferomet-ric process is used in Cattaneo and Labuz (2001) to study the damage propagation during cyclic three-point bending test. It is shown in this study that cyclic loading produces a more diffuse damage than monotonic one. Åkesson et al. (2004) study the influence of fabric and mineralogy on the microstructure. Digital image correlation is another means to measure the crack formation during loading (Song et al.
2016; Munoz and Taheri 2017).
This paragraph does not pretend to be exhaustive on mon-itoring methods or references associated. However, many previous studies demonstrate that the rock behaviour is strongly dependant on microcracking (Kranz 1983). There-fore, measurement and monitoring of crack have become necessary in the interpretation of results. All the presented methodologies, alone or combined, may be adopted to increase the understanding and interpretation of cyclic load-ing and its particular failure mechanisms.
3.5 Partial Summary
The objective of this section is to provide a global picture of experimental observations related to the cyclic and fatigue behaviours of rock materials, from macroscopic to micro-scopic effects. This particular type of loading may result in permanent vertical and lateral deformation as well as
damaging of elastic properties. Dilatancy is most of the time observed as a consequence of the crack opening, especially at low confinement. It is also shown that a specific fracture process stems from this type loading and differs from mono-tonic loading. It generally leads to loosening and decohesion of the rock grains. Many different experimental conditions (confinement, rate of loading, anisotropy, saturation, etc.) influence the observations. Due to the relative complexity of the behaviour and heterogeneity of the material, theoretical concepts and key values must be defined to exploit results and compare rock materials or samples.
4 Interpretations
Typical results described before are difficult to use in prac-tice since they contain a large amount of information (full load–displacement signal for instance). Their interpretation requires conceptual models able to explain all physical phe-nomena underlying experimental observations. Furthermore, strength parameters must be derived from experiments in order to design earthworks against fatigue issues. There is a need to formulate a fatigue indicator reproducing the evo-lution of the degradation process and predicting the safety margin against failure. This is also a first step towards the definition of more complex constitutive laws.
This section describes common interpretation concepts and gathers information from all papers devoted to the fatigue behaviour of rock materials. Their advantages but also their limitations are described here. The main objective of this section is to highlight shadow zones requiring more investigation. The close fatigue and creep behaviours are especially not well distinguished. The so-called Kaiser effect is also discussed. Finally, a flowchart relating the interpreta-tion concepts with experimental set-ups is provided in order to help researchers/practitioners to design experimental campaign.
4.1 Fatigue Mechanisms
A simple frictional model is proposed in Scholz and Kranz (1974) and Zoback and Byerlee (1975) to explain the hys-teresis loops observed in the stress–strain relation, for axial, lateral and volumetric deformations. This model is detailed in Fig. 13 for two kinds of axially oriented cracks. Between points A and B, the solid behaves elastically. At point B, the cracks open and slip up to the maximum stress C, generating dilatancy. The unloading is elastic again until the maximum shear stress is mobilised within the crack (point D). Between D and E, the crack slips in the reverse sense. The crack is closing but does not necessarily recover its initial position.
The irreversible accumulated volumetric deformation over a cycle is due to the cracks that do not close completely
(Zoback and Byerlee 1975). Energy is dissipated both in frictional work and to open the cracks. This explains the opening–closing–opening pattern observed in Fig. 2. The large opening of the first cycles is due to the energy con-sumed for crack growth, which stabilises after few cycles. During the closing phase, the frictional work is dominant. Crack opens and closes with almost no extension. When the specimen is close to failure, crack growth becomes dominant again, involving increasing hysteresis of the cycles.
A similar model integrating opening or closing of exist-ing cracks is developed in David et al. (2012). It clearly describes the hysteresis observed at low confinement and the evolution of the Young modulus. However, it does not take into account crack generation or coalescence.
These conceptual models are able to explain qualitatively most of the typical results detailed in Sect. 3. Fatigue mecha-nism resulting in wear of the cracks and contacts between rock grains could be added by assuming a progressive deg-radation of friction coefficient along the edges of the crack. However, it is impossible to quantify any fatigue strength or time evolution of deformation. In addition, some delayed or creep-like phenomena [upon constant load (Fan et al.
2016, 2017)] described further are not taken into account. However, this is an interesting starting point to derive micro–macro-mechanical models such as those described in Zhu et al. (2008) and Pouya et al. (2016).
4.2 Fatigue Limit
It is shown that rock specimens cyclically loaded with an amplitude lower than their monotonic strength fail. A sim-ple way to illustrate the fatigue effect on the resistance is to relate the maximum stress applied to the number of cycles
necessary before failure. Such results are termed S–N or Wöhler curves and are common for engineers (Schijve 2003) whatever the material. The fatigue limit or fatigue strength may be defined as the stress amplitude for which there is no failure of the specimen, i.e. the fatigue life becomes infinite (Schijve 2003).
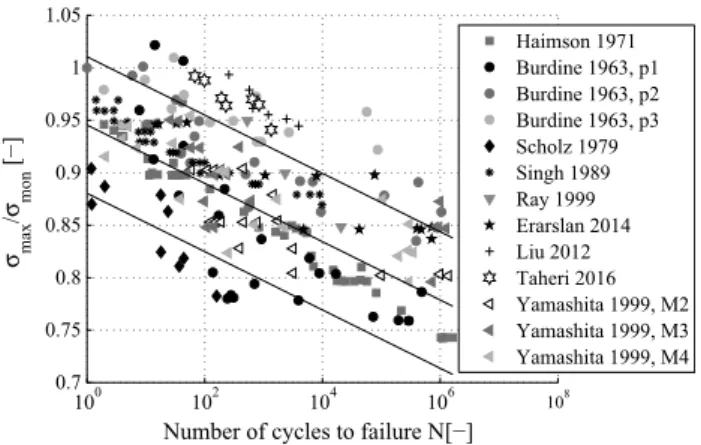
Figure 14 summarises results of S–N curves published in the literature. Different materials and types of experi-ments (uniaxial, triaxial, Brazilian) are superposed. How-ever, freeze–thaw or thermal loading is excluded, and load-ing frequency is kept low. Data from Jamali Zavareh et al. (2017) follow a different tendency, probably due to the non-conventional methodology and are not reported. The number of cycles to failure N is related to the normalised ratio of maximum cyclic stress 𝜎max to monotonic strength 𝜎mon. All
fatigue limits reported are listed in “Appendix”.
Results presented in Fig. 14 are indeed quite variable. A linear regression is often adopted to describe S–N curve in log10 basis (Schijve 2003), leading to
The standard deviation is equal to 0.0650. Despite varia-tions around the regression line, the trend is clear. A fatigue limit seems to exist for rock materials. Depending on the tested material, it ranges from 0.75 to 0.9 for one million of cycles. Based on this literature, if no data are available on a particular rock material, a fatigue limit of 0.7 times the monotonic strength may be used. This limit should be used cautiously since the estimated fatigue limit mostly depends on the patience of observers. Failure may occur for a lower stress but also more than one million of cycles. However, a million of cycles should be sufficient to encompass most applications of rock engineering.
S–N curves are very synthetic, simple and fatigue limit may be directly used in design methods. However, they are strongly dependent on experimental conditions even for a (1) 𝜎 max 𝜎 mon =0.9455 log10N −0.0278. σ1-σ3 σ1-σ3 σ3 σ3 σ1-σ3 σ1-σ3 σ3 σ3 σ1-σ3 ε ε1 ε3 εv A B C E Δ1 Δ2 D
Fig. 13 Simple frictional model dilatant hysteresis, after (Scholz and
Kranz 1974; Zoback and Byerlee 1975)
100 102 104 106 108 0.7 0.75 0.8 0.85 0.9 0.95 1 1.05
Number of cycles to failure N[−]
σ ma x /σ mon [−] Haimson 1971 Burdine 1963, p1 Burdine 1963, p2 Burdine 1963, p3 Scholz 1979 Singh 1989 Ray 1999 Erarslan 2014 Liu 2012 Taheri 2016 Yamashita 1999, M2 Yamashita 1999, M3 Yamashita 1999, M4
Fig. 14 S–N curves for different material and types of tests, constant
single material, as previously shown in Table 1. Therefore, a new S–N curve must be elaborated in each situation which is cumbersome and costly. For instance, Fig. 15 exhibits varia-tions of nonlinear S–N curves with confinement for a single material (Burdine 1963). Confinement increases the fatigue limit. Frequency of the applied load (Attewell and Farmer
1973) or intervals without loading between two cycles (Fan et al. 2016) modify results such that the reference to a num-ber of cycles may be questionable. Therefore, some authors attempt to define other fatigue limit.
Attewell and Farmer (1973) and Tien et al. (1990) pro-pose a strain threshold below which the crack propagation is stable. This is consistent with the definition of a monotonic envelope described in Sect. 3.1. Their definition is interest-ing but more difficult to apply at the scale of earthwork. Some others suggest the use of a dynamic energy criterion (Bagde and Petroš 2005a). Other authors propose to cor-relate deformation encountered during the first load cycle with the number of cycles to failure (Tien et al. 1990). All of these methods, despite interesting, are sometimes difficult to apply to engineering practice.
Another factor affecting results is the inherent variabil-ity of natural materials. The definition of a fatigue limit is based on a normalisation of the applied cyclic amplitude with respect to a monotonic strength. However, this strength may vary a lot between different samples and is unknown a priori for a given specimen. It is also impossible to conduct monotonic and cyclic tests together on a same sample since both tests lead to the failure of the specimen. This uncer-tainty introduces dispersion of results in the S–N curve.
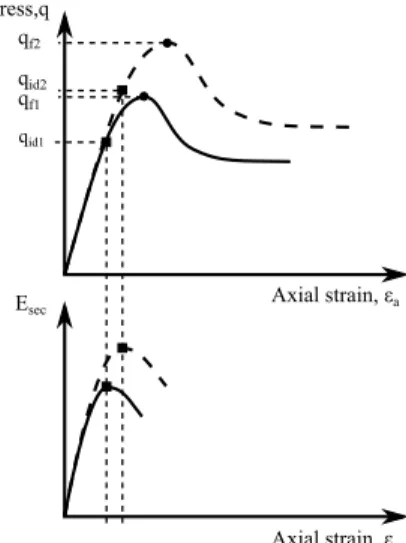
A method is proposed in Bastian et al. (2014) and Taheri et al. (2016) to estimate the strength of a specimen before applying a cyclic loading and without damaging the sam-ple. The authors observe that the secant Young’s modulus
encounters a maximum value at deviatoric stress qid before
the failure. They establish that the ratio between this shear stress and the failure stress is a constant for all specimens, namely
This is sketched in Fig. 16 where two stress–strain results corresponding to two different samples monotonically loaded are represented. Therefore, they propose to preload each sample up to the maximum of secant modulus in order to obtain qid2 and estimate the strength qf2 by comparison
with a previous monotonic test providing (qid1, qf1). The
secant modulus is defined according to
where q is a deviatoric stress, 𝜖 is a strain and 𝜖0 is an offset
supposed to reduce the variability of results.
This method is quite interesting but should still be applied to other rock materials/experimental set-ups to be validated. Particularly, it should be proven that the samples are not damaged by this preloading. The underlying hypothesis is that stress–strain relations are homothetic for samples of a given material loaded in identical conditions. Variations of the strength parameters depend only on heterogeneity. Another possibility would be to compare the first com-pression part of the cyclic loading and a monotonic test as reported in Fig. 17. Scaling could be carried out based on the initial elastic stiffness or between two point sharing the same tangent stiffness.
Finally, the model developed in David et al. (2012) relates the hysteretic behaviour of the rock sample to few (2) qid1 qf1 = qid2 qf2 (3) Esec = q 𝜖+ 𝜖 0 , Axial strain, εa Axial strain, εa Stress,q qf2 Esec qf1 qid2 qid1
Fig. 16 Use of the secant Young modulus (Esec) as an indicator point
to predict peak strength, plot of two different monotonic test results for two different samples of a same material
10−2 100 102 104 106 108 0.75 0.8 0.85 0.9 0.95 1 1.05
Number of cycles to failure N[−]
σ max /σ mon [−] σ3=0.21 MPa σ3=1.38 MPa σ3=5.17 MPa
Fig. 15 S–N curves for Berea sandstone at three confining pressures
parameters and the damage degree of the material. Subse-quently, a back-analysis could provide an estimation of the intact parameters of the material and may be used to nor-malise the results.
4.3 Indicator of Fatigue
Fatigue indicators are derived firstly to analyse, interpret and compare experimental results (Schijve 2003). They consist of a variable, indicating the evolution of a rock sample from its initial state to failure. Therefore, these indicators are also used to predict the evolution of a rock sample; for instance, they define how many cycles of constant amplitude should still be applied before failure. They are a measure of the fatigue degradation process. A suitable damage indicator must fulfil different properties (Xiao et al. 2010), and par-ticularly, it must
• have a clear physical meaning (primary value);
• be measured easily and applied conveniently;
• represent the actual degradation of the material;
• take into account initial degradation from previous load-ing;
• increase monotonically between zero (intact) and a final value (failure).
Different definitions based on distinct primary measured values are proposed by several authors and are reported in Table 2. The use of residual or vertical deformation is one of the most straightforward definitions since it is directly measured on the rock sample. Elastic or secant modulus is another possible definition requiring few post-processing. More advanced methods such as the measurement of acous-tic emissions or wave velocity in the material are also avail-able but require specific devices.
For all of these objectives, the critical step is to compute a priori an initial and final values of the fatigue indicator, corresponding to sample conditions and experimental set-up. None of the definitions are able to compute them simultane-ously. If we assume that the monotonic stress–strain path is an envelope for cyclic loading (as established in Sect. 3.1), the maximum residual deformation at failure (for a constant amplitude) may be estimated. However, the initial damage is unknown, since residual deformation is initially equal to zero by definition for any sample.
Most of the indicators successfully help the researcher to analyse and interpret results. They represent the classical three phase behaviour of degradation evolution (decreas-ing rate, stationary, increas(decreas-ing rate). They are compared in Table 3 with respect to the properties defined before. It is therefore easy to compare results obtained on different samples, a posteriori. It could be interesting to extrapolate results obtained a posteriori to: (1) predict a fatigue indica-tor evolution law for rock samples or earthwork, (2) derive a complex constitutive law applicable to finite element model-ling or (3) monitor already built earthwork.
On the other hand, initial wave velocity or elastic modu-lus could provide an estimation of the initial damage. How-ever, they are unknown at failure. Both initial and final val-ues are impossible to obtain for acoustic emissions which is therefore not suitable. Volumetric deformation is shown
Axial strain, εa
Stress,q
First compression Monotonic
Fig. 17 Estimation of the monotonic strength by comparison of the
first compression cycle and a monotonic test
Table 2 Summary of the different data used to compute a damage variable
Data nature References
Residual axial deformation Tien et al. (1990), Eberhardt et al. (1999), Li et al. (2003), Zhang et al. (2008), Xiao et al. (2010, 2010), Liu and He (2012), Guo et al. (2012), Wang et al. (2013), Momeni et al. (2015)
Residual volumetric deformation Martin and Chandler (1994), Eberhardt et al. (1999), Wang et al. (2013) Wave velocity Xiao et al. (2010)
Elastic/secant modulus Xiao et al. (2010), Wang et al. (2013), Liu and He (2012), Liu et al. (2014), Momeni et al. (2015), Liu et al. (2017)
AE count Eberhardt et al. (1999), Jiang et al. (2009), Xiao et al. (2010), Momeni et al. (2015), Karakus et al. (2016) Energy dissipated Royer-Carfagni and Salvatore (2000), Bagde and Petroš (2005a), Xiao et al. (2010), Momeni et al. (2015),
Liu et al. (2017)
to decrease in some cases (Eberhardt et al. 1999) and is not considered in the following.
Finally, Xiao et al. (2010) compare the evolution of dif-ferent damage indicators related to a same experiment. Their results, reported in Fig. 18, clearly exhibit that two differ-ent definitions do not necessarily provide homothetic evo-lutions. It is therefore impossible to determine what is the true “state” state of the rock material and only a comparison between samples is relevant. In conclusion, it is quite dif-ficult to elaborate a predictive model even for laboratory experiments.
Elastic/secant modulus or wave velocity measurements are a direct measure of damage of the material. Therefore, in this case the fatigue indicator could be directly linked to a damage constitutive law. However, damage is inherently anisotropic since it depends on the orientation of cracks. Shao et al. (2005) develop an anisotropic damage constitu-tive law for that purpose. However, in this case, a scalar damage variable is insufficient. Therefore, the applicability of a scalar-based constitutive law would be limited. In addi-tion, the choice and the computation method of the modu-lus may impact the results. Indeed, as reported in Momeni et al. (2015), the secant modulus reproduces the three-stage behaviour observed during fatigue experiments while tan-gent modulus only provides a scattered decreasing trend.
Permeability evolution is another indirect means of assessing damage in rock samples (Mitchell and Faulkner
2008; Schaefer et al. 2015; Wang et al. 2017). It clearly increases monotonically as cracks develop in the sample, in the direction permeability is measured. However, meas-urement of this physical variable is quite slow especially for low-permeability rock materials (Mitchell and Faulkner
2008). Therefore, this is mainly applicable to low number of cycles loading. In addition, the measurement duration should be negligible with respect to the cycle period; otherwise, delayed effects may affect the results.
Monitoring earthwork is necessary to prevent a cata-strophic event. The transition from experimental results to earthwork seems cumbersome since prediction of initial degradation or degradation at failure is even more complex at this scale. Therefore, the definition of an exact state of fatigue and margin of safety is impossible to obtain. How-ever, the increments of the indicator provide relevant infor-mation. If the increment per cycle increases, the accelerating phase is reached and will lead to failure in a close future. Acoustic emission, deformation and wave velocity all seem relevant and applicable to monitoring.
In conclusion of this section, should we conclude that fatigue indicators are meaningless? Certainly not, they pro-vide useful means of comparison between experimental results, and they ease their interpretation and highlight the degradation kinetics. In addition, their evolution may be use-ful for monitoring of earthwork and prevent catastrophic event. However, it is impossible to extrapolate a complex constitutive law or predict the behaviour of complex earth work from a scalar value. It is suggested that a suitable indi-cator should be based on a combination of different variables rather than on a single one.
4.4 Relation Between Creep and Fatigue
The delayed failure of a rock sample subject to a constant applied stress is termed brittle creep (Cruden 1974; Hudson and Harrison 1997; Brantut et al. 2013). Creep and fatigue results are shown to share similar features. They both exhibit time dependant behaviour where deformation rate is firstly decreasing then accelerating before failure. They both show that a sample may be failed for an applied load lower than its monotonic strength. This is termed subcritical crack growth (Atkinson 1984).
Table 3 Summary of the
different primary values used to compute a damage variable with respect to the required properties
Residual 𝜖y Residual 𝜖v Wave velocity Modulus AE count Energy Permeability
Physical x x x x x x x Measurement x x x x x Initial x x x Monotonic x x x x x x Prediction x x 0 100 200 300 400 500 600 700 0.0 0.2 0.4 0.6 0.8 1.0 Damage ω[ -] Number of cycles N [-] F2 F30 F50 F40 F20 F10 F30 F50 F40 F20 F10 F2 Axial strain Secant modulus
Fig. 18 Two definitions of damage (axial residual strain and axial
Several mechanisms may be involved in this process such as dissolution, diffusion of ions within cracks, ion exchange or microplasticity. However, the stress corrosion mechanism is recognised to be dominant in many applications (Ander-son and Grew 1977; Atkinson 1984; Tomkins 1981; Brantut et al. 2013). It is assumed that stained bonds close to the crack tips react more easily with environmental agents and these bonds are broken at a lower stress level, as shown for silicates in Michalske and Freiman (1982, 1983). The crack propagation is most of the time very slow and seems to be limited by a stress threshold (Anderson and Grew 1977). The influence of the environmental weakening process is reinforced by the presence of water and anisotropy of the material (Nara and Kaneko 2006; Nara et al. 2012).
Schematically, the logarithm of the crack velocity dur-ing a subcritical process may be related to the stress inten-sity factor KI (Wiederhorn 1967; Anderson and Grew 1977;
Ritchie 1999), as depicted in Fig. 19 for a soda-lime-silica glass. For low stress intensity factors, the relation is lin-ear. The kinetics of the crack propagation is thought to be dependent on the chemical reaction between the solid and the environment filling the crack. Crack velocity is inde-pendent of KI for a next range of stress intensity factors.
Cracking is then limited by mass transport of reactants to the tip of the crack. This plateau is not observed in any experi-mental conditions. In this case, it disappears for higher rela-tive humidity. Finally, high velocity rates are observed when the stress intensity factor is close to the critical one, namely
close to failure. Then the kinetics depends on a mix of cor-rosive and mechanical fracture.
Such observations and concepts could explain the cyclic behaviour of rock samples subjected to cyclic loading. A study on the cyclic behaviour of ceramic materials (Evans and Fuller 1974) suggests that a stress corrosion process is the origin of the subcritical crack growth without any additional fatigue effect. Therefore, fatigue effect should be considered as a creep behaviour for a constant load equal to the mean load of the cyclic signal. This idea is also pro-posed for rock materials (Attewell and Farmer 1973), sug-gesting that the elapsed time between the beginning of the test and failure is more relevant than the number of cycles. Recent studies proves that if time intervals at constant load are imposed between two cycles, the fatigue life is reduced (Fan et al. 2016, 2017), indicating a creep-like phenomenon.
Some other studies identify a distinct fatigue mechanism (Costin and Holcomb 1981; Li et al. 1992; Erarslan and Williams 2012b; Ghamgosar and Erarslan 2016; Ghamgo-sar et al. 2017) as reported in Sect. 4.1. The different crack processes identified as well as wear along crack edge tend to prove that one or several particular fatigue mechanisms exist. It is particularly shown in Singh (1989) and Momeni et al. (2015) that fatigue life is modified by the cyclic ampli-tude, for a given maximum stress. This is also consistent with the conceptual model presented before, describing the behaviour of a single crack (Zoback and Byerlee 1975; David et al. 2012). If the number of cycles applied is large, it is likely that the opening/closing and shear mobilisation at the edge of the different cracks will lead to a decrease in friction that could be mobilised (wear).
Interesting results presented in Yamashita et al. (1999) and reported in Fig. 20 compare creep and fatigue (S–N
4.0 5.0 6.0 7.0 8.0 10-7 10-6 10-5 10-4 0.017% 0.2% 1.0% 10% 30% 100%
Stress Intensity Factor KI, [N/m3/2] x10 5
Crack velocity [m/s
]
Region I Region II
Region III
Fig. 19 Effect of relative humidity on crack velocity in a
soda-lime-silica glass in a nitrogen atmosphere, from Anderson and Grew (1977); Wiederhorn (1967) 100 102 104 106 108 0.5 0.7 0.9 1.1 σ max /σ mon [−] 100 102 104 106 108 0.5 0.7 0.9 1.1 σ ma x /σ mo n [−]
Number of cycles N or time to failure [−/s] Creep Creep Fatigue Fatigue Creep Fatigue
Fig. 20 Relation between fatigue (1 Hz) and creep tests, Ogino tuff
(up) and Kurihashi granite (down), empty markers represent unfailed samples, from Yamashita et al. (1999)
curve, 1 Hz) results. Four materials are tested in this paper, and two are reproduced here. For two materials (granite is depicted in Fig. 20 bottom), creep and fatigue results are remarkably close to each other, sharing a similar fatigue/ creep limit and even S–N curve. For two others (tuff is depicted in Fig. 20 top), slope of the linear regression is different in creep and fatigue. Therefore, this correlation depends probably on the material and mineralogy.
Finally, it is shown in Brantut et al. (2014) that mono-tonic displacement-controlled tests act as an envelope for creep tests. In other words, failure occurs when the stress–strain curve of creep test intersects the one of mono-tonic test. This is similar to previous observations during cyclic loading.
It could then be concluded that a fatigue mechanism dis-tinct of the stress corrosion process exists. However, stress corrosion behaviour should not be neglected. They prob-ably interact and should be both taken into account in the result interpretation, depending on the experimental/in-situ conditions.
The type of rock material and grain size probably play an preponderant role in both processes (Prikryl et al. 2003; Heap et al. 2010; Erarslan 2016). As reported in Erarslan and Williams (2012b), each grain may act as an indenter and the magnitude of the fatigue process is likely to depend on the stress amplitude. Grain characteristics are also proven to be central in the stress corrosion process since most cracks initiate at their boundaries (Atkinson 1984). Subsequently, some studies conclude that stress corrosion dominates at high mean stress and low amplitude, while fatigue mecha-nism is preponderant at high amplitude and low mean stress (Scholz and Koczynski 1979; Costin and Holcomb 1981).
Increasing frequency is shown to increase the number of cycles to failure (Attewell and Farmer 1973; Tien et al. 1990; Ma et al. 2013; Momeni et al. 2015). Indeed, rock strength is inherently strain rate dependent (Zhang et al. 2000; Brantut et al. 2014). Therefore, low frequencies are more likely to enable delayed crack propagation at high stress due to stress corrosion, while high frequencies are more favourable to fatigue mechanisms.
Water and temperature are likely to enhance the stress corrosion effects as previously reported (Atkinson 1984; Kranz et al. 1982). Strength reduction for water saturated samples with respect to dry ones is reported in Baud et al. 2000 due to a decrease in fracture energy and slight drop of friction coefficient. This strength reduction is not identical for all rock types and may depend on the rock mineralogy and especially the clay content, as reported in Hawkins and Mcconnell (1992) and Morales Demarco et al. (2007) for sandstones. Finally, water may have an active weathering role by dissolving bonds between grains within the material (Ciantia et al. 2014). All of these
factors should enhance the stress corrosion process active during cyclic loading.
Fatigue and stress corrosion processes are very complex, intricate and depend on many parameters. To date, there is no criterion allowing to distinguish between their respective effects on crack damage evolution. They are most of the time considered separately, and further studies combining both types of tests should be carried out to highlight their respective effects.
4.5 Kaiser Effect
The Kaiser effect is a well-known phenomenon in metal-lurgy (Kaiser 1950) but also in rock mechanics (Lockner
1993; Holcomb 1993; Lavrov 2003). It states that if a sam-ple is subjected to a cyclic stress history, no acoustic emis-sion occurs over a cycle until the applied stress exceeds the maximum previously applied stress. Therefore, monitoring of acoustic emissions during loading of a rock sample allows to assess the stress history of a geomaterials at the laboratory scale (Li and Nordlund 1993) or even at the regional scale (Heimisson et al. 2015). This phenomenon is quite complex and influenced by many factors such as water content, tem-perature, loading rate, confinement. The interested reader should refer to (Lavrov 2003), while the following focuses on its relation with cyclic loading.
The classical Kaiser effect is observed by several authors during damage-controlled tests, among which (Li and Nor-dlund 1993; Gatelier et al. 2002; Lavrov 2001; Lavrov et al.
2002). Heap et al. (2009) observe a different manifestation of the Kaiser effect where acoustic emissions are recorded also during a part of the unloading. Their detection starts again at the stress where they stopped rather than at the pre-vious peak stress. This effect is attributed to a delayed crack process. On the other hand, a study questions this phenom-enon for the uniaxial cyclic loading of rock (Sondergeld and Estey 1981). Deviations from the classical definition are also identified in Rao and Ramana (1992) where the number of acoustic emissions does not decrease at constant cyclic load-ing amplitude. Similarly, Trippetta et al. (2013) observe an almost constant number of acoustic emissions during succes-sive cycles in triaxial experiments. This is attributed to two competing processes: dilative microcracking and compact-ing pore collapse.
The classical interpretation of the Kaiser effect is that no additional damage is generated for cycles whose maxi-mum stress is lower than the previous peak stress (Heap et al. 2009). This definition is in good agreement with obser-vations of damage-controlled tests where few cycles are applied, and there is a significant increase in stress ampli-tude between cycles. On the contrary, this interpretation seems contradictory with fatigue experiments where a large
number of cycles are applied. Indeed, reported experiments clearly exhibit a damaging process, while the maximum stress applied is constant.
There are different explanations to this apparent paradox. Firstly, a part of the fatigue mechanism is probably related to crack wear, generating low-amplitude acoustic emissions. A second possibility is a very slow crack growth without acoustic emission as suggested by Anderson and Grew (1977). Such low-amplitude events could be neglected due to a detection threshold in the post-processing (Antonaci et al.
2012). Subsequently, more research is necessary to inves-tigate the relation between acoustic emissions and fatigue mechanism.
4.6 Link Between Experimental Set‑Up and Objectives
The previous sections list and comment experimental set-ups, observations and interpretations related to fatigue loading of rock materials. A summary linking all of them is proposed in Fig. 21. The objective is to help researchers or practitioners to plan efficiently an experimental work for a particular purpose.
This flowchart is separated between design and funda-mental research objectives. The limit between is indeed less obvious. However, a design purpose is defined as a characteristic value or result that is directly used to derive the strength of an earthwork. Fundamental research encompasses experiments allowing calibration of complex constitutive laws (not simply friction angle and/or cohe-sion), investigation of concepts such as Kaiser effects or micromechanical origin of fatigue. A typical reference for each application is provided except for pumped stor-age hydroelectricity (PSHE) which is currently under investigation.
5 Conclusions and Perspectives
5.1 Summary
This paper lists and classifies the main documents published on the cyclic/fatigue behaviour of rock materials. Typical results observed and main features of mechanical fatigue are detailed. It provides a comprehensive insight on experimen-tal results and methods to other researchers for the design of new experiments or development of constitutive models. Finally, different concepts used to interpret these results are reviewed and their limitations are pointed out, highlighting new directions for applied research work.
The main cause of fracture upon cyclic loading is the progressive decohesion and loosening of the material. They are due to the microcracks propagating or initiating within the rock material before coalescence of a final macrocrack. Stress corrosion and fatigue mechanisms are highlighted to be responsible of the subcritical crack of rock specimens, namely the cyclic strength of rock samples is proven to be lower than the monotonic one. Both mechanisms probably occur simultaneously, stress corrosion dominating at high mean stress while fatigue mechanism is preponderant for high-cycle amplitude.
Typical results reveal different failure modes between monotonic (macrocrack) and cyclic (fragments and dust) experiments. Stress–strain cyclic relations exhibit hysteresis loops that can be explained by a simple frictional model. Energy is dissipated cycle after cycle in frictional work and crack opening. Residual deformation accumulates progres-sively and is similar to that observed in brittle creep behav-iour. The crack growth opening dominates at the beginning and the end, while frictional work is mainly responsible for energy dissipation during the steady stage.
Design S-N curve
Fatigue strength Weathering Uniaxial/triaxial Freeze/Thaw3p/4p flexion
Constant Constant
Constitutive modelling Post-peak Damaging Fatigue mechanism/Crack propagation Uniaxial/triaxial High Damage controlled Low Low Low e l b a ir a V /t n a t s n o C e l b a ir a V /t n a t s n o C ITS High Objective Type of test Cycle number Amplitude Application/ example Reference Anisotropy/
dilatancy Loading rate comparisonCreep Kaiser effect Residualstrength Oil
storage CAES PSHE indicatorFatigue Culturalheritage evolutionFPZ Fatigueorigin Deformation Evolution High Fundamental Research Wang et al., 2015 Fuenkajorn & Phueakphum, 2010 Xiao et al.,
2010 Martinez-Martinez et al., 2013 et al., 2012Gatelier Farmer, 1973Attewell & et al., 1999Yamashita Heap et al.,2009 Chandler, Martin & 1994 Ghamgosar & Erarslan, 2014 Erarslan, 2016 Volcanoes Kendrick et al., 2009 Mining ITS High Variable Rock-cutting Ghamgosar et al., 2017
Fig. 21 Flowchart for the choice of an experimental set-up, CAES—compressed air energy storage, PSHE—pumped storage hydroelectricity,