BIOACCUMULATION EFFECT OF MERCURY ON THE GREEN ALGA CHLORELLA VULGARIS
THE SIS PRESENTED
AS PARTIAL REQUIREMENT FOR THE MASTER IN CHEMISTRY
BY
SAHAR NOROUZ MOGHADDAM ABKENAR
Avertissement
La diffusion de ce mémoire se fait dans le respect des droits de son auteur, qui a signé le formulaire Autorisation de reproduire et de diffuser un travail de recherche de cycles supérieurs (SDU-522 - Rév.Oî -2006). Cette autorisation stipule que «conformément à l'article î î du Règlement no 8 des études de cycles supérieurs, [l'auteur] concède à l'Université du Québec à Montréal une licence non exclusive d'utilisation et de publication de la totalité ou d'une partie importante de [son] travail de recherche pour des fins pédagogiques et non commerciales. Plus précisément, [l'auteur] autorise l'Université du Québec à Montréal à reproduire, diffuser, prêter, distribuer ou vendre des copies de [son] travail de recherche à des fins non commerciales sur quelque support que ce soit, y compris l'Internet. Cette licence et cette autorisation n'entraînent pas une renonciation de [la] part [de l'auteur] à [ses] droits moraux ni à [ses] droits de propriété intellectuelle. Sauf entente contraire, [l'auteur] conserve la liberté de diffuser et de commercialiser ou non ce travail dont [il] possède un exemplaire.>>
L'EFFET DE LA BIOACCUMULATION DU MERCURE CHEZ L'ALGUE VERTE CHLORELLA VULGARIS
MÉMOIRE PRÉSENTÉ
COMME EXIGENCE PARTIELLE DE LA MAÎTRISE E CHIMIE
PAR
SAHAR OROUZ MOGHADDAM ABKENAR
During this Master, I gained expenence which gave me scientific professional knowledge and I would like to thank many people who supported me throughout my study.
I greatly thank my Superviser D. Dewez for his support and advices which permitted the realization of my research project. His international expertise in the domain of Environmental toxicology and chernistry related to green algae allowed me to achieve my Master's studies.
I would like to thank my colleagues of the laboratory, and a big thank to Mrs Sonia Lachance for her assistance.
Finally, I would like to thank aU my family, who encouraged me until the end of my studies, and finally I thank all my friends.
LIST OF FIGURES... VIl LIST OF TABLES ... ···... Xll LIST OF ABREVIATIONS... xm RÉSUMÉ... xv ASBTRACT... XVll GENERAL INTRODUCTION... 1 CHAPTERI ENVIRONME T AL CO TEXT... .. 4
1.1 Contamination of water by rn etals. . . 4
1.2 Studied metal, mercury... 6
1.2.1 Mercury in pharmaceuticals and utility products... .. . 8
1.2.2 Mercury toxicity and hurnan health... .. 9
1.3 Clean water technologies... 10
1.4 Use of microalgae in water remediation... ... 11
1.5 Biochemistry of green algae Chlorella vulgarisas a model of study . . . 12
1.6 Photosynthesis... 14
1.6.1 Photosynthetic apparatus... 16 1.6.2 Energy dissipation through fluorescence... 22
1.7 Synthesis of glutathione and phytochelatins for metal detoxification... 25
CHAPTERII
MATERIAL AND METHODS... 30
2.1 Algal culture . . . 30
2.2 Determination of cell density . . . .. . . 32
2.3 Analysis by Atomic Absorption Spectrometry... ... . . 34
2.4 Bioaccumulation of Hg in al gal biomass... .. . . 3 5 2.4.1 Standards used... .. . . 35
2.4.2 tock solutions of mercury... 37
2.5 Treatment conditions and preparation of samples... 3 7 2.5.1 Determination of dry weight... ... . . 38
2.6 Detennination of phytochelatins and related thiol-peptides... ... 38
2.7 High Performance Liquid Chromatography (HPLC) conditions... 39
2.8 Samples collection, handling and preparation... 41
2.9 Photosynthesis measurement... .. . . 52
2.9.1 Total chlorophyll content . . . .. . . . 52
2.9.2 Plant Efficiency Analyzer Fluorometer (Handy PEA)... ... 52
2.9.3 Fluorescence measurement technique and parameters... .. 53 54
2.10 Statistical analysis ... .
CHAPTER IIII
RESULTS... 55
3.1 Inhibition of cellular division by Hg (II)... 55
3.2 Mercury accumulation in biomass ofalga C. vulgaris... 57
3.3 Effect of Hg (II) on photosynthetic activity of C. vulgaris........ 59
3.3 .1 Change in total chlorophyll content... 59
3.4 Rapid chlorophyll fluorescence emission... 60
3.5 Change in photosynthetic based fluorescence parameters... ... 63
3.6 Induction of cysteine, glutathione and phytochelatin synthesis... 72
CHAPTER IV DISCUSSION 1 CO CLUSION... 78
Figure Page
1.1 Mercury distribution in the environrnent (Zahir et al., 2005)... . . . 7
1.2 Methylmercury bioaccumulation in aquatic organisms. If the concentration of methylmercury in lake water is considered to have an absolute value of 1, then approximate bioaccumulation factors for phytoplankton are 105; for zooplankton are 106 and for fish, birds and
humans are 1 0 7 (Environment Canada 2011). . . 8 1.3 Photo of algal cells of Chlorella vulgaris. Seattle, Washington, USA,
cement wall, 1000 x, DIC. 01 Nov 2008, taken by Karl Bruun©
([email protected]) ... :... 14 1.4 (A) Schematic diagram of a chloroplast including thylakoid membranes
(Taiz and Zeiger, 2010)... .. . .. . . .. ... ... . . .. . . ... . .. .. . ... .. . ... ... 15 1.5 Light and dark reactions of photosynthesis (Mal kin and Ni yogi, 2000). 16
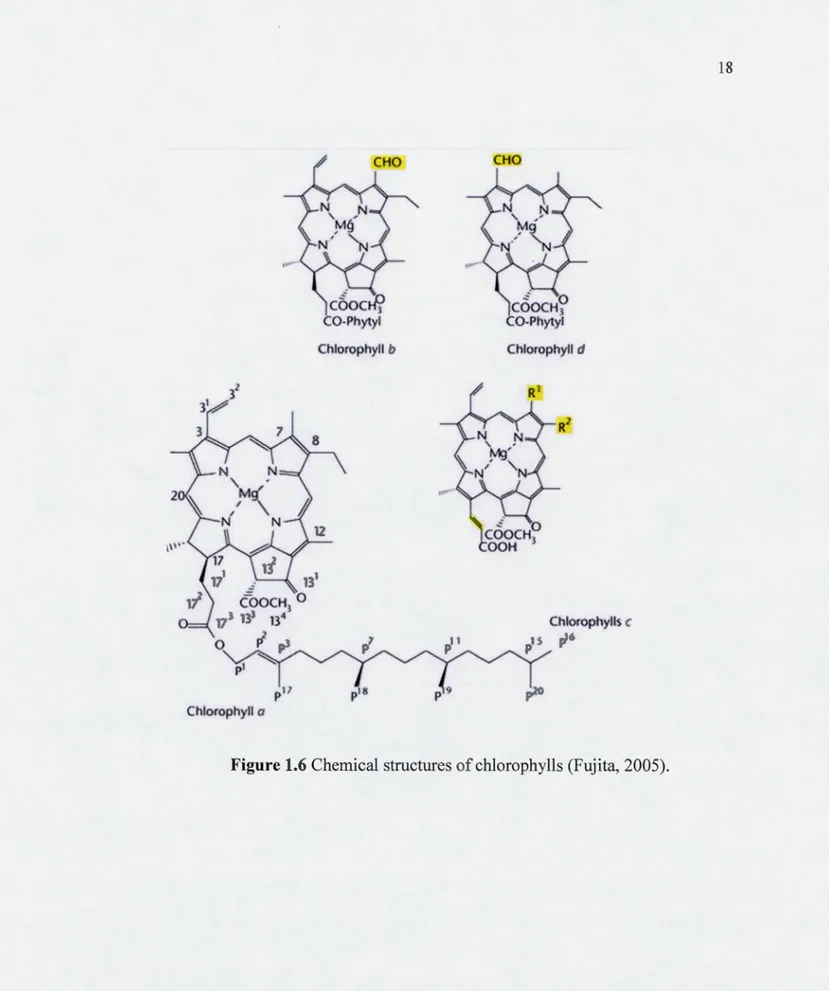
1.6 Chemical structures of chlorophylls (Fujita, 2005)... 18
1. 7 Absorption spectra of chlorophylls a and b in the visible region of the solar spectrum when dissolved in nonpolar solvents (Malkin and
Niyogi, 2000)... ... .. . . .. . . .. . .. . .. . .. ... .. . ... ... ... .. . . ... . .. ... ... .. ... 19 1.8 Structural mode! of PSII reaction center P680, showing proteins Dl,
D2, CP43 and CP47. The oxidation of water by the Mn cluster triggers the primary photochemical act. Electrons are transferred from
P680 to plastoquinone molecules QA and Q8 (Govindjee et al., 2010). 20 1.9 (a) Thylakoid membrane organization of photosystems and electron
transport carriers in higher plants. (b) Z-scheme indicating the Em values of photosynthetic electron transport carriers (Govindjee et al., 2010)... 21
1.10 Schematic representation of the excitation energy transfer ( small red arrows) between chlorophyll molecules in the light collector antenna system. Green dises represent chlorophylls a and b, and yellow dises represent carotenoids; the darker green dise represents an open reaction center and the lighter green dise represents a closed reaction center. (a) the reaction center is open and the energy is used for charge separation, while the fluorescence emission is minimal (labelled as F 0 ); (b) the reaction center is closed and the fluorescence emission is maximal (FM) (Govindjee et al., 2010). .. . . . .... .. . . . ... .. .. . . 23
1.11 The rapid and polyphasic (OJIP) rise of Chl a fluorescence induction presented on a logarithmic tirne scale when L. gibba plants were exposed to a saturating light (9000 f!mol of photons m-2 s-1) after a dark adaptation of 20 min. Legend: Control, round; treated 5 h to 100 f!g L-1 of Hg2+, triangle; treated 5 h to 1 0 x 10-5 M of DCMU, square; (Popovic et al., 2003)...... .. . .. . . .. 24
1.12 Chernical structures of glutathione and phytochelatin (Pal and Rai,
2010) 25
1.13 (A) Interconversion between reduced and oxidized form of glutathione; (B) Structure of reduced glutathione (Crawford et al., 2000).... 27
1.14 Mechanism of sequestration of cadmium in the cell by phytochelatins; LMW: low molecular weight phytochelatin Cd complex; HMW: high molecular weight phytochelatin Cd complex (Crawford et al., 2000)... 28
1.15 Formation of low or high molecular weight phytochelatin-Cd complexes. Interaction of PCs coordinately binding with sulfi.JJ atoms of Cys residues from either single or multiple PC molecules, forming different complexes (Pal and Rai, 2010)... .. .. . . .. ... .. . .. . ... . ... 29
2.1 The Multisizer™ 3 Coulter Counter (www.beckmancoulter.com)... 32
2.2 Standard curve indicating the relation between the change of cel! density and the change of absorbance at 750 nm by using three initial algal cell densities of C. vulgaris grown during 72 h... 33
2.3 Technical requirements for absorption spectrometry (Richard et al., 1993)... ... ... ... 34 2.4 Basic representation of an atomic absorption spectrometer (Richard et
al., 1993). ... .. .. .. .. .. . ... ... .. . . .. .. . .. . ... . . .. .. .. . . . .. . ... . . ... .. 35 2.5 Standards curve ofHg(II) for 24 and 48 h of exposures... 36
2.6 Standards curve of Hg(II) for 72 h of ex po sures... 3 7
2.7 Schematic representation of the principle of HPLC (http://en.wikipedia.org, 2013)... .... 40
2.8 Stability of GSH and PCs as bimane derivative fom1s over a 30-days period (Kawakami et al., 2006)... .. . . .. . .. . . .. . .. .. . ... . .. .. . . .. ... .. 45 2.9 The standard curve of glutathione (GSH) determined by HPLC and
fluorescence detection... 46 2.10 The standard curve of Cysteine determined by HPLC and fluorescence
detection... 47 2.11 The standard curve of PC2 determined by HPLC and fluorescence
detection... 48
2.12 The standard curve of PC3 determined by HPLC and fluorescence detection... 49 2.13 The standard curve of PC4 dete1mined by HPLC and fluorescence
detection... 50
2.14 The standard curve of PC5 determined by HPLC and fluorescence detection. . . 51 2.15 Handy PEA (http://hansatech-instruments.com)... 53
3.1 Changes in cell density of al ga C. vulgaris exposed during 72 h to different concentrations of HgCh. Significant differences between control and treated samples were determined for p < 0.05*: At 24 h, 50-100 ~M; At 48-72 h, 25-100 ~M... 55
3.2 Accumulation of Hg (Il) in al gal biomass of C. vulgaris exposed during 72 h to different concentrations of HgCb. Significant differences between control and treated samples were determined for p < 0.05 * ... 58
3.3 Change in the total chlorophyll content of alga C. vulgaris exposed during 48 h to different concentrations of HgCh. Significant differences between control and treated samples were determined for p < 0.05*... 60
3.4 Change in the rapid chlorophyll fluorescence emission in C. vulgaris exposed during 48 h to different concentrations of HgCh... 62 3.5 Change in the relative variable fluorescence at J transient (V1) of alga
C. vulgaris exposed during 48 h to different concentrations of HgCh. Significant differences between control and treated samples were determined for p < 0.05 *... ... 64
3.6 Change in the maximal PSII quantwn yield (Fv/Fm) of alga C. vulgaris exposed during 48 h to different concentrations of HgCh. Significant differences between control and treated samples were determined for p < 0.05 *. .. .. . .. . . .. . . ... .. . ... . . . ... ... ... . .. . .. . .. . .. ... . . . ... ... 66
3.7 Change in the effective transfer of absorbed-light energy from antenna complexes (ABS) to PSII reaction centres (RC) of alga C. vulgaris exposed during 48 h to different concentrations of HgCh. Significant differences between control and treated samples were determined for p < 0.05*... 68
3.8 Change in the perfom1ance index of PSII activity (PI) of alga C vulgaris exposed during 48 h to different concentrations of HgCh. Significant differences between control and treated samples were determined for p < 0.05*... 71 3.9 Change in the cysteine (Cys) content in algal biomass of C vulgaris
exposed during 24 h to different concentrations of HgCh. Significant differences between control and treated samples were determined for p<0.05* ... 73 3 .1 0 Change in the glutathione ( GSH) content in al gal biomass of
C
vulgaris exposed during 24 h to different concentrations of HgCh. Significant differences between control and treated samples were
determined for p < 0.05*... 74
3.11 Change in PC2 and PC4 contents of alga C. vulgaris exposed during 24 h to different concentrations of HgCh. Significant differences between control and treated samples were determined for p < 0.05*... 77
Table Page
1.1 Sources of releases in mercury into water in Canada (Environment
Canada, 2011)... ... .. 7 1.2 Toxicity effect oflow dose of mercury in various organ systems
(Zahri et al., 2005)... 15 2.1 Bold's Basal Medium (BBM) modified from the original recipe
(Stein, 1973) ... . 2.2 Summary of the methodology for the analysis of phytochelatins and
glutathione (oxidized + reduced forms) in natural waters (adapted from Winters et al., 1995; Rijstenbil and Wijnholds, 1996; Ahner et
31
al., 1997; Tang et al., 2003; Kawakarni et al., 2006)... ... ... .... 43 2.3 Reagents and detection methods used for the derivatization ofthiols
compounds (Kawakami, Gledhill and Achterberg, 2006)... ... 44 4.1. Change of investigated physiological parameters when algal cells of
AAS ABS/RC DNA ADP ATP COE Chla Ch lb
cw·
Cys EDTA ROS Fct Glu Gly GR GSH GSSG GS HMW HSM KDaA special molecule of chlorophyll a Atomic Absorption Spectrometry
Absorption of light energy by antenna complex per reaction center
Deoxyribonucleic acid Adenosine diphosphate Adenosine triphosphate Complex of oxygen evolution Chlorophyll a
Chlorophyll b
Chlorophyll in excited state Cysteine
Ethylene diamine tetraacetic acid Reactive oxygen species
Ferredoxin Glutamine Glycine Glutathione reductase Reduced glutathione Oxidized glutathione Glutathione Synthase
High Molecular Weight complex High Salt Medium
LED LHC LMW NADP NAD PH P680 PC PEA PI PQ PQH2 PSI PSII
Q
A
Qs RC SH TEMLight Emitting Diode Light Harvesting Complex Low Molecular Weight complex
icotinamide adenine dinucleotide phosphate in oxidized form
Nicotinamide adenine dinucleotide phosphate in reduced form
Reaction center of PSII Phytochelatin
Plant ef:ficiency analyzer fluorimeter Performance index of PSII
Plastoquinone in the oxidized state
Plastoquinone in the reduced state (Plastoquinol) Photosystem I
Photosystem II
Quinone A, primary acceptor of PSII electron Quinone B, secondary acceptor of PSII electron Reaction Center
Thiol Group
Le mercure (Hg) représente un dangereux polluant aquatique en raison de sa libération importante dans les eaux usées industrielles. En milieu aquatique, le Hg2+ sera conve11i en méthylmercure (MeHg) par le biais de l'activité des micro-organismes. Ensuite, la bioaccumulation de MeHg se produira dans les organismes aquatiques par l'intermédiaire de la chaîne alimentaire, et enfin, il peut être transféré à l'humain causant des problèmes de santé graves. La technologie de phycoremediation est une nouvelle méthode en développement utilisant les microalgues pour l'assainissement des eaux usées contenant du mercure. L'objectif de ce projet est de déterminer la capacité de bioaccumulation du mercure dans la biomasse algale de Chlorella vulgaris exposée aux différentes concentrations de HgCh pendant 72 h. Les effets de la bioaccumulation du mercure sur la division cellulaire et l'activité du photosystème II (PSII) ont aussi été examinées en ce qui concerne l'induction du glutathion (GSH) et des phytochélatines (PCs). Les méthodes d'analyse utilisées dans cette étude étaient la spectrométrie d'absorption atomique pour déterminer l'accumulation de mercure dans la biomasse algale, le compteur de cellules pour évaluer l'inhibition de la division cellulaire, l'émission de fluorescence de la chlorophylle pour analyser l'activité du PSII et enfm la chromatographie liquide de haute performance (HPLC) pour déterminer l'induction du GSH et des PCs. os résultats indiquent que la plus grande efficacité de bioaccumulation a été atteinte lorsque les cellules d'algues ont été exposées pendant 24 h à 100 11M de HgCh. Sous cette condition, la division cellulaire et l'activité du PSII ont diminué respectivement de 32 et 30 % par rapport au témoin. En effet, l'effet inhibiteur du mercure sur la photosynthèse peut expliquer la diminution de la division cellulaire. Dans les mêmes conditions de traitement, l'induction du GSH et des PCs augmente aussi considérablement à 24 h. Cela explique la tolérance des cellules algales contre les effets de la bioaccumulation du mercure montrant l'importance de ce mécanisme de détoxication moléculaire. De plus, nos résultats démontrent que le HgCh induit un impact plus fort de toxicité dans les cellules d'algues à 48 h par rapport à 24 h d'exposition, comme en témoigne le nombre croissant de cellules endommagées ou mortes, expliquant l'absorption inférieure de mercure par les cellules d'algues après 24 h d'exposition. En effet, après 48 h d'exposition, l'induction de PC2 et PC4 n'a pas
été détectée en raison d'un plus fort effet toxique de mercure provoquant des dommages sur le système cellulaire plus importants affectant les activités enzymatiques. Par conséquent, nos résultats indiquent que l'activité du PSII a été utilisée comme un biomarqueur fiable des effets de la bioaccumulation du mercure au niveau cellulaire, qui était indicateur de l'efficacité de la bioaccumulation du mercure dans la biomasse algale. En conclusion, selon les résultats obtenus dans cette étude, il est démontré que cette espèce d'algue verte, C. vulgarisa été assez résistante à l'effet du HgCb jusqu'à 100 ~M pendant 24 h d'exposition tout en maintenant son efficacité maximale de bioaccurnulation.
Mercury (Hg) represents a dangerous aquatic pollutant due to its important release
from industrial wastewater. In aquatic environment, inorganic Hg2+ will be converted
into methylmercury (MeHg) through the activity of microorganisms. Then, the bioaccumulation of MeHg will occur in aquatic organisms through the food chain,
and finally it can be transferred to human causing serious health problems. A new
developing method using microalgae permitting the remediation of wastewater containing mercury is the technology of phycoremediation. The objective of this project is to determine the bioaccumulation capacity of Hg in algal biomass of Chlorella vulgaris exposed to different concentrations of HgCh during 72 h. the bioaccumulation effects of Hg on cellular division and Photosystem II (PSII) activity
were also investigated in relation to the induction of glutathione (GSH) and
phytochelatins (PCs). Analytical methods used in this study were Atomic Absorption
Spectrometry to determine mercury accumulation in algal biomass, cells counter to
evaluate the inhibition of cellular division, chlorophyll fluorescence emission to
investigate PSII activity and High performance liquid chromatograpy (HPLC) to determine the induction of glutathione and phytochelatins. Our results indicated that the highest bioaccumulation efficiency was reached when algal cells were exposed during 24 h to 100 !J.M of HgCh. Und er this condition, cellular division and PSII activity decreased respectively by 32 and 30 % in comparison to control. Indeed, the inhibitory effect of mercury on photosynthesis may explained the decrease in cellular division. Under the same treatment condition, the induction of GSH and PCs increased also significantly at 24 h. This explained the algal cell tolerance against the bioaccumulation effect of mercury, determining the importance of this molecular detoxification mechanism. Moreover, our results demonstrated that HgCh induced a stronger toxicity impact in algal cells at 48 h in comparison to 24 h of exposure as indicated by the increasing number of injured or dead cells, explaining the lower uptake and sequestration capacity of mercury by algal cells after 24 h of exposure. Indeed, at 48 h of exposure, the induction of PC2 and PC4 was not detected due to the
strong toxic effect of mercury causing damages on the cellular system and affecting
enzymatic activities. Therefore, our results indicated that the PSII activity was used
which was highly related to the efficiency of the bioaccurnulation of mercury in algal
biomass. In conclusion, according to obtained results in this study, it is most likely that this species of green algae, C. vulgaris was enough resistant to the effect of HgCh up to 100 !-lM and until 24 h of exposure in order to maintain its maximum bioaccumulation efficiency.
Human health is at risk to toxic metals through different ways of exposure, such as the consumption of contaminated food and drinking water (Adriano et al., 2005). For example, it has been shown that metals as cadmium and mercury can cause serious damages to the nervous system and kidneys (Bernard, 2011). These metals can contaminate the environment from both natural and anthropogenic sources, representing a threat to the quality of aquatic eco systems (Adriano et al., 2005; Gadd, 2009). In particular, wastewaters rejected from industrial effluents contribute to the pollution of aquatic ecosystems by their high level in metals. Therefore, the decontamination of polluted water with metals is one of the most important human needs for preserving environmental quality. Presently, it exists several conventional methods for the removal of metals having advantages and disadvantages that are defined according to their effectiveness, necessity and quantity of chemical reagents. For example, biological methods are interesting because microorganisms are capable of accumulating both organic and inorganic pollutants (Eccles, 1999). Furthermore, the use of microalgae for wastewater treatment is representing a recent environmental biotechnology in development, which is defmed as "phycoremediation" of polluted water. Indeed, this technology uses the ability of microalgae to absorb and sequester large quantities of contaminants into their cells (Baumarm et al., 2009; La voie et al., 2009; Nishikawa et al., 2006). In addition, several studies had shown the ability of different species of microalgae to remove toxic metals and organic compounds from water (Wang et al., 2007; Zhang et al., 2011). This new approach possesses a strong advantage since it does not lead to secondary pollution such as usual methods for wastewater treatment, since microalgae use inorganic nitrogen and phosphorus for their growth (Abdel-Raouf et al., 2012). Also, the biomass can be used for different
applications including the production of biogas and energy through the digestion of biomass (absence of oxygen) into CH4 and C02 (Mui'ioz and Guieysse, 2006).
In the development of the phycoremediation technology, the main problem is to select the most appropriate algal species able to bioaccurnulate efficiently contaminants in order to apply them for the remediation of wastewater. Therefore, it is important to consider bath the efficiency of algal cells to bioaccurnulate metals and the tolerance against the cellular toxicity of accurnulated metals in relation to specifie environrnental conditions such as the pH, light irradiance and temperature. My study contributed to the use of microalgae in the treatment of wastewater contaminated with metals, by deterrnining the efficiency of algal cells to accurnulate mercury at different concentration and time of exposure. In this study, the highest capacity of mercury bioaccumulation was evaluated by using the green alga madel Chlorella vulgaris.
Therefore, this work is based on these following specifie objectives: 1-To determine the bioaccurnulation capacity of mercury in al gal biomass; 2- To investigate the taxie effects of mercury on cellular division and on Photosystem II photochemistry activity;
3-To investigate the induction of glutathione and phytochelatins in response to metal stress effect.
The realization of our specifie objectives 1s based on two mam working hypothesis:
1- The bioaccurnulation efficiency of algal cells is dependent to the exposed mercury concentration and the time of exposure.
2- The induction of molecular detoxification mechanisms, especially the
synthesis of glutathione and phytochelatins, 1s related to the cellular bioaccurnulation of mercury.
This Master thesis is organized into four main chapters. In the first chapter, the environmental context is presented, including the selection of mercury, the management of environmental pollution sanitation and the use of remediation water technologies. In this chapter, the biochemistry of green algae is also presented including photosynthesis and related physiological processes, ability of plant cells to respond to metal contamination, criteria for the selection of green algae for wastewater treatment, characteristics of the algal model C. vulgaris and finally
mechanism of mercury toxic effects at cellular level. Moreover, cellular and biochemical indicators related to the mechanism of stress response induced by mercury are presented. In the second chapter, methodological approaches used in this study are explained in details including the use of chlorophyll fluorescence emission as a biomarker of metal toxicity and the analysis of the induction of glutathione and phytochelatins in response to metal uptake. Finally, the results obtained in this study are presented and discussed in the third chapter.
1.1 Contamination of water by rn etals
Metals are present in all environmental compartments such as atmosphere, soil
and water at even low concentrations which can bioaccumulate through the food
chain (di Toppi and Gabbrielli, 1999). Severa! metals such as Fe, Cu, Zn and Mn are
considered essential for biological functions and they are needed in small quantities
in aquatic ecosystem, while others like Cd and Hg are toxic at very low
concentrations (Adriano et al., 2005). Metal sources of input come from
anthropogenic activities such as agriculture, metallurgy, power generation, mineral
extraction, nuclear processes and industrial effluents (Adriano et al., 2005; Gadd,
2009). Indeed, there are a lot of rivers especially in developing countries that are
contaminated by the release of metals from anthropogenic activities (Macklin et al.,
1994; Swennen et al., 1994. Miller et al., 2002). The risk of toxicity of metals is
determined by their bioavailability, which is defined by the capacity of living
organisms to absorb chemicals that are involved in their metabolism (Adriano et al.,
2005). It is well known that excess consumption of metals such as Cd and Pb can
result in neurological, bone and cardiovascular diseases, renal dysfunction, and
various cancers, even at relatively low levels (Calderon, 2000; Watt et al., 2000;
Jarup, 2002). Moreover, mercury can deteriorate the nervous system, impairs hearing,
speech, vision and gait, difficulties on chewing and swallowing, and it can also
causes involuntary muscle movements, corrodes skin and mucous membranes. In
Canada, almost 150 billion liters of untreated and undertreated wastewater (sewage)
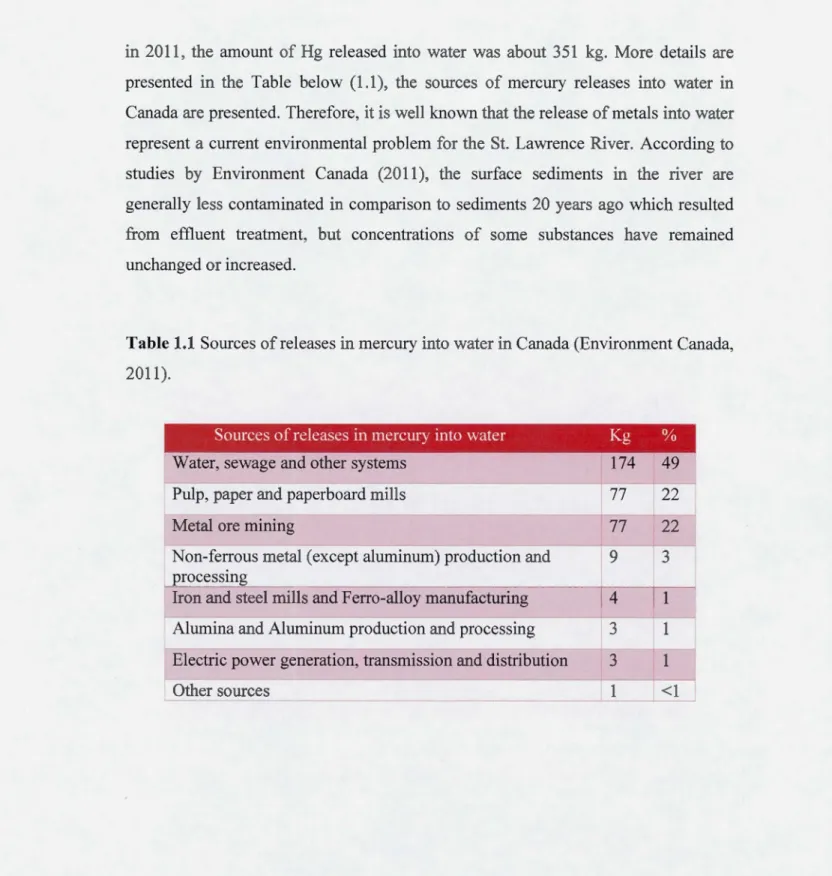
in 2011, the amount of Hg released into water was about 3 51 kg. More details are presented in the Table below (1.1), the sources of mercury releases into water in Canada are presented. Therefore, it is well known that the release of metals into water representa current environmental problem for the St. Lawrence River. According to studies by Environment Canada (2011), the surface sediments in the river are generally less contarninated in comparison to sediments 20 years ago which resulted from effluent treatment, but concentrations of sorne substances have remained unchanged or increased.
Table 1.1 Sources of releases in mercury into water in Canada (Environment Canada, 2011).
Sources of releases in mercury into water Kg %
Water, sewage and other systems 174 49
Pulp, paper and paperboard mills 77 22
Metal ore mining 77 22
Non-ferrous metal (except aluminum) production and 9 3 processmg
Iron and steel mills and Ferro-alloy manufacturing 4 1 Alumina and Aluminum production and processing 3 1 Electric power generation, transmission and distribution 3 1
1.2 Studied metal, mercury
Mercury is not degradable because it is a metallic element, so it can just converts into various species forms, and it is a naturally occurring element known as "heavy metal" which can be taxie for organisms at low concentrations (Jackson, 1998; Selin, 2009). In nature, mercury can have 3 possible conditions of valence state (Morel et al., 1998; Leermakers et al., 2005; Leopold et al., 2010): 1- Elemental mercury giving a volatile liquid colourless and odourless vapour at room temperature; 2- Inorganic mercury when combined with sulphur, chlorine or oxygen; 3- Organic mercury such as methyl mercury or dimethyl mercury.
As a natural element, mercury is ubiquitous in the environment (Figure 1.1 ), almost 10,000 tons produced from degassing of earth's crust, and approximately 20,000 tons/year is added by anthropogenic activity (Hansen and Dasher, 1997; Zahir et al., 2005). One of the main sources of anthropogenic discharge and mercury pollution in atmosphere is the emission of mercury from the coal smoke and also is estimated that it will increase at a rate of 5% a year (Zhang et al., 2002). Mercury in air eventually passes into rivers, lakes and oceans. With mercury contaminating rain (Domagalski et al., 2004; Levine, 2004), ground and seawater (Beldowski and Pempkowiak, 2003), no one is safe. When atmospheric mercury falls to earth, it can be changed by bacterial or chemical action into an organic form known as methylmercury that has the ability to migrate through cell membranes and "bioaccumulate" in living tissue. Bioaccumulation is the process by substances that builds up in a living organism from air or water, or through the contaminated food (Jackson, 1998; Zahir et al., 2005; Selin, 2009).
~
0 in :\tmo
.
phcrc (:\tercury vapour,;;)Hydrosphcrc
____
.,.
min
fos il fuel buming. chlomlkaiL industries. wastc incincrators
Ceosphcre (soit) (~iotransfonnation ~, _ _ _ _ ettles ont a~ inorg:mic mcrcu1y) from inorganic to organic mercury)
(sca, rivcr.;. lak<:s :111d grou nd '''Hier)
Figure 1.1 Mercury distribution in the environrnent (Zahir et al., 2005).
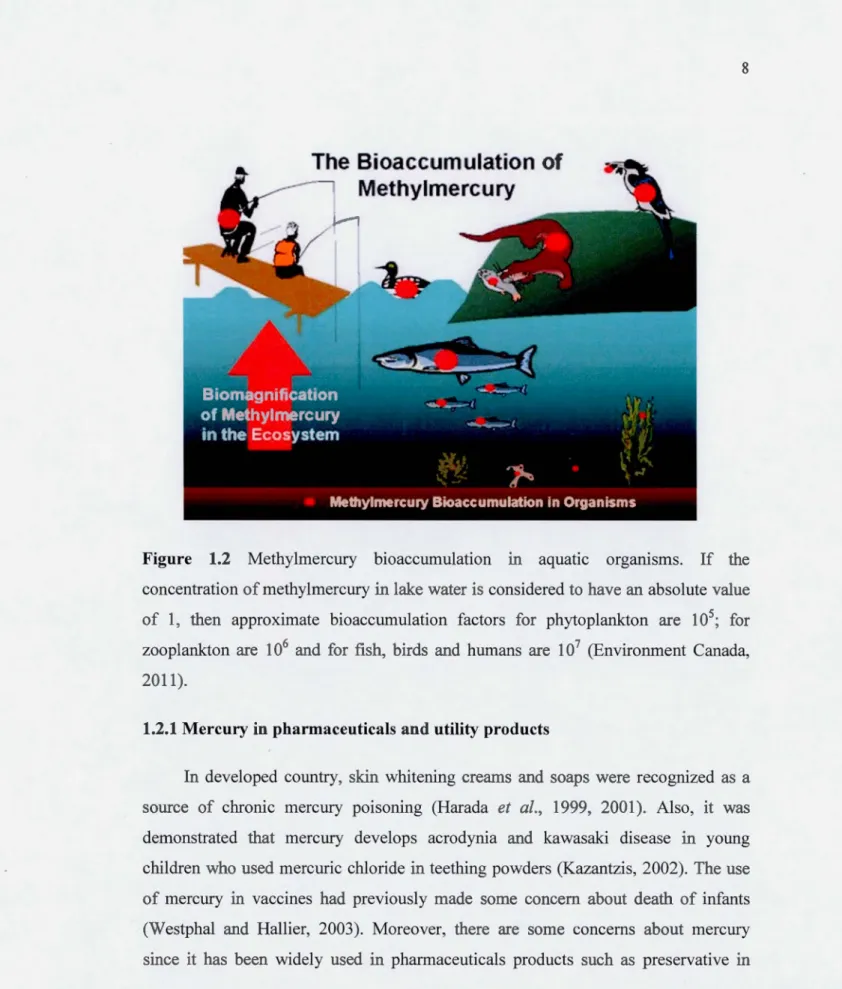
As it is shown in figure 1.2, in aquatic environrnents, inorganic mercury can be microbiologically transformed into lipophilic organic compound, methylmercury (the accumulated methylmercury is indicated by the red dots) (Environrnent Canada, 2011). Therefore, methylmercury is easily accumulated into phytoplankton, and then can be transfer through the food chain to zooplankton, fishes, mammals, birds and fmally to humans via consumption. Indeed, this process known as "biomagnification" is an environrnental concem since it inflicts increasing toxicity to species of higher trophic levels (Environrnent Canada, 2011).
The Bioaccumulation of
Methylmercury
Figure 1.2 Methylmercury bioaccumulation in aquatic organisms. If the concentration of methylmercury in lake water is considered to have an absolute value of 1, th en approximate bioaccumulation factors for phytoplankton are 1 05; for zooplankton are 106 and for fish, birds and humans are 107 (Environment Canada, 2011).
1.2.1 Mercury in pharmaceuticals and utility products
In developed country, skin whitening creams and soaps were recognized as a source of chronic mercury poisoning (Harada et al., 1999, 2001). Also, it was demonstrated that mercury develops acrodynia and kawasaki disease in young children who used mercuric chloride in teething powders (Kazantzis, 2002). The use of mercury in vaccines had previously made sorne concem about death of infants (Westphal and Hallier, 2003). Moreover, there are sorne concems about mercury since it has been widely used in pharmaceuticals products such as preservative in
Hepatitis B, Diphtheria, Pertussis, Acellular pertussis and Tetanus vaccines (Zahir et al., 2005).
1.2.2 Mercury toxicity and human health
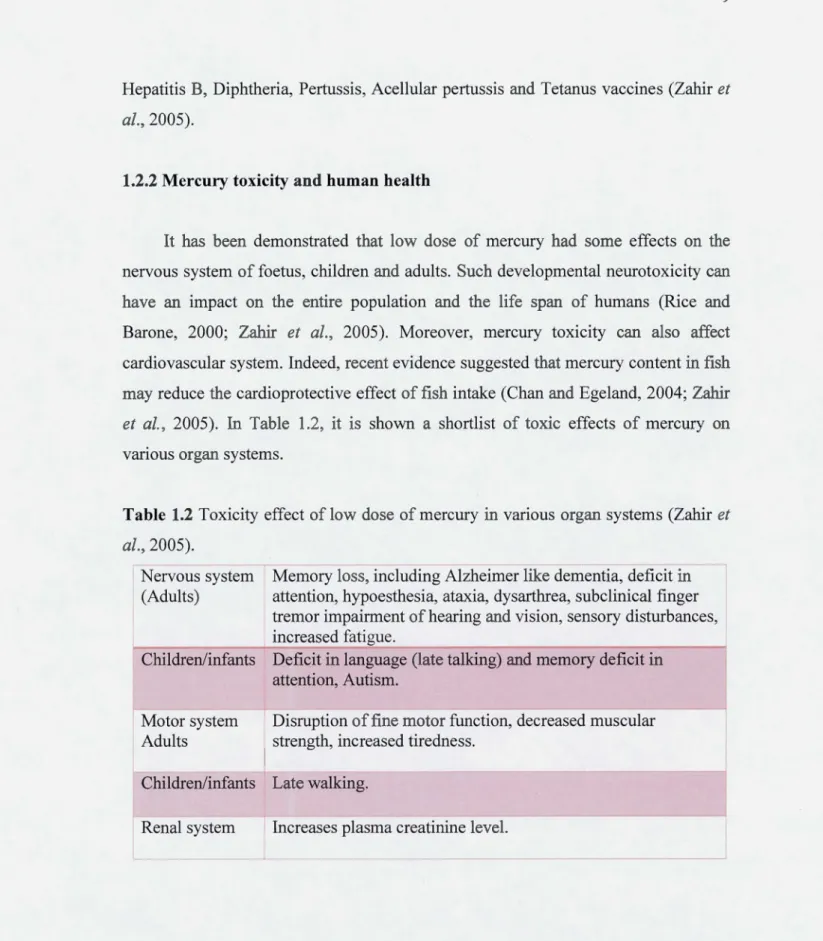
It has been demonstrated that low dose of mercury had sorne effects on the nervous system of foetus, children and adults. Such developmental neurotoxicity can have an impact on the entire population and the life span of humans (Rice and Barone, 2000; Zahir et al., 2005). Moreover, mercury toxicity can also affect cardiovascular system. Indeed, recent evidence suggested that mercury content in fish may reduce the cardioprotective effect of fish intake (Chan and Egeland, 2004; Zahir
et al., 2005). In Table 1.2, it is shown a shortlist of toxic effects of mercury on various organ systems.
Table 1.2 Toxicity effect of low dose of mercury in various organ systems (Zahir et al., 2005). N ervous system (Adults) Children/infants Motor system Adults
Memory loss, including Alzheimer like dementia, deficit in attention, hypoesthesia, ataxia, dysarthrea, subclinical finger tremor impairment of hearing and vision, sensory disturbances,
increased fatigue.
Deficit in language (late talking) and memory deficit in attention, Autism.
Disruption of fine mo tor function, decreased muscular strength, increased tiredness.
Children/infants Late walking.
Renal system Increases plasma creatinine level.
Cardiovascular Alters normal cardiovascular homoeostasis. system
Immune system
Reproductive system
exacerbates lupus like autoimmunity, multiple sclerosis, autoimmune thyroiditis or atopic eczema.
Decreases rate of fertility in both males and females, birth of abnormal offsprings.
1.3 Clean water technologies
The management of wastewater pollution has been an important environmental topic, especially during the last two centuries (Eccles, 1999): The elimination of biochemical oxygen demand (BOD), N and P, mater in suspension, coliforms and bacteria was the main objective for the remediation of wastewater. The wastewater treatment consists in several steps (Abdel-Raouf et al., 2012): The first step ofis the elimination of bulk materüils such as wood and heavy grain. The reduction of BOD by removing organic matter is the secondary treatment of wastewater. Tertiary wastewater treatment involves the elimination of metal ions of ammonium, nitrate, phosphate and of toxic organic compounds. Finally, the destruction of pathogens will be carried out by the stage of disinfection of wastewater.
Several conventional methods showed the removal of metals from aqueous solutions such as ion exchange, electrolysis, precipitation, filtration and evaporation (Fabiani, 1992; Aderhold et al., 1996). As a result, the conventional separation of metals from aqueous solutions as chemical precipitation and reverse osmosis requires large quantities of reagents and energy, which restricts the practice of these methods with low concentrations of metals (Ozdemir et al., 2005; Pehlivan and Altun, 2006).
1.4 Use of microalgae in water remediation
The contamination of wastewater by nitrogen, phosphorus, metals and organics
which are not processed completely by conventional treatment will cause environmental problems in the watercourse. The use of algae for the treatment of wastewater has been recently applied since sorne strains can be produced in large
quantities such as Chlorella and Dunaliella using nitrogen and inorganic phosphorus
for their growth (Abdel-Raouf et al., 2012). In addition, studies have shawn the capacity of algae to remove pollutants: For example, the capacity of C. reinhardtii has been proposed as a biotechnological approach interesting for the decontamination of organic pollutants (Wang et al., 2007; Zhang et al., 2011). However, the use of algal biomass from the industrial wastewater treatment is rarely appropriate for the production of food or chemicals such as fertilizer because of the existence of taxie
metals and organic contarninants (Mufioz and Guieysse, 2006). Therefore, the
utilization of wastewaters as nutrient sources can replace growth media and reduce the cultivation costs for algal growth economies. For example, it had been shawn that C. vulgaris could be cultured in wastewater for biomass production while nitrogen
and phosphorus are reduced during the tertiary treatment of wastewater (Wang et al.,
2010; Ruiz et al., 2014; Ponnuswarny et al., 2013). Another study had shawn that the cultivation of alga C. vulgaris on wastewater had two positive effects, first the removal of inorganic elements from wastewater and second the produced biomass used as a source for biofuel or byproduct (Fathi et al., 2013).
Moreover, photobioreactors systems (open or closed) for the treatment of
wastewater using algae need a high efficiency for the use of light, a good mix, low hydrodynamic stress on photosynthetic algal cells, a low risk of contamination, a
minimum of space, ease of cleaning, an economical energy consumption and ease to
example, Cyanotech Corp in Hawaii and Earthrise Farms in California are two companies that grow algae on a large scale (Richmond, 2004; Mufioz and Guieysse,
2006; Spolaore et al., 2006). However, the loss of water by evaporation and contamination, large space, predation risk, no control over volatilization of pollutants and on growing conditions are disadvantages concerning open compared with closed
photobioreactors systems (Borowitzka, 1999; Pulz, 2001; Mufioz and Guieysse,
2006).
At commercial level, the biomass production of microalgae has been found to
be useful for many applications in various branches of industry such as the production of dyes, food additives, antibiotics and bio fuel energy (Liang et al., 2009; Gors et al., 2010; Priya, 2012; Mallick et al., 2012). These studies showed that the industrial potential of green microalgae relies on their rapid growth of biomass in photobioreactors, since they need a relatively small area required for cultivation in
comparison to crop plants such as maize. Moreover, optimizing'the growth media is a critical step for algal biomass production at large scale, since the cost of growth media nutrients required in large quantities can be significant (Sharma et al., 2011; Blair et al., 2014).
1.5 Biochemistry of green algae Ch/orel/a vulgaris as a model of study
Green microalgae are a large group of microorganism eukaryotes using the solar energy to perform photosynthesis to create biomass with water, carbon dioxide
and other nutrients. As the major primary producers in freshwater ecosystems,
microalgae play a primordial role in the functioning of aquatic eco system, and can be
indicative of the environmental quality of freshwater for aquatic organisms of higher tropic levels (Buchanan et al., 2000).
The spec1es C. vulgaris presents several morphological and physiological advantages, belonging to the phylum of Chlorophyta (Vymazal, 1995). It is single-cell and spherical in shape, about 2 to 10 J..Lm in diameter, without flagella (Figure 1.3). Since this algal species can bioaccumulate easily aquatic pollutants, it had been used as a sensitive biosensor of environmental quality for freshwater, permitting the assessment of the risk of toxicity in the development of environmental regulations (Rioboo et al., 2002; Gonzalez-Barreiro et al., 2006; Afkar et al., 2010; Ou-Yang et
al., 2013). For example, it has been shawn an inhibition of growth during 96 hon C. vulgaris for two herbicides used wide-spread, isoproturon (class of phenylurea) and terbutryn (class oftriazine) (Rioboo et al., 2002): These herbicides classes act on the photosynthesis process by displacing a plastoquinone from its binding site in the photosystem II. However, the possibility of making a bioremediation system for the removal of herbicides in water with this species has been shawn for short time of exposure only. Indeed, it was shawn recently that, during 24 hours oftreatment, algal cells of C. vulgaris were able to bioconcentrate efficiently the triazine herbicides atrazine and terbutryn (Gonzâlez-Barreiro et al., 2006). Moreover, the change in growth rate of C. vulgaris has been used as an indicator of the inhibitory and stimulatory effects of several metals (zinc, cobalt and copper) depending to their concentration in the aqueous solution (Afkar et al., 201 0). In a recent study, the taxie effects of cadmium on C. vulgaris were investigated during 96 h which resulted in the alteration of cellular functions as indicated by the response of several biomarkers such as cell growth, photochemical efficiency of photosynthesis by chlorophyll a fluorescence and cell viability (Ou-Yang et al., 2013).
Figure 1.3 Photo of algal cells of Chlorella vulgaris. Seattle, Washington, USA, cement wall, 1000 x, DIC. 01 Nov 2008, taken by Karl Bruun©
( sko [email protected]).
1.6 Photosynthesis
Photosynthesis is the only source of solar energy storage on Earth permitting the production of biomass by plants and algae which use directly the light energy by the process of photosynthesis permitting the synthesis of organic compounds (Ort and Whitmarsh, 2001): The oxygenic photosynthesis is a redox reaction able to perform the photolysis of water providing the electrons for the reduction of carbon dioxide (C02) and the synthesis of carbohydrates. Therefore, photosynthesis includes absorption of light, the transformation of energy, electron transport and enzymatic pathways. The photosynthesis takes place in a cellular organelle called chloroplast which is surrounded by a lipid bilayer and an internai membrane system called thylakoid (Taiz and Zeiger, 2010) (Figure 1.4) : The thylakoids membranes are in an
aqueous matrix called stroma, and there is a regional distinction by granum and stromallamellae (a granum is made up of lü to 100 dises).
Gran a lamellae (sl.:lc of
Stroma 1 ermembrane space
lamellae
t la 1ds) 1 ner membrane
Ou er membr e
Gran m
Figure 1.4 (A) Schematic diagram of a chloroplast including thylakoid membranes (Taiz and Zeiger, 201 0).
The photosynthetic process can be divided into two phases (see Figure 1.5) according to Malkin and Niyogi (2000): During the light reaction, 0 2, ATP (adenosine triphosphate) and NADPH (nicotinamide adenine dinucleotide phosphate) are synthesized, and ATP and NADPH produced are used by stroma! enzymes for the synthesis of carbohydrate by fixing C02 in the cycle of Calvin-Benson.
hu
~
Light reactions (Thylakoid membranes)t
Carbon reactions (Stroma! enzymes)t
Figure 1.5 Light and dark reactions of photosynthesis (Malkin and Ni yogi,
2000).
1.6.1 Photosynthetic apparatus
Oxygenic photosynthesis depends on two photosystem reaction center complexes, Photosystem II (PSII) and Photosystem I (PSI), that are linked by electron transport carriers (Malkin and Niyogi, 2000; Ort and Whitmarsh, 2001; Whitmarsh and Govindjee, 2002). In paticular, the PSII is composed of a core reaction center
surrounded by a light-harvesting antenna system (Whitmarsh and Govindjee, 2002):
The core center includes Dl and D2 polypeptides that bind the cofactors of the photochemical charge separation and electron transfer carriers that oxidize water and reduce plastoquinone pool. Moreover, the antenna system consists of protein complexes that contain light-absorbing molecules, as chlorophylls and others
accessory pigments, which permit the capture of photons and the transfer of the excitation energy to reaction centers where primary charge separation occurs. Therefore, photosynthesis is driven by visible light that is absorbed by chlorophylls
and carotenoids bound to the light-harvesting proteins that surround the PSII and PSI reaction centers in the photosynthetic membrane.
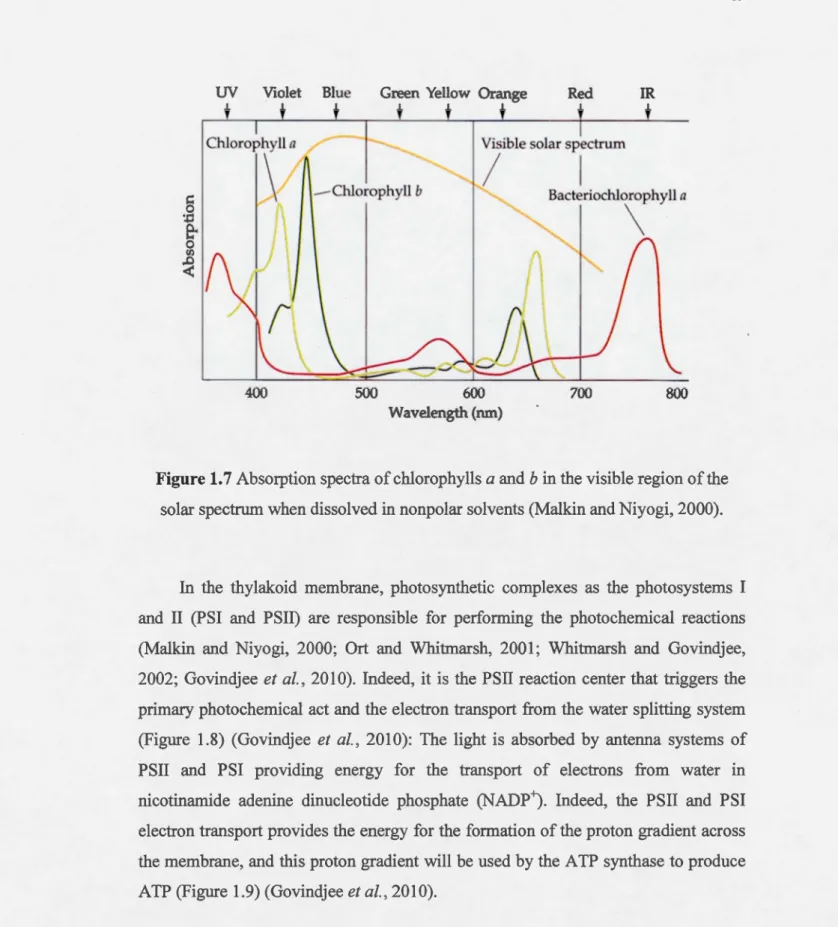
The major light-absorbing pigment in many algae is· chlorophyll, a cyclic tetrapyrrole in which the nitrogens of the pyrroles are coordinated to a central magnesium ion (Malkin and Niyogi, 2000; Ort and Whitmarsh, 2001; Whitmarsh and Govindjee, 2002), and it is a green pigment that strongly absorbs red and blue light since it absorbs wavelengths of 430 and 680 nm while the green light will be reflected (see Figures 1.6 and 1.7; Malkin and Niyogi, 2000). The light antenna collector of PSII possess between 200-250 molecules of chlorophylls and 60-70 molecules of carotenoids, enhancing the spectrum of visible light absorbed by the antenna system (Govindjee et al., 201 0) : The light is absorbed by chlorophylls and carotenoids which are linked to the light collector complexes in the membrane of thylakoids. In fact, chlorophyll molecule enters into the excited state and the excitation energy can be transferred to the reaction centers causing the primary photochemical act. Blue light has a higher energy than red light causing the passage of chlorophyll in the upper excited state. During the absorption of light by pigments, these are electrons n that interacts with visible light. In fact, the cycles of chlorophyll have conjugated double bonds and electron n is involved in responsible for the absorption of light. Excitation energy is transferred by resonance of a molecule of chlorophyll to another until the special pair of Chl reached the PSII reaction center, called P680, which will rise to an excited state P680*. The internai passages or relaxations take place during the return of the chlorophyll excited at a lower level than the energy of excitation energy dissipation in the form of heat or in the form of fluorescence (Ort and Whitmarsh, 2001; Whitmarsh and Govindjee, 2002; Govindjee
Chlorophyll b 0 pl Chlorophyll a CHO Chlorophyll d Chlorophyll c plO
uv
+
Green Yellow Orange Red
+
+
+
Visible solar spectrum
1
1 TR+
" Chlo,op\11 a ' ·- Chlomphyll b 0 Bacteriochlorophyll a\
·.c
0.....
0 (/) .D<t:
400 500 600 Wavelength (nm) 700 800Figure 1.7 Absorption spectra of chlorophylls a and b in the visible region of the
solar spectrum when dissolved in nonpolar solvents (Malkin and Niyogi, 2000).
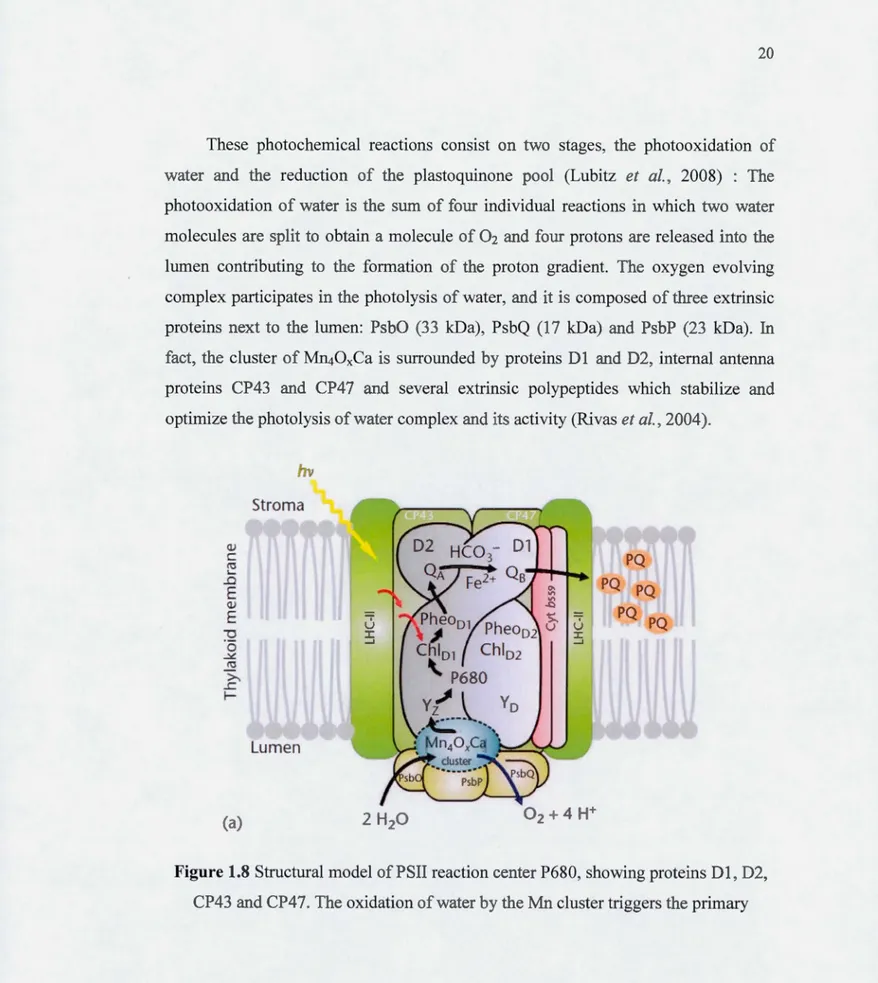
In the thylakoid membrane, photosynthetic complexes as the photosystems I and II (PSI and PSII) are responsible for performing the photochernical reactions (Malkin and Niyogi, 2000; Ort and Whitmarsh, 2001; Whitmarsh and Govindjee, 2002; Govindjee et al., 2010). Indeed, it is the PSII reaction center that triggers the primary photochernical act and the electron transport from the water splitting system (Figure 1.8) (Govindjee et al., 2010): The light is absorbed by antenna systems of PSII and PSI providing energy for the transport of electrons from water in nicotinarnide adenine dinucleotide phosphate (NADP+). Indeed, the PSII and PSI electron transport pro vides the energy for the formation of the proton gradient across the membrane, and this proton gradient will be used by the ATP synthase to produce ATP (Figure 1.9) (Govindjee et al., 201 0).
These photochemical reactions consist on two stages, the photooxidation of water and the reduction of the plastoquinone pool (Lubitz et al., 2008) : The photooxidation of water is the sum of four individual reactions in which two water molecules are split to obtain a molecule of 02 and four protons are released into the lumen contributing to the formation of the proton gradient. The oxygen evolving complex participates in the photolysis of water, and it is composed of three extrinsic proteins next to the lumen: PsbO (33 kDa), PsbQ (17 kDa) and PsbP (23 kDa). In fact, the cluster of MI140xCa is surrounded by proteins D 1 and D2, internai antenna proteins CP43 and CP47 and several extrinsic polypeptides which stabilize and optimize the photolysis ofwater complex and its activity (Rivas et al., 2004).
Q) c t\l ' -.D E Q) E :g 0 ~ t\l >... .r: 1-(a) Stroma Lumen
Figure 1.8 Structural model of PSII reaction center P680, showing proteins D 1, D2,
photochemical act. Electrons are transferred from P680 to plastoquinone molecules
QA and Q8 (Govindjee et al., 2010).
E c ..,. (a) (b) 0 ~ J 1.6 -1.2 -0.8 -0.4 0.0 0.4 0.8 1.2 1.6
'"
3 H"· · jPhotosystem Il Photosystem 1 ATP synthase
2 AOPH
1
1 ms 2 AOP'
4W
Figure 1.9 (a) Thylakoid membrane organization ofphotosystems and electron
transport carriers in higher plants. (b) Z-scheme indicating the Em values of
1.6.2 Energy dissipation through fluorescence
Several research groups (Strasser and Strasser, 1995; Strasser et al., 2004; Lazar, 2006; Baker, 2008; Govindjee et al., 2010) participated to the development of a comprehensive model representing the photochemical reactions within the PSII in which the excitation energy can be used for photochemistry or dissipated in the forms of chlorophyll fluorescence and heat (Figure 1.1 0). Therefore, it was considered that the photochemistry of PSII was in competition with the processes of fluorescence emission and heat loss.
Antenna system with an open reaction centre
Fluorescence (Fr)
Antenna system with a closed reaction centre Fluorescence (Fmax)
Figure 1.10 Schematic representation of the excitation energy transfer (small red arrows) between chlorophyll molecules in the light collector antenna system. Green dises represent chlorophylls a and b, and yellow dises represent carotenoids;
the darker green dise represents an open reaction center and the lighter green dise represents a closed reaction center. (a) the reaction center is open and the energy is used for charge separation, while the fluorescence emission is minimal (labelled as Fo); (b) the reaction center is closed and the fluorescence emission is maximal (FM) (Govindjee et al., 201 0).
The chlorophyll fluorescence emission cornes from chlorophylls of the light collector antennas of PSII which can be used as a very sensitive, rapid and non-invasive method (Lazar, 2006; Govindjee et al., 2010). Two main steps are observed in the fluorescence induction, the rapid increase (1 sec) of the fluorescence intensity from an initial level (Fo) to a maximum intensity level (FM) under a saturating light (Lazar, 2006; Govindjee et al., 2010): The minimum fluorescence level is named basal fluorescence (Fo) when QA is oxidized, and when the reaction center is closed,
the chlorophyll fluorescence emission is maximum which is named maximum fluorescence level (FM), when QA is completely reduced.
When the rapid kiuetic of chlorophyll fluorescence was analyzed in a logarithmic time scale, different steps were identified as 0-J-1-P, showing different states of redox carriers of electrons from PSII (Popovic et al., 2003; Lazar, 2006; Govindjee et al., 201 0): The 0-J transition represents the reduction of the primary acceptor of electron, QA; The emission of fluorescence to the transition I shows the first reduction of Q8, the 1-P transition represents an accumulation of Q8 completely reduced (QA-Q8 -2) and the maximum fluorescence level is reached when the PQ are completely reduced. Therefore, it was showed in ecotoxicological studies that any alteration of the electron transport by chemical inhibitors will be indicated by the
change of theses steps (Popovic et al., 2003). The figure 1.11 is showing the change of the fluorescence transients of the fluorescence induction, which is affected differently depending on the electron transport inhibitor, DCMU or mercury, due to their different mode of action (Popovic et al., 2003).
1200 o<> 1000 ... 1/) ;!::: c 800 ::::1 ...:. ~ Q) J
....
~-
<> Q) 600 <> (.) <> <> c <> Q) <> (.) 0 1/) Q) .... 400 0 ::::1 u.. 200..
0 0.001 0.01 0.1 10 100 1000 Time (ms)Figure 1.11 The rapid and polyphasic (OJIP) rise of Chl a fluorescence induction presented on a logarithmic time scale when L. gibba plants were exposed to a saturating light (9000 f.!IDOl of photons m-2 s-1) after a dark adaptation of20 min. Legend: Control, round; treated 5 h to 1 00 flg L -l of Hg2+, triangle; treated 5 h to 1 0 x
1.7 Synthesis of glutathione and phytochelatins for metal detoxification
Phytochelatins (PCs) are corriposed of three amino acids: glutamine (Glu), cysteine (Cys) and glycine (Gly), and the general structure (1'-Glu-Cys)n-Gly has been proposed for phytochelatin, where
«
n » can be between 2 and 11 (Crawford et al.,2000; Pal and Rai, 2010) (see Figure 1.12). When algae or plants are exposed to toxic metals such as mercury, the synthesis of thiol-rich peptides as glutathione (GSH) and phytochelatins (PCs) are induced for their activities in the protection against oxidative stress and metal detoxification processes (Wu and Wang, 2012).
H 0 ( H H 0
H/N~~~N~OH
O~OH
Oy-Glu - Cys - Gly
H
0(7H
0HtN~~~N~OH
O~OH
O[y-Glu - - Cys
-t-
GlyFigure 1.12 Chernical structures of glutathione and phytochelatin (Pal and Rai,
2010).
The glutathione (GSH) protects cells by reducing the reactive forrns of oxygen (ROS) and also by binding to metals (Crawford et al., 2000; Stoiber et al., 2010): In the first stage, the synthesis of 1'-glutamylcystein is done with glutamate and L-cysteine which is catalyzed by the enzyme 1'-glutamylcystein synthetase; In the
second step, the addition of glycine is catalyzed by the enzyme glutathione synthetase to produce GSH. Finally, the GSH level remains high due to the intervention of the enzyme glutathione reductase in the reduction of oxidized glutathione which is essential for maintaining the redox of the cytoplasm. This interconversion between reduced and oxidized form of glutathione is illutrated in Figure 1.13.
It is well accepted that phytochelatins are formed from glutathione in the presence of metal ions, following the intervention of an enzyme, the -r- glutamyl-cysteine dipeptide transpeptidase, known as the phytochelatin synthase (Grill et al.,
1987; Grill et al., 1989; Crawford et al., 2000; Pal and Rai, 2010). In fact, Grill et al.
(1987) first observed that the level of phytochelatins decreased in the presence of increasing concentrations of buthionine sulfoximine, which is an inhibitor of
(A) (B) Gly + 2
y-
~
_">..._...:::,___/~-->
y
-
~
1 1 Cys SH S Reduced 1s
glutathione + .._...
....
y-
~
Oxidized glutathionc y-Glu Reduced glutathioneFigure 1.13 (A) Interconversion between reduced and oxidized form of glutathione; (B) Structure of reduced glutathione (Crawford et al., 2000).
1.8 Sequestration of rn etals in the vacuole
Moreover, it has been reported that phytochelatins are induced in plant cells by several metals such as cadmium, zinc, copper, lead and mercury, since they are involved in the cellular distribution and vacuolar sequestration of metal ions (Crawford et al., 2000). lndeed, it is because of the cysteine that phytochelatins are able to form complexes with metals preventing their excess in the cytosol by vacuolar sequestration (Kobayashi and Yoshimura, 2006; Pal and Rai, 2010).
Previously, Hu and colleagues (2001) reported the formation of two types of
complex PC-Cd in C. reinhardtii, a complex of low molecular weight (LMW) which
is formed quickly after exposure to Cd and a complex of high molecular weight
(HMW) from the rapid conversion ofHMW to LMW complex (Figures 1.14). In fact,
they mentioned that the HMW complex was formed by the addition of sulfide in the
LMW complex. Indeed, the complex of high molecular weight (HMW) is very stable
and plays an essential role for Cd storage in the vacuole during the process of
detoxification (Hu et al., 2001). The formation of low and high molecular weight
phytochelatin-Cd complexes is illustrated in Figure 1.15.
? . \
:\
1 '1il
Il
'1
Figure 1.14 Mechanism of sequestration of cadmium in the cell by phytochelatins;
LMW: low molecular weight phytochelatin Cd complex; HMW: high molecular
Figure 1.15 Formation of low or high molecular weight phytochelatin-Cd complexes. Interaction of PCs coordinately binding with sulfur atoms of Cys residues from either
2.1 Algal culture
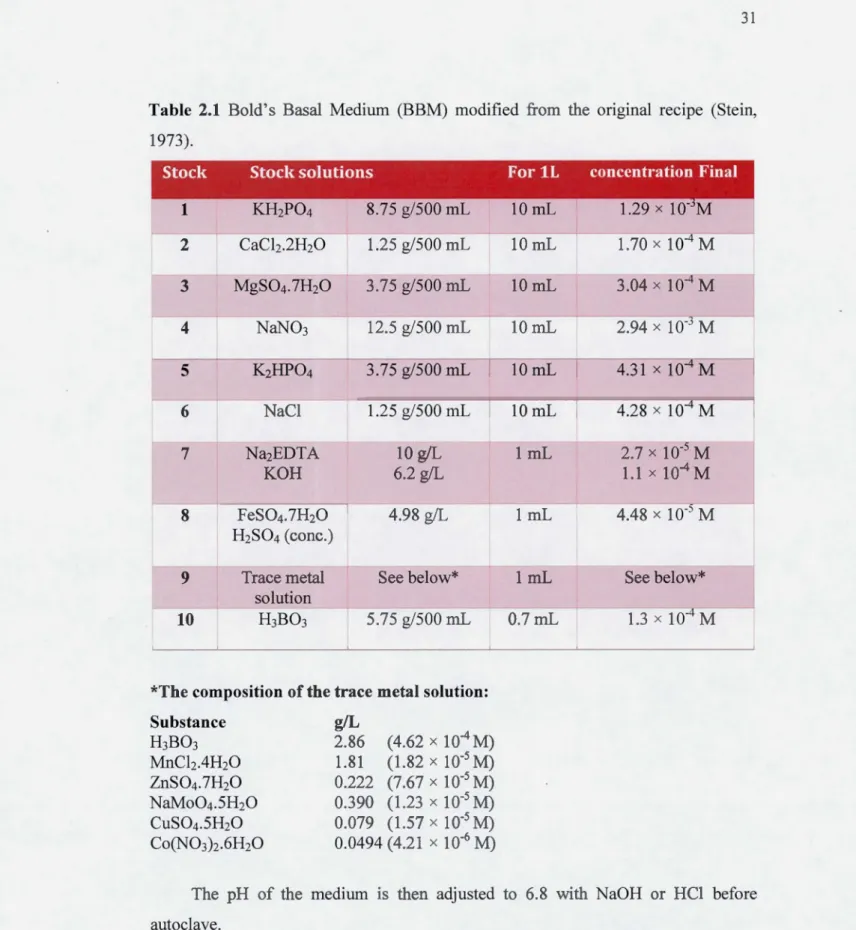
The green alga C. vulgaris was provided by the Culture Collection of Algae from the Canadian phycological culture center (University of Waterloo, ON). The alga C. vulgaris was grown in Bold's Basal Medium (BBM) under a constant temperature of 21 ± 1 °C and a continuous irradiance of 80 ± 10 Jlmol of photons m-2 s-1 provided by white fluorescent bulbs (Sylvania Grolux F36W, Drummondville, Canada). The BBM culture's composition is reported in Table 2.1 (Stein, 1973). This medium is highly enriched in nutriments and is used for many species of green algae . . The culture medium was then sterilized by using the autoclave. All stock cultures were gently mechanically shaken (at 90 rpm). For all algal cultures, glasswares were cleaned by soaking them in 10 % HCl for at least 24 h, and then rinsed three times with de-ionized water.
Table 2.1 Bold's Basal Medium (BBM) modified from the original recipe (Stein, 1973). 2 CaCh.2H20 1.25 g/500 mL 3 MgS04.1H20 3.75 g/500 mL 4 NaN03 12.5 g/500 mL 5 K2HP04 3.75 g/500 mL 6 NaCl 1.25 g/500 mL Na2EDTA 10 g/L KOH 6.2 g/L FeS04.7H20 4.98 g/L H2S04 (conc.)
9 Trace metal See below*
solution
10 H3B03 5.75 g/500 mL
*The composition of the trace metal solution:
Substance H3B03 MnChAH20 ZnS04.1H20 NaMo04.5H20 CuS04.5H20 Co(N03)2.6H20 g/L 2.86 (4.62 x 10"4M) 1.81 (1.82 x 10⁻⁵ M) 0.222 (7.67 x 10⁻⁵ M) o.390 (1.23 x 1 o·~ M) 0.079 (1.57 x 10-) M) 0.0494 (4.21 x 10⁻⁶ M) 10mL 10mL 3.04 x 10⁴ M 10mL 2.94 x 10- M 10mL 4.31 x 10 M 10mL 4.28 x 10⁴ M 1 mL 2.7 x 10- M 1.1 x 10⁻⁴ M 1 mL 4.48 x 10- M 1 mL See below* 0.7mL 1.3 x 10⁻⁴ M
The pH of the medium is then adjusted to 6.8 with NaOH or HCl before
2.2 Determination of cell density
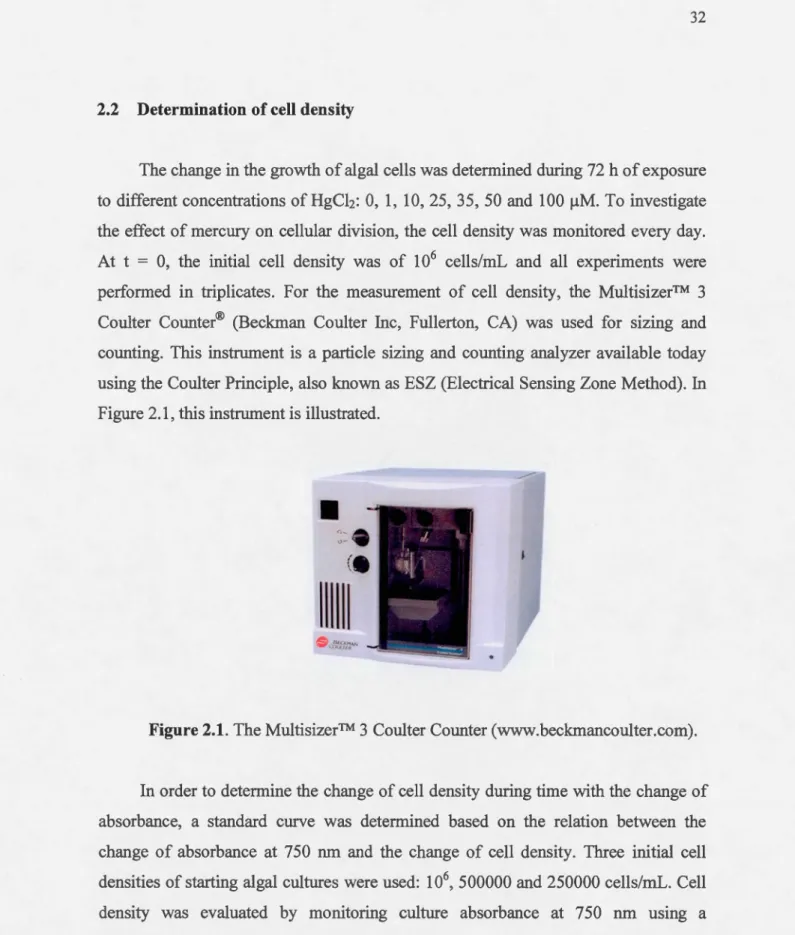
The change in the growth of al gal cells was determined during 72 h of exposure to different concentrations of HgCh: 0, 1, 10, 25, 35, 50 and 100 j.!M. To investigate
the effect of mercury on cellular division, the cell density was monitored every day.
At t
=
0, the initial cell density was of 106 cells/mL and all experiments wereperformed in triplicates. For the measurement of cell density, the Multisizer™ 3
Coulter Counter® (Beckman Coulter Inc, Fullerton, CA) was used for sizing and
counting. This instrument is a particle sizing and counting analyzer available today
using the Coulter Principle, also known as ESZ (Electrical Sensing Zone Method). In
Figure 2.1, this instrument is illustrated .
•
~-111111
Figure 2.1. The Multisizer™ 3 Coulter Counter (www.beckmancoulter.com).
In order to determine the change of cell density during time with the change of
absorbance, a standard curve was determined based on the relation between the
change of absorbance at 750 nm and the change of cell density. Three initial cell
densities of starting algal cultures were used: 106, 500000 and 250000 cells/mL. Cell
spectrophotometer UV-Vis (Lambda 40, Perkin-Elmer, Woodbridge, Canada). Then,
the change of cell density and absorbance at 750 nm were monitored during 72 h
when algal cells of C. vulgaris were grown at 21 ± 1
o
c
in BBM under a constantillumination of 80 ± 10 ~J.mol of photons m-2 s-1• From this relation, a linear fitting
curve of the data and its formula was determined (Figure 2.2).
1.60E+07 1.40E+07 1.20E+07 ,.-._ ~ l.OOE+07
e
... .!l-
~ ~ 8.00E+06 .._,è
....
'Il=
~ 6.00E+06 "0-
'QSu
4.00E+06•
2.00E+06 O.OOE+OO 0 0.1•
•
0.2 y = 3E+07x + 197793 R2 = 0.9925 0.3 0.4 Absorbance at 750 nm 0.5 0.6Figure 2.2 Standard curve indicating the relation between the change of cell density
and the change of absorbance at 750 nm by using three initial algal cell densities of C.
2.3 Analysis by Atomic Absorption Spectrometry
In this study, the bioaccumulation of mercury was quantified in al gal biomass of C. vulgaris by using Atomic Absorption Spectrometry (AAS), which was determined as mg of Hg per mg of dry weight. The quantification of mercury was done using a V arian SpectrAA 220 FS system.
The configuration of the atomic absorption spectrometer possesses three basic required components that are shawn in Figure 2.3 (Richard et al., 1993):
(1) A light source, (2) A sample cell,
(3) A means of specifie light measurement.
*
Sample Cell Specifie LightMeasurement Llght
So
ureeFigure 2.3 Technical requirements for absorption spectrometry (Richard et al.,
1993).
The components inside the atomic absorption system are illustrated in the Figure 2.3. There is a light source, a hollow cathode lamp that is designed to emit the atomic spectrum of a particular element, and specifie lamps can be selected for analytical use depending on the element (Richard et al., 1993).
Light Source
1
Sample Cell 1 Specifie Light Measurement1
1
1:
1
~-z+g+E§a 0~~~~.~.~~.'
1
1
Monochromator:
1
1 Chopper Electronics 1 Flame 1 1 (or Furnace)Figure 2.4 Basic representation of an atomic absorption spectrometer (Richard et al., 1993).
2.4 Bioaccumulation of Hg in algal biomass
2.4.1 Standards used
The range of standard solutions was used according to the detection limit range of the atomic absorption spectrometry detector. All standard solutions were prepared in BBM with different concentrations of standard Hg(II): 200, 100, 50, 25, 10 and 0.5 mg/L. All solutions were stored at room temperature. The Figures 2.5 and 2.6 show the relation between the change of absorbance (Abs) at 253.652 ± 0.5 nm and the concentration of the standard solutions, for respectively 24, 48 and 72 h of experimental exposures.
0.3 0.25 V'l 0 0.2 -H N V'l \0 M 0.15 V'l N
-
~"'
0.1 .Q<
0.05 0 0 50 y=
0.0012x+
0.0049 R2=
0.9989 100 150 200 [HgCI2] mg/L 2500.3
0.25 0.2 ln 0 -H N 0.15 y=
0.0012x + 0.0027 ln ~ R2=
0.9997 M ln N....
~ 0.1"'
,.Q<
0.05 0 0 50 100 150 200 250 [HgCI2] mg/LFigure 2.6 Standards curve ofHg(II) for 72 h of exposures.
2.4.2 Stock solutions of mercury
For experimental treatment conditions, stock solutions of HgCh were prepared in the medium BBM having the following concentrations: 1, 10, 25, 35, 50 and 100 ~-tM. All stocks solutions were stored at 4 °C.
2.5 Treatment conditions and preparation of samples
Before the preparation of experiments, all glassware and plastic botties were cleaned by soaking with 10 % HCl for at least 24 h, and then rinsed three times with